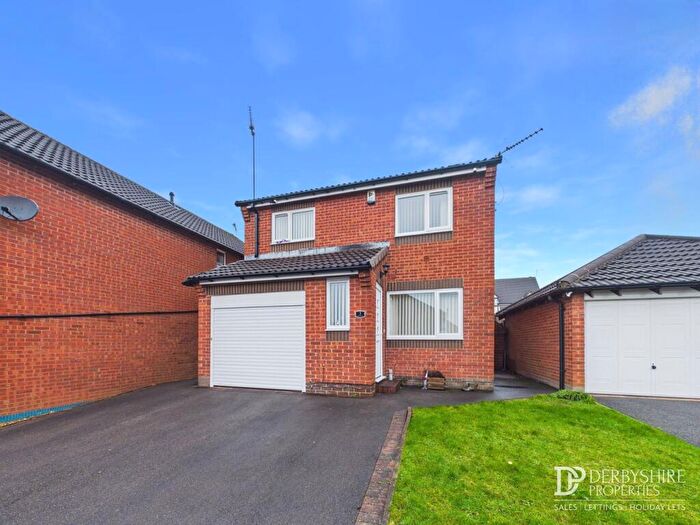
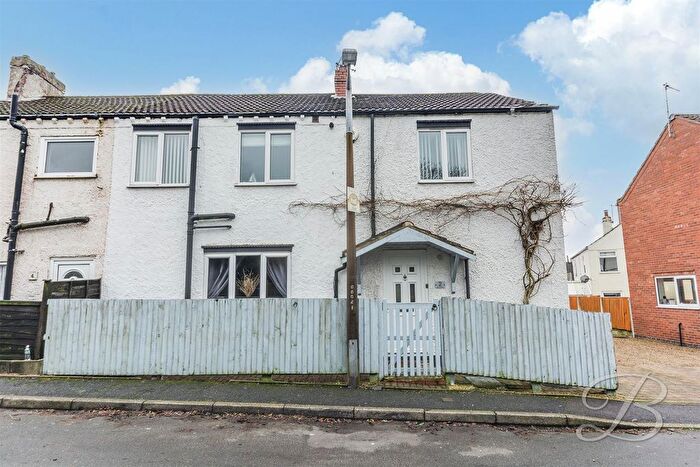
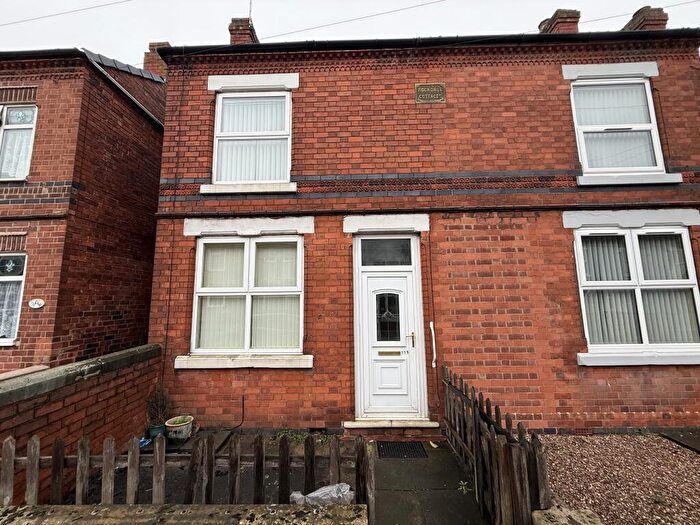
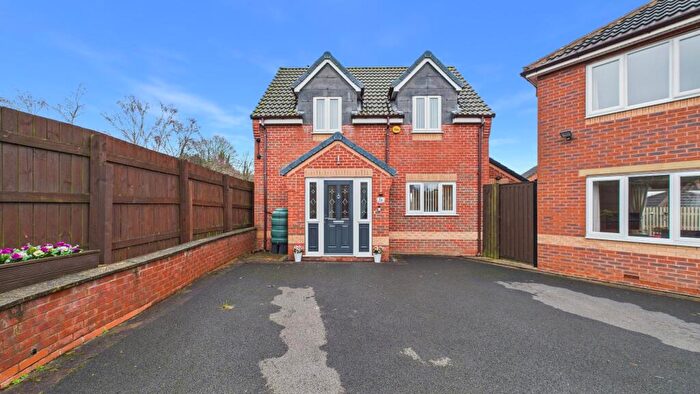
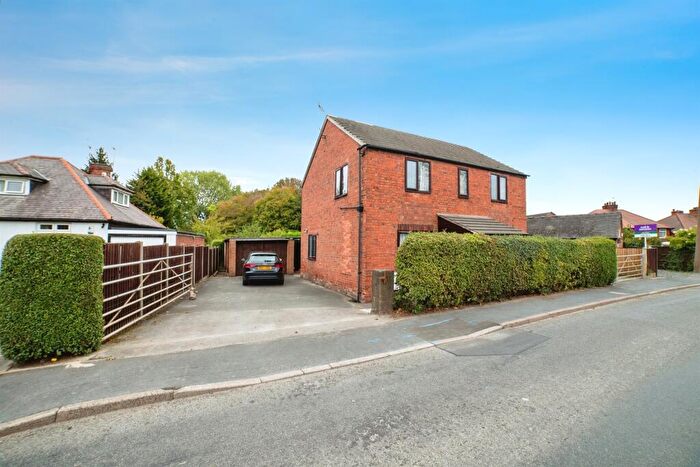
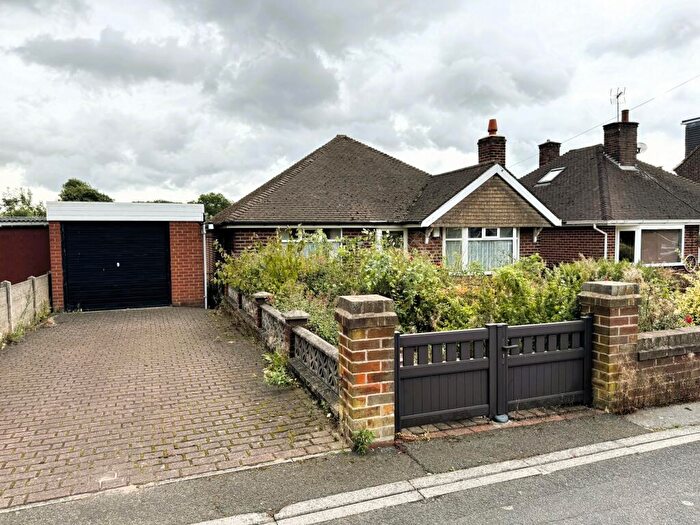
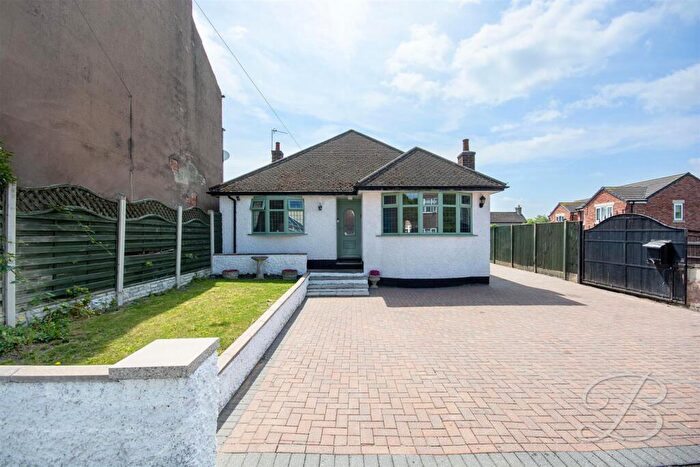
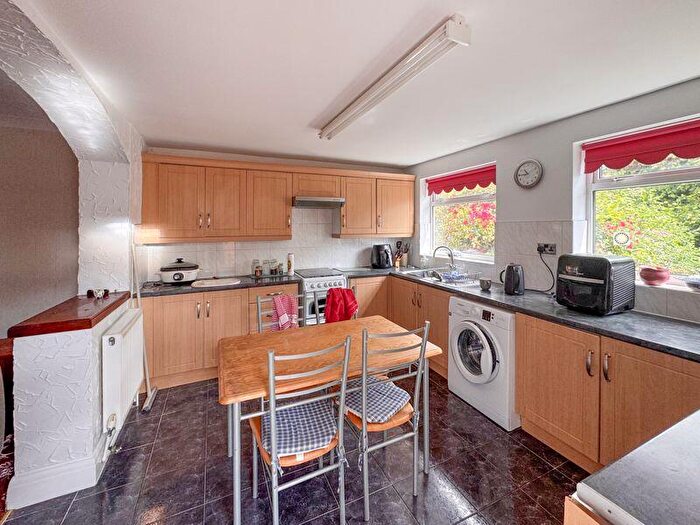
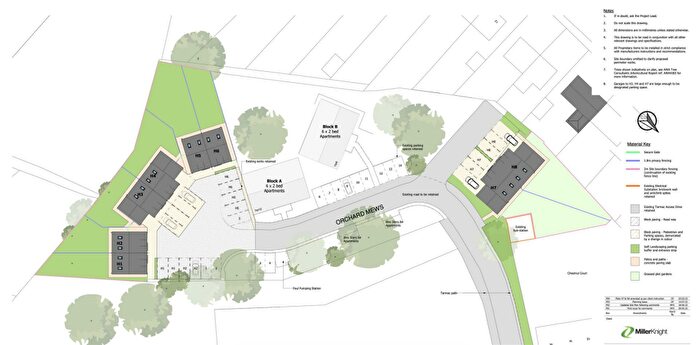
Houses for sale & to rent in Pinxton, Nottingham
House Prices in Pinxton
Properties in Pinxton have an average house price of £169,466.00 and had 154 Property Transactions within the last 3 years¹.
Pinxton is an area in Nottingham, Derbyshire with 1,867 households², where the most expensive property was sold for £380,000.00.
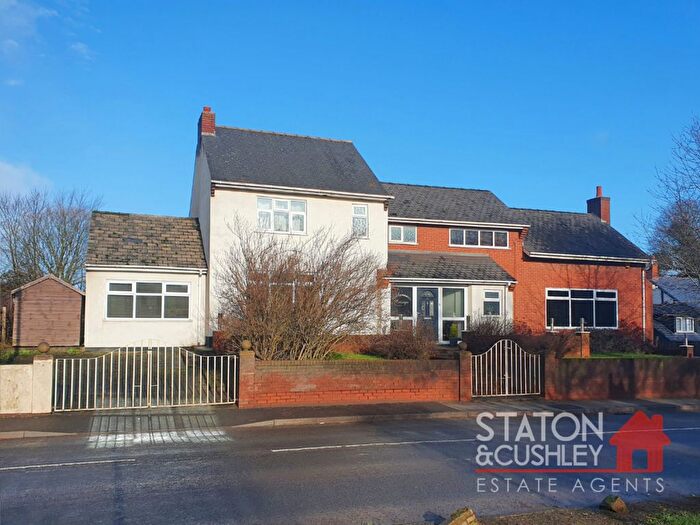
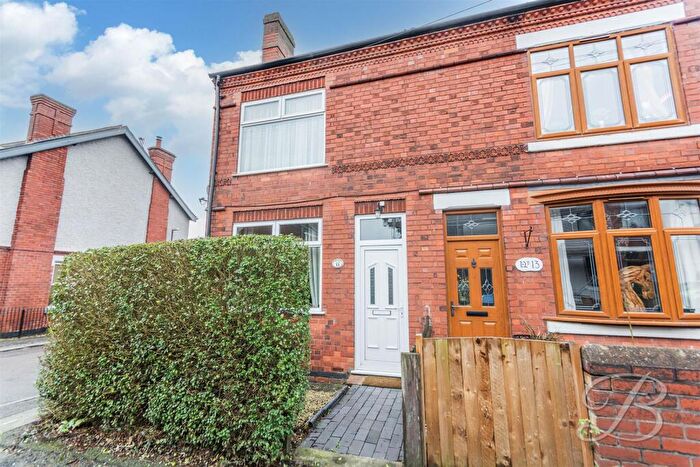
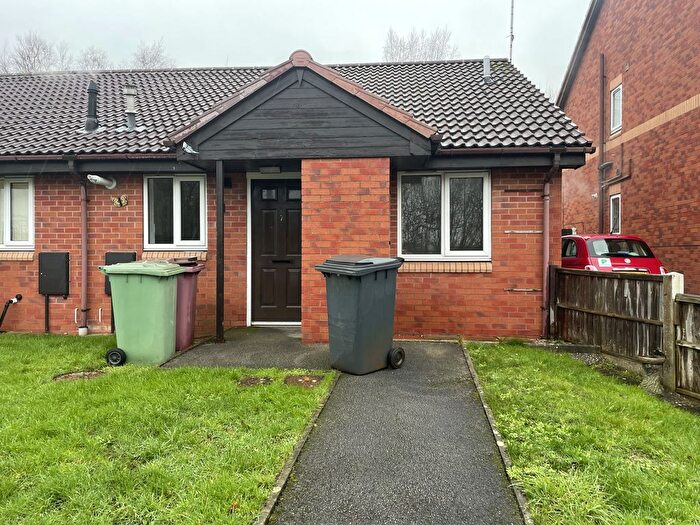
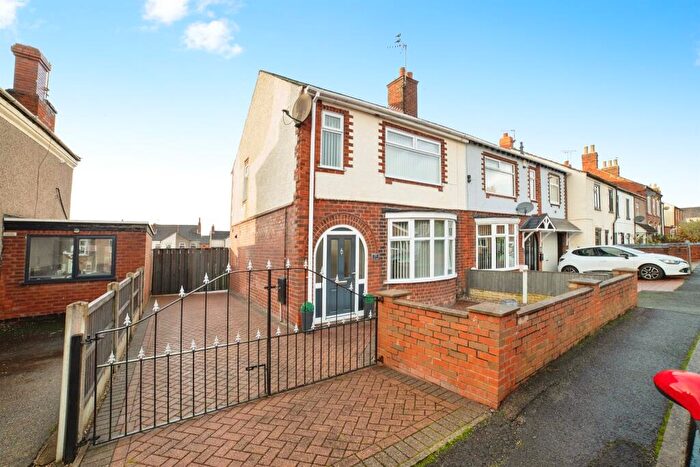
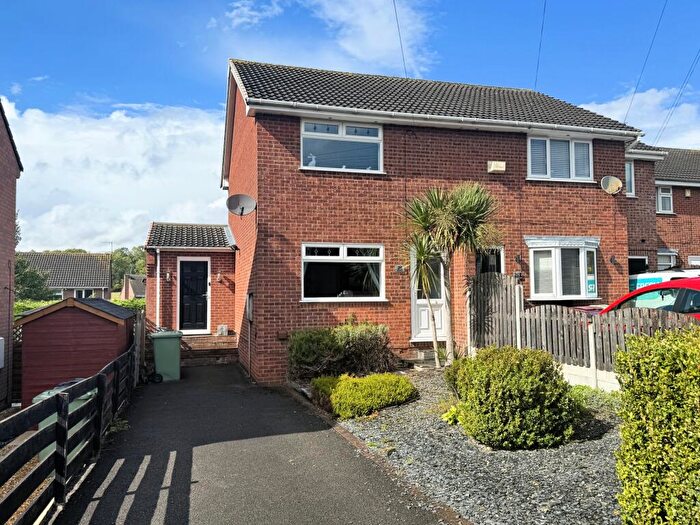
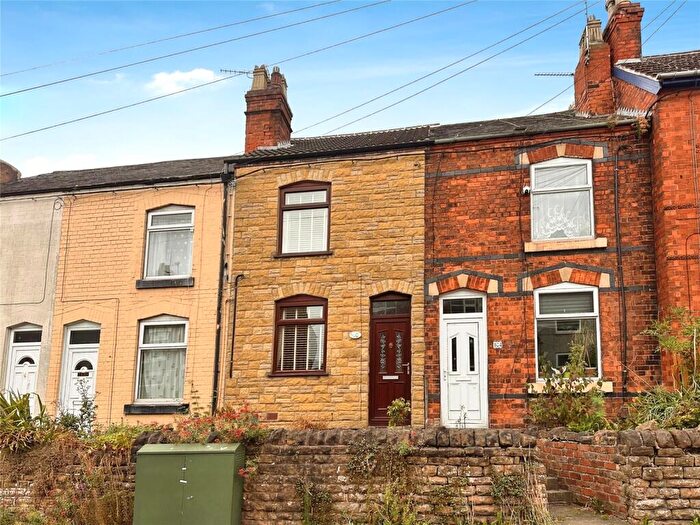
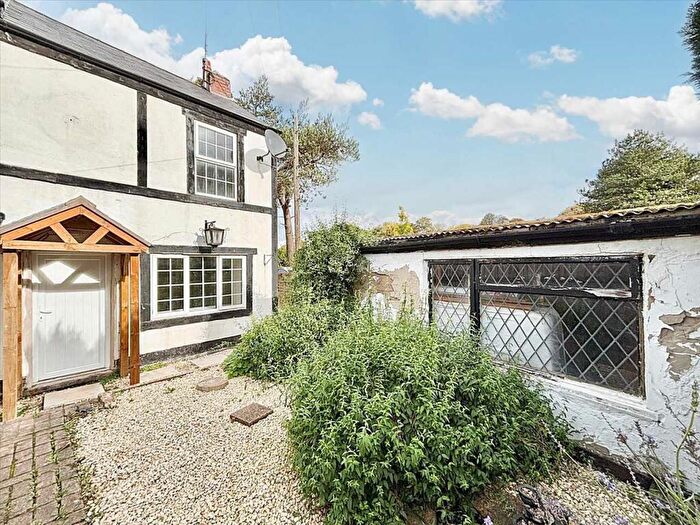
Properties for sale in Pinxton
Roads and Postcodes in Pinxton
Navigate through our locations to find the location of your next house in Pinxton, Nottingham for sale or to rent.
| Streets | Postcodes |
|---|---|
| Acer Close | NG16 6RB |
| Alexander Terrace | NG16 6PL |
| Alfred Street | NG16 6NQ |
| Alfreton Road | NG16 6JY NG16 6JZ |
| Arthur Street | NG16 6NJ |
| Ash Close | NG16 6LU |
| Beaufit Lane | NG16 6HF |
| Beech Avenue | NG16 6HB |
| Billingsley Avenue | NG16 6QN |
| Brookhill Avenue | NG16 6JT |
| Brookhill Industrial Estate | NG16 6NS NG16 6NT |
| Brookhill Lane | NG16 6JU NG16 6JX |
| Brookhill Road | NG16 6NW NG16 6RY |
| Chestnut Court | NG16 6HJ |
| Church Street East | NG16 6HT NG16 6HU NG16 6NF NG16 6NG |
| Church Street West | NG16 6NB NG16 6ND NG16 6PU NG16 6PX |
| Colliery Road | NG16 6JF |
| Croft Close | NG16 6RF |
| Dunsil Road | NG16 6RZ |
| Elm Close | NG16 6LW |
| George Street | NG16 6NP |
| Glebe Avenue | NG16 6HQ NG16 6HR |
| Guildhall Drive | NG16 6GJ |
| Hawthorne Road | NG16 6LT NG16 6LY |
| Hayes Close | NG16 6RE |
| Hilltop Road | NG16 6QJ |
| Jubilee Court | NG16 6NU |
| King Street | NG16 6NL |
| Kirks Place | NG16 6HP |
| Kirkstead Close | NG16 6PG |
| Kirkstead Road | NG16 6NA |
| Lambcroft Road | NG16 6QL |
| Lime Close | NG16 6LZ |
| Mill Lane | NG16 6PP |
| North Street | NG16 6LP |
| Oak Close | NG16 6NR |
| Orchard Mews | NG16 6HG |
| Paddocks Close | NG16 6JR |
| Park Close | NG16 6QQ |
| Park Lane | NG16 6PR NG16 6PS NG16 6PT |
| Pinxton Court | NG16 6RX |
| Platt Street | NG16 6NX |
| Plymouth Avenue | NG16 6RA |
| Pool Close | NG16 6LL |
| Queen Street | NG16 6PW |
| Redgate Street | NG16 6LN |
| Sacheverall Avenue | NG16 6QP |
| Sedgwick Close | NG16 6LJ |
| Sleights Lane | NG16 6PE |
| Southfields Avenue | NG16 6JL |
| St Helens Avenue | NG16 6QD |
| Sunshine Close | NG16 6JW |
| Sycamore Close | NG16 6LX |
| Talbot Street | NG16 6PD |
| Town Crescent | NG16 6SA |
| Town Street | NG16 6HH NG16 6HL NG16 6HN NG16 6HS NG16 6JN NG16 6JP NG16 6SB |
| Victoria Road | NG16 6LR NG16 6NE NG16 6NH |
| West End | NG16 6NN |
| Westland Drive | NG16 6RD |
| Wharf Road | NG16 6HA NG16 6LG NG16 6LH NG16 6LQ NG16 6NY NG16 6NZ NG16 6PA NG16 6PB |
| Wharf Road Industrial Estate | NG16 6LE |
| Widmerpool Street | NG16 6PF |
| Wilson Street | NG16 6LS |
| Woodfield Road | NG16 6JQ NG16 6JS |
| York Terrace | NG16 6PJ |
Transport near Pinxton
- FAQ
- Price Paid By Year
- Property Type Price
Frequently asked questions about Pinxton
What is the average price for a property for sale in Pinxton?
The average price for a property for sale in Pinxton is £169,466. This amount is 22% lower than the average price in Nottingham. There are 433 property listings for sale in Pinxton.
What streets have the most expensive properties for sale in Pinxton?
The streets with the most expensive properties for sale in Pinxton are West End at an average of £314,375, Platt Street at an average of £240,000 and Croft Close at an average of £235,500.
What streets have the most affordable properties for sale in Pinxton?
The streets with the most affordable properties for sale in Pinxton are Ash Close at an average of £73,000, Queen Street at an average of £77,500 and Pool Close at an average of £105,600.
Which train stations are available in or near Pinxton?
Some of the train stations available in or near Pinxton are Alfreton, Kirkby in Ashfield and Sutton Parkway.
Property Price Paid in Pinxton by Year
The average sold property price by year was:
| Year | Average Sold Price | Price Change |
Sold Properties
|
|---|---|---|---|
| 2025 | £165,128 | -5% |
58 Properties |
| 2024 | £173,141 | 1% |
49 Properties |
| 2023 | £170,989 | 10% |
47 Properties |
| 2022 | £154,355 | 8% |
73 Properties |
| 2021 | £142,270 | 10% |
83 Properties |
| 2020 | £128,376 | 0,4% |
72 Properties |
| 2019 | £127,853 | 2% |
80 Properties |
| 2018 | £125,293 | 3% |
74 Properties |
| 2017 | £121,683 | 11% |
69 Properties |
| 2016 | £108,341 | 4% |
92 Properties |
| 2015 | £103,597 | 6% |
59 Properties |
| 2014 | £97,024 | 16% |
58 Properties |
| 2013 | £81,296 | -3% |
56 Properties |
| 2012 | £83,720 | -4% |
43 Properties |
| 2011 | £87,472 | -12% |
45 Properties |
| 2010 | £98,288 | 14% |
31 Properties |
| 2009 | £84,471 | -29% |
35 Properties |
| 2008 | £109,343 | 6% |
54 Properties |
| 2007 | £102,421 | 1% |
102 Properties |
| 2006 | £101,695 | -20% |
114 Properties |
| 2005 | £122,072 | 32% |
111 Properties |
| 2004 | £83,559 | 31% |
108 Properties |
| 2003 | £57,891 | 28% |
102 Properties |
| 2002 | £41,722 | -1% |
123 Properties |
| 2001 | £42,282 | 6% |
83 Properties |
| 2000 | £39,568 | 7% |
65 Properties |
| 1999 | £36,661 | 3% |
75 Properties |
| 1998 | £35,540 | -8% |
54 Properties |
| 1997 | £38,219 | 13% |
60 Properties |
| 1996 | £33,306 | 7% |
37 Properties |
| 1995 | £31,031 | - |
53 Properties |
Property Price per Property Type in Pinxton
Here you can find historic sold price data in order to help with your property search.
The average Property Paid Price for specific property types in the last three years are:
| Property Type | Average Sold Price | Sold Properties |
|---|---|---|
| Semi Detached House | £156,540.00 | 62 Semi Detached Houses |
| Detached House | £253,122.00 | 40 Detached Houses |
| Terraced House | £123,561.00 | 49 Terraced Houses |
| Flat | £71,000.00 | 3 Flats |

