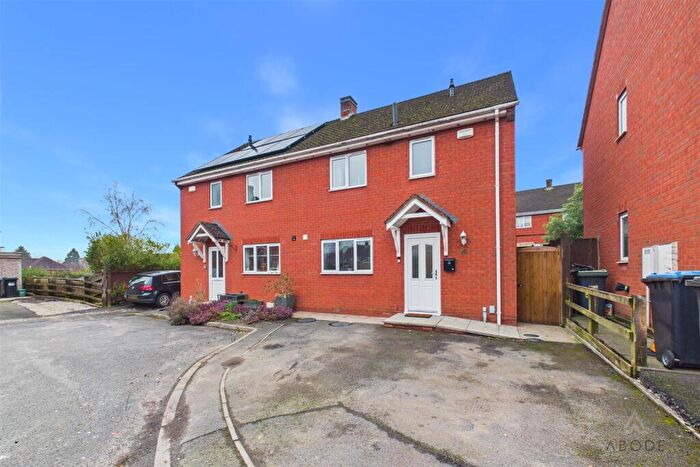
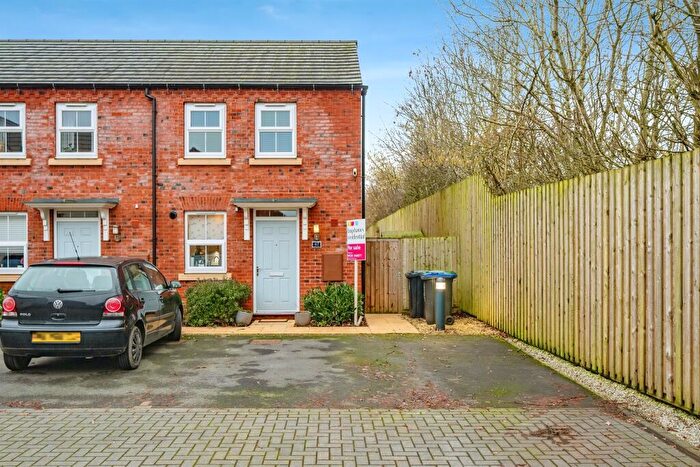
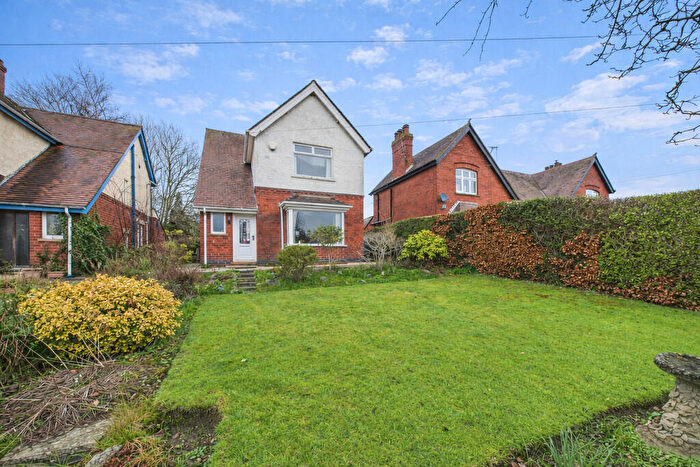
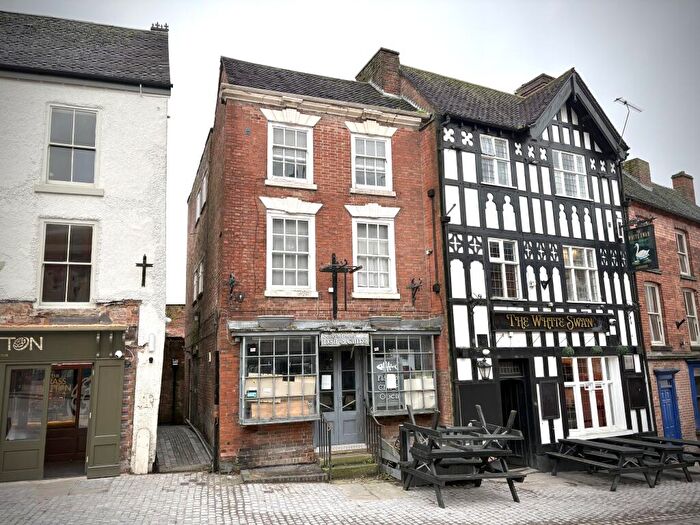
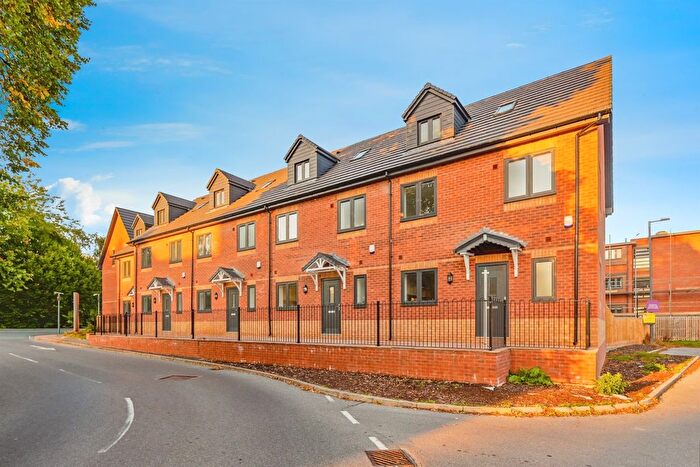
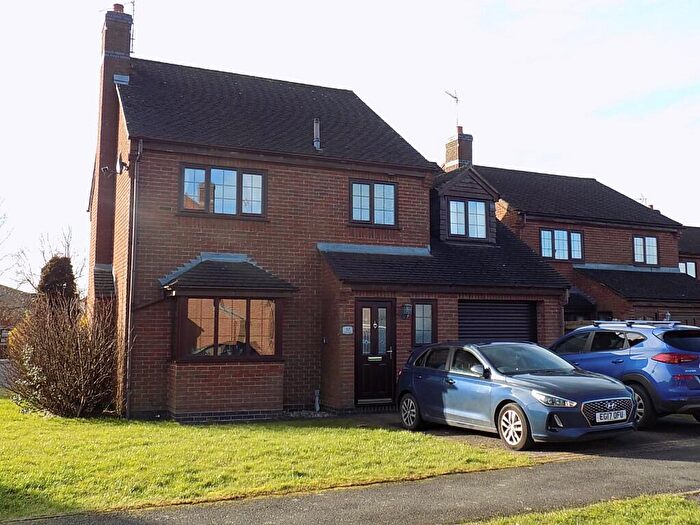
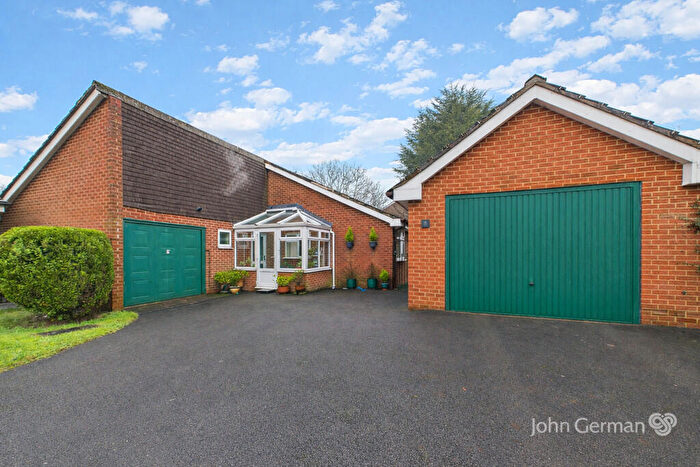
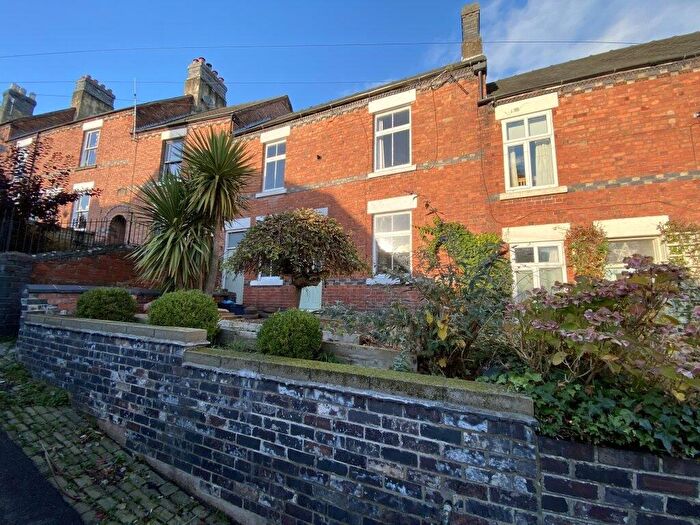
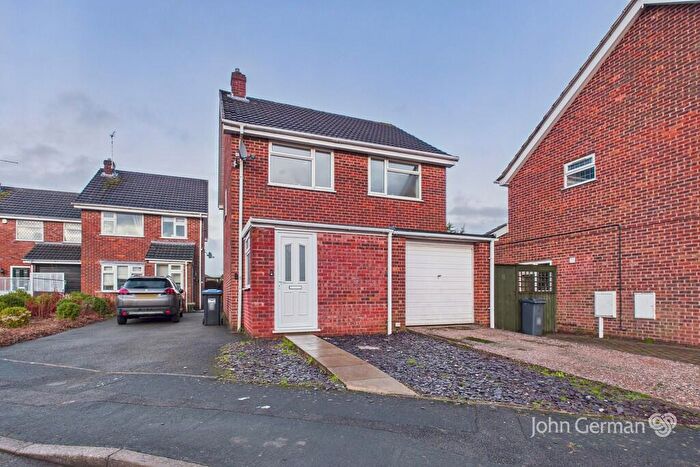
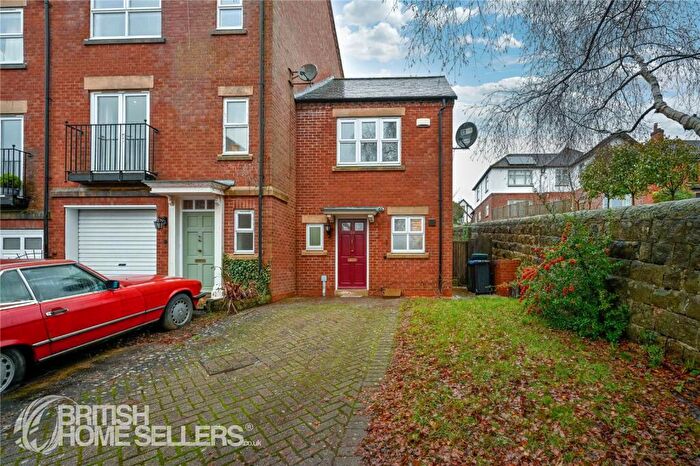
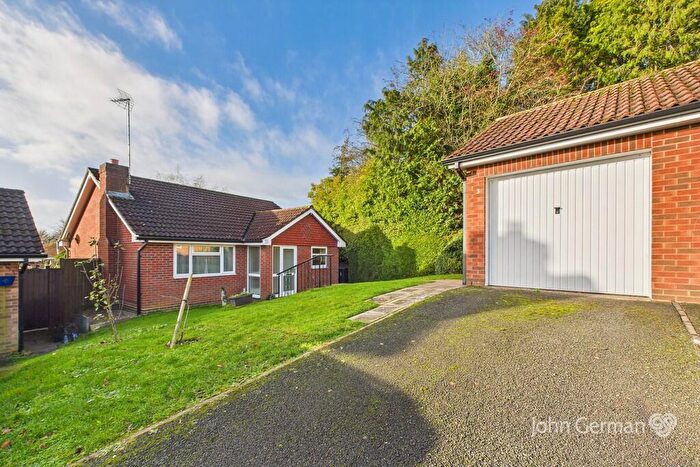
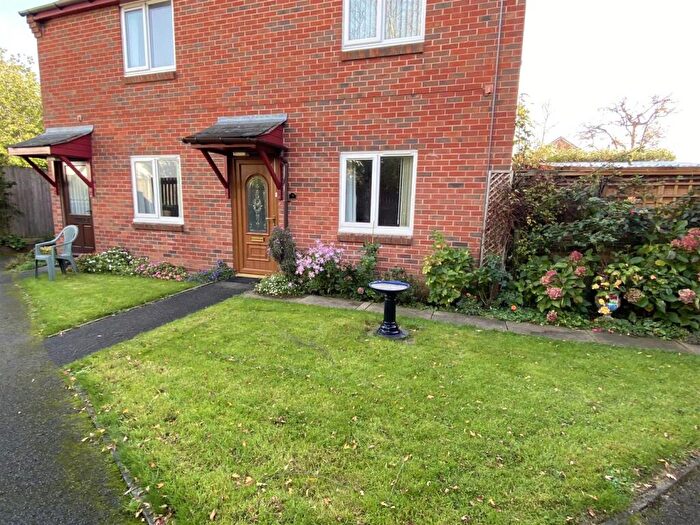
Houses for sale & to rent in Ashbourne North, Ashbourne
House Prices in Ashbourne North
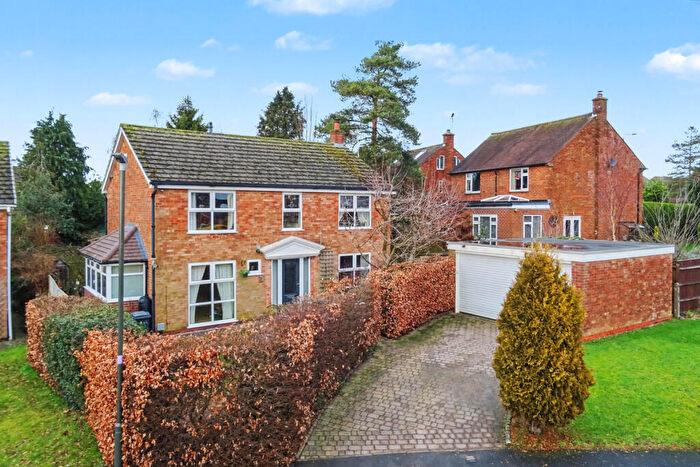
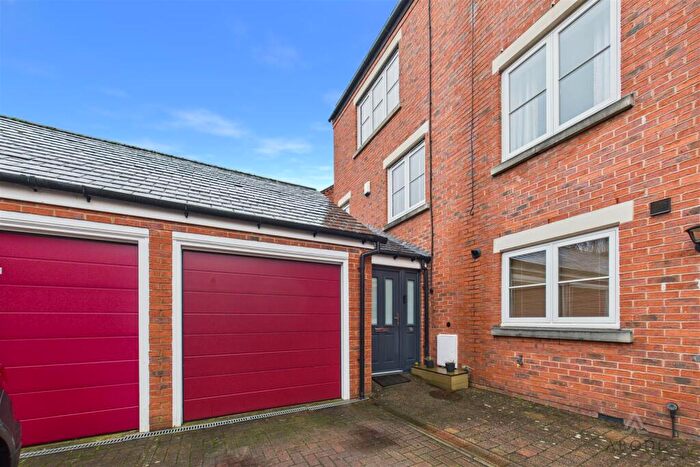
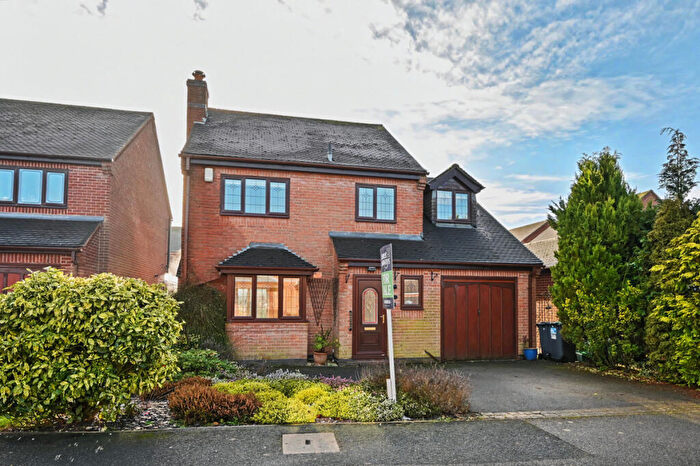
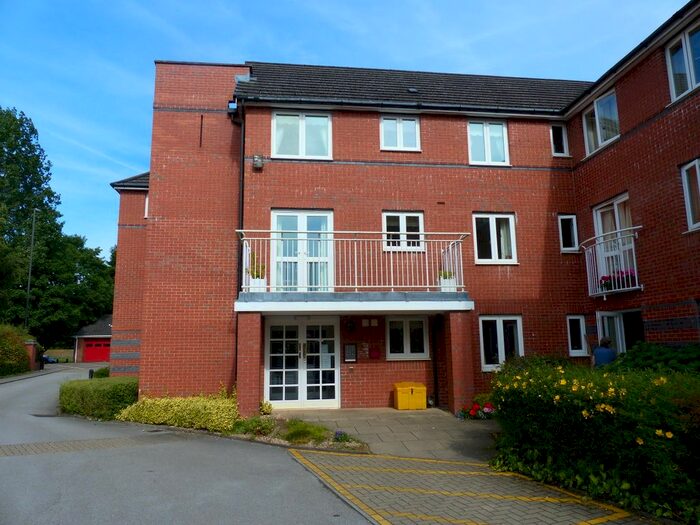
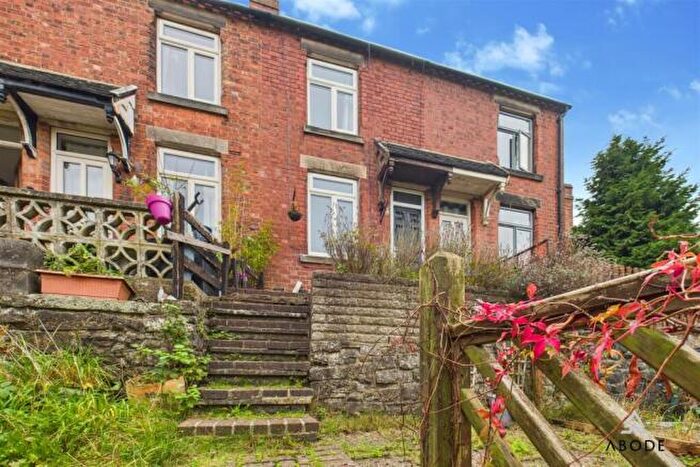
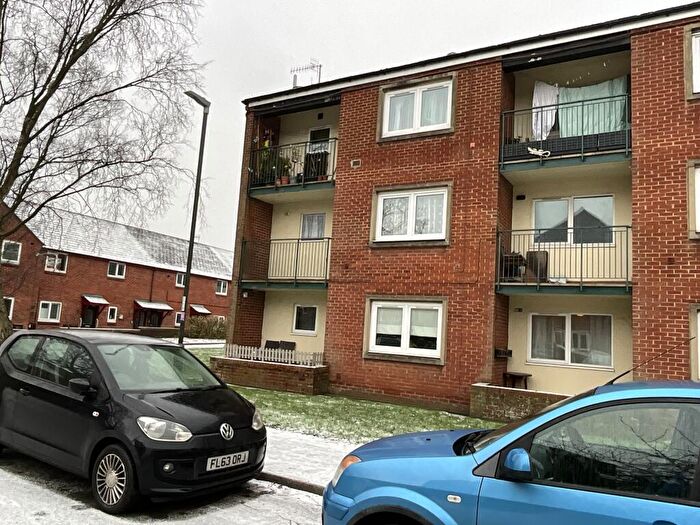
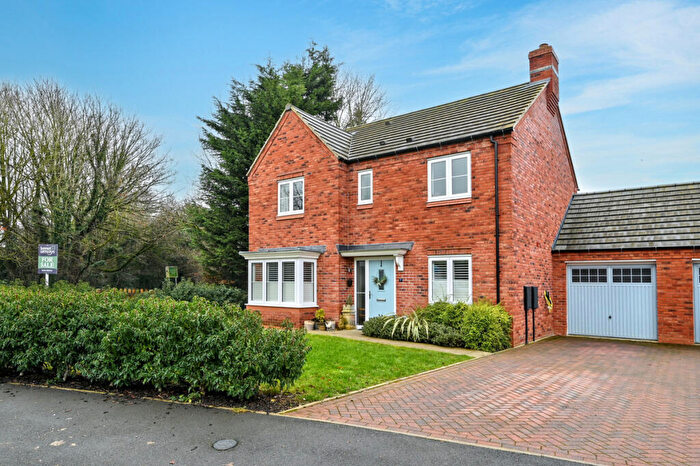
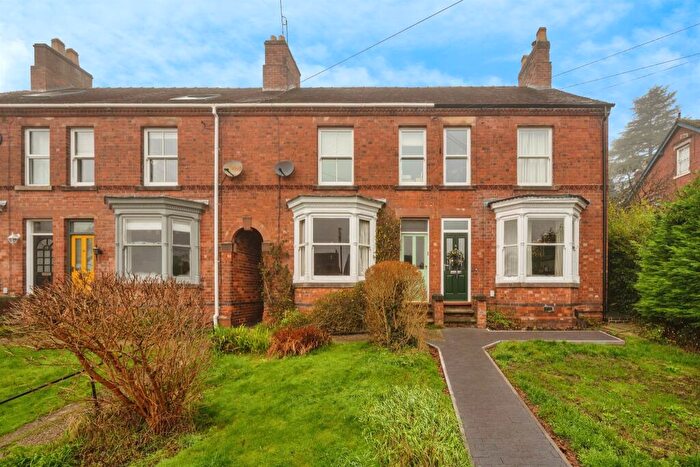
Properties in Ashbourne North have an average house price of £312,268.00 and had 105 Property Transactions within the last 3 years¹.
Ashbourne North is an area in Ashbourne, Derbyshire with 1,648 households², where the most expensive property was sold for £905,000.00.
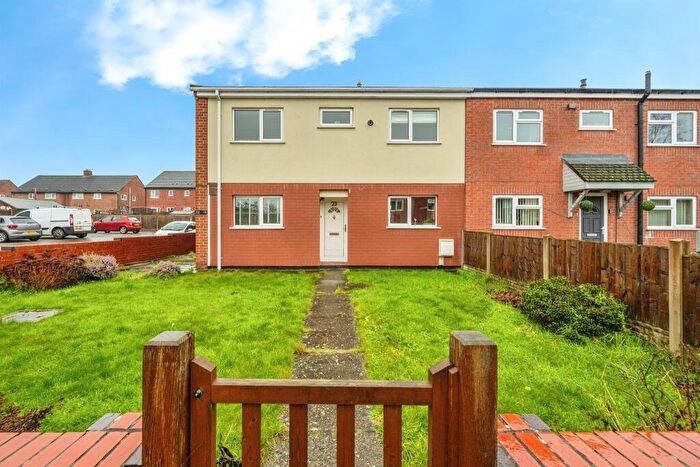
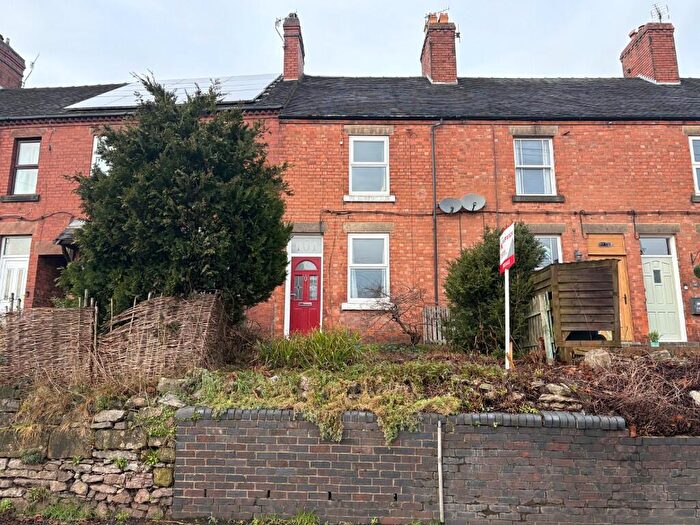
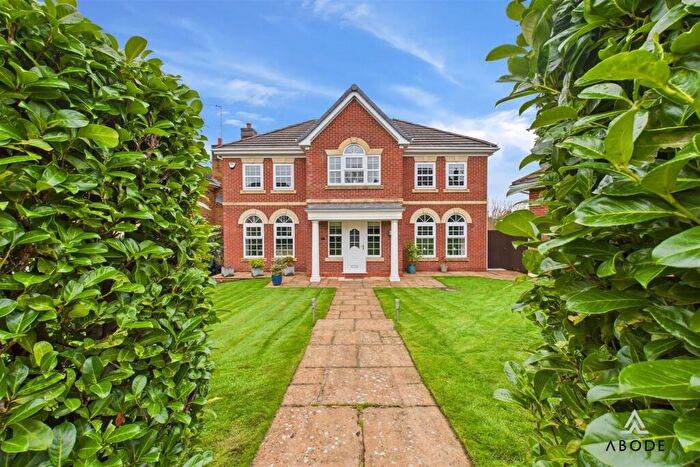
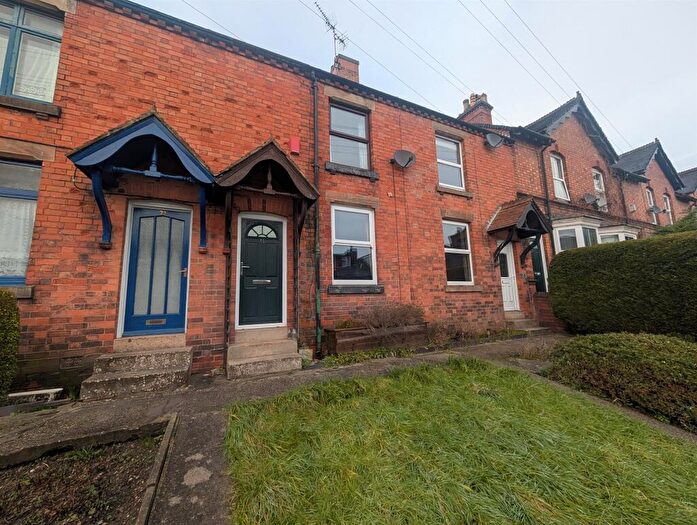
Properties for sale in Ashbourne North
Roads and Postcodes in Ashbourne North
Navigate through our locations to find the location of your next house in Ashbourne North, Ashbourne for sale or to rent.
| Streets | Postcodes |
|---|---|
| Arnolds Yard | DE6 1AH |
| Ashbourne Green | DE6 1JD DE6 1JE |
| Atlow Brow | DE6 1RP |
| Auction Close | DE6 1GQ |
| Belle Vue Road | DE6 1AT DE6 1NE |
| Belper Road | DE6 1BB DE6 1BD DE6 1GW |
| Beresford Avenue | DE6 1FW |
| Birchwood View | DE6 1RZ |
| Boothby Avenue | DE6 1EL |
| Bradley View | DE6 1RN |
| Brookside | DE6 1FY |
| Brookside Meadows | DE6 1RQ DE6 1RS |
| Buxton Road | DE6 1EX |
| Catherine Court | DE6 1ET |
| Church Street | DE6 1AJ DE6 1AP |
| Cokayne Avenue | DE6 1EJ |
| Cokayne Mews | DE6 1ER |
| Coopers Close | DE6 1EQ |
| Copley Croft | DE6 1RL |
| Cullen Avenue | DE6 1FQ |
| Dovedale Avenue | DE6 1FT |
| Dovehouse Green | DE6 1FF |
| Drovers Way | DE6 1NZ |
| Greenway | DE6 1EF |
| Hall Lane | DE6 1EB |
| Hall Rise | DE6 1RH |
| Hillside Avenue | DE6 1EG |
| Kennedy Close | DE6 1GR |
| King Street | DE6 1EA |
| Lakeside | DE6 1GE |
| Lovatts Yard | DE6 1FH |
| Malthouse Court | DE6 1DN |
| Manifold Avenue | DE6 1FR |
| Manor Road | DE6 1EH |
| Mapleton Road | DE6 1FD DE6 2AA |
| Market Place | DE6 1ES DE6 1EU |
| Meynell Rise | DE6 1RU |
| North Avenue | DE6 1EZ DE6 1HB |
| Northcliffe Road | DE6 1FE |
| Offcote | DE6 1JQ |
| Offcote Crescent | DE6 1RW |
| Okeover Avenue | DE6 1FX |
| Park Avenue | DE6 1GA DE6 1GB |
| Rousseau Court | DE6 1GL |
| Sandybrook | DE6 2AQ |
| Sandybrook Close | DE6 1RX |
| Smiths Yard | DE6 1AB |
| Spalden Avenue | DE6 1EN |
| Spire Close | DE6 1DB |
| St James Court | DE6 1GJ |
| St John Street | DE6 1GH |
| St Johns Street | DE6 1GP |
| St Monicas Way | DE6 1RF |
| St Oswalds Crescent | DE6 1FS |
| The Channel | DE6 1FB |
| The Green | DE6 1JB |
| The Green Road | DE6 1ED DE6 1EE DE6 1EP |
| Town Hall Yard | DE6 1EW |
| Town Head | DE6 1HG |
| Union Street | DE6 1FG DE6 1SA |
| Victoria Square | DE6 1GG |
| Walton Crescent | DE6 1FZ |
| Windmill Lane | DE6 1EY DE6 1JA |
| Windsor Close | DE6 1RJ |
| Woodlands Brow | DE6 1RY |
| DE6 1LN DE6 1UB DE6 3HF |
Transport near Ashbourne North
-
Cromford Station
-
Uttoxeter Station
-
Matlock Bath Station
-
Belper Station
-
Duffield Station
-
Whatstandwell Station
-
Ambergate Station
-
Matlock Station
-
Tutbury and Hatton Station
-
Derby Station
- FAQ
- Price Paid By Year
- Property Type Price
Frequently asked questions about Ashbourne North
What is the average price for a property for sale in Ashbourne North?
The average price for a property for sale in Ashbourne North is £312,268. This amount is 20% lower than the average price in Ashbourne. There are 621 property listings for sale in Ashbourne North.
What streets have the most expensive properties for sale in Ashbourne North?
The streets with the most expensive properties for sale in Ashbourne North are Windmill Lane at an average of £735,833, Mapleton Road at an average of £670,000 and Spire Close at an average of £628,750.
What streets have the most affordable properties for sale in Ashbourne North?
The streets with the most affordable properties for sale in Ashbourne North are Brookside Meadows at an average of £106,000, Market Place at an average of £141,250 and The Green at an average of £156,000.
Which train stations are available in or near Ashbourne North?
Some of the train stations available in or near Ashbourne North are Cromford, Uttoxeter and Matlock Bath.
Property Price Paid in Ashbourne North by Year
The average sold property price by year was:
| Year | Average Sold Price | Price Change |
Sold Properties
|
|---|---|---|---|
| 2025 | £303,391 | -13% |
23 Properties |
| 2024 | £343,300 | 16% |
40 Properties |
| 2023 | £287,576 | -4% |
42 Properties |
| 2022 | £299,389 | -4% |
57 Properties |
| 2021 | £310,799 | 15% |
76 Properties |
| 2020 | £263,511 | 5% |
53 Properties |
| 2019 | £251,194 | -19% |
46 Properties |
| 2018 | £300,147 | 27% |
51 Properties |
| 2017 | £218,787 | -20% |
52 Properties |
| 2016 | £262,892 | -3% |
53 Properties |
| 2015 | £272,065 | 20% |
59 Properties |
| 2014 | £217,349 | -1% |
48 Properties |
| 2013 | £219,105 | 8% |
46 Properties |
| 2012 | £202,633 | -6% |
46 Properties |
| 2011 | £215,508 | -6% |
41 Properties |
| 2010 | £229,430 | -1% |
57 Properties |
| 2009 | £231,081 | 6% |
34 Properties |
| 2008 | £218,255 | -6% |
36 Properties |
| 2007 | £231,926 | 7% |
69 Properties |
| 2006 | £216,355 | 2% |
62 Properties |
| 2005 | £212,834 | 25% |
76 Properties |
| 2004 | £159,160 | 10% |
79 Properties |
| 2003 | £143,428 | 17% |
71 Properties |
| 2002 | £119,068 | -0,2% |
62 Properties |
| 2001 | £119,327 | 28% |
99 Properties |
| 2000 | £85,485 | -23% |
57 Properties |
| 1999 | £105,303 | 14% |
50 Properties |
| 1998 | £91,019 | -6% |
48 Properties |
| 1997 | £96,069 | 21% |
76 Properties |
| 1996 | £75,739 | -5% |
50 Properties |
| 1995 | £79,809 | - |
47 Properties |
Property Price per Property Type in Ashbourne North
Here you can find historic sold price data in order to help with your property search.
The average Property Paid Price for specific property types in the last three years are:
| Property Type | Average Sold Price | Sold Properties |
|---|---|---|
| Semi Detached House | £250,450.00 | 40 Semi Detached Houses |
| Detached House | £455,135.00 | 37 Detached Houses |
| Terraced House | £203,660.00 | 23 Terraced Houses |
| Flat | £249,200.00 | 5 Flats |

