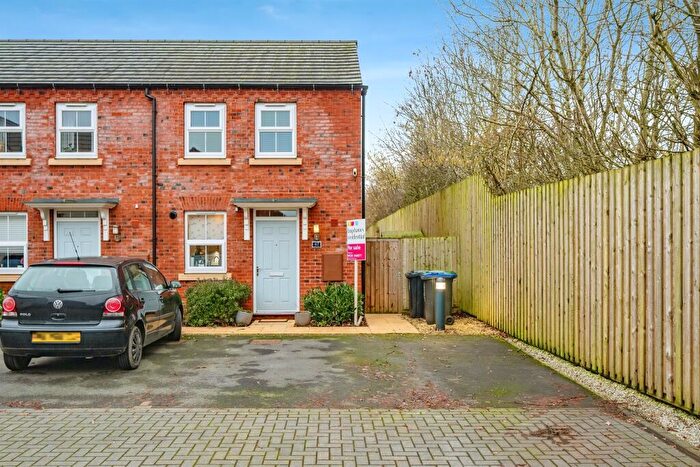
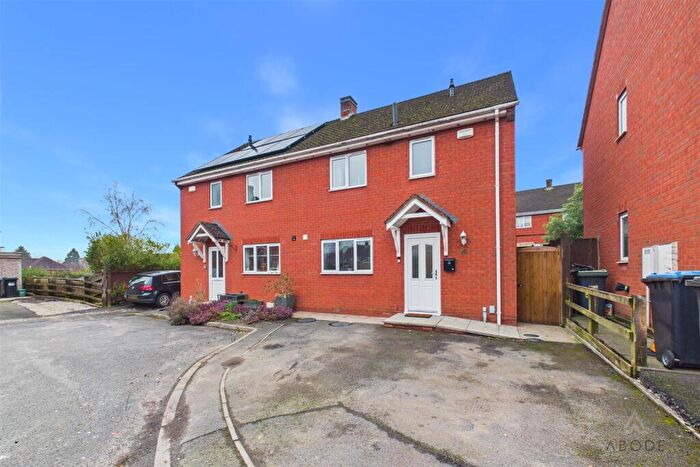
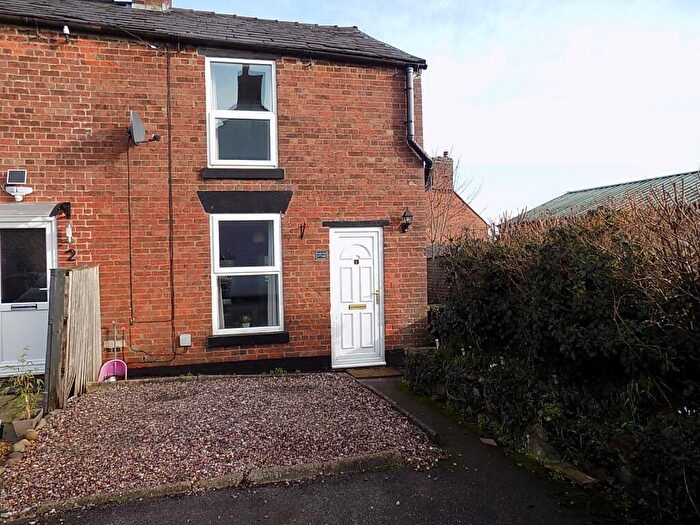
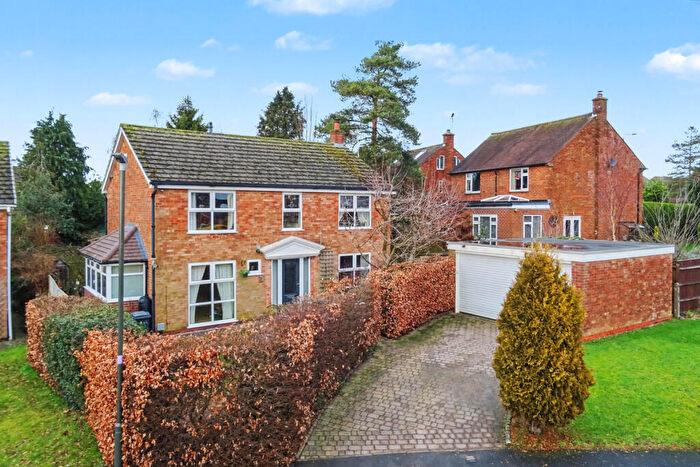
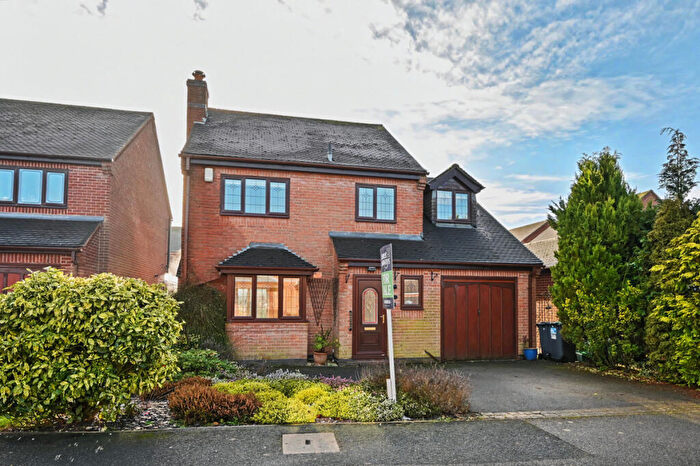
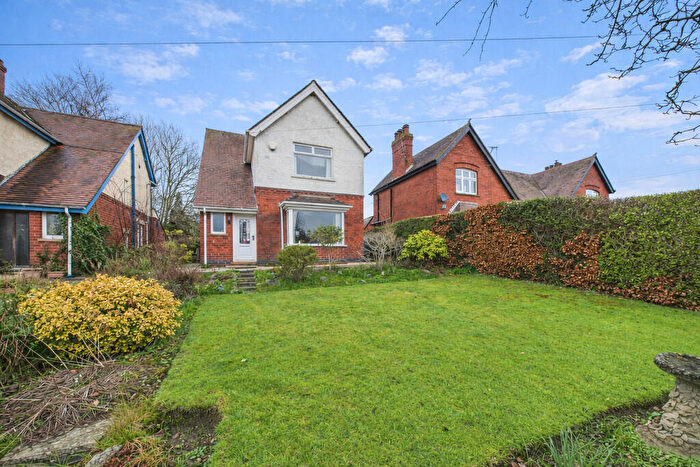
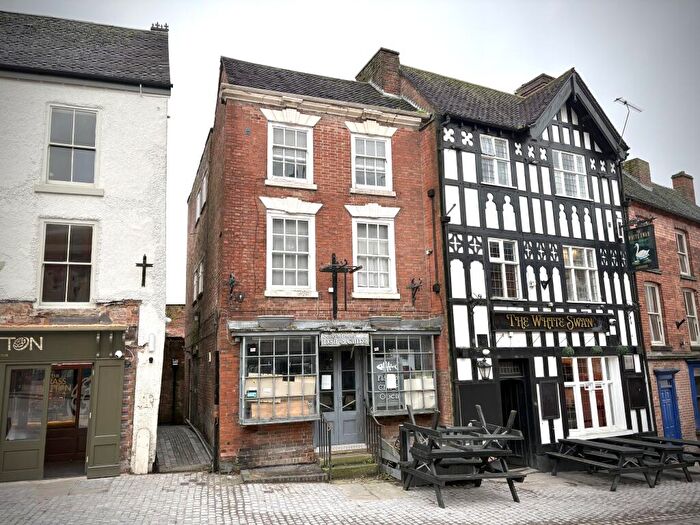
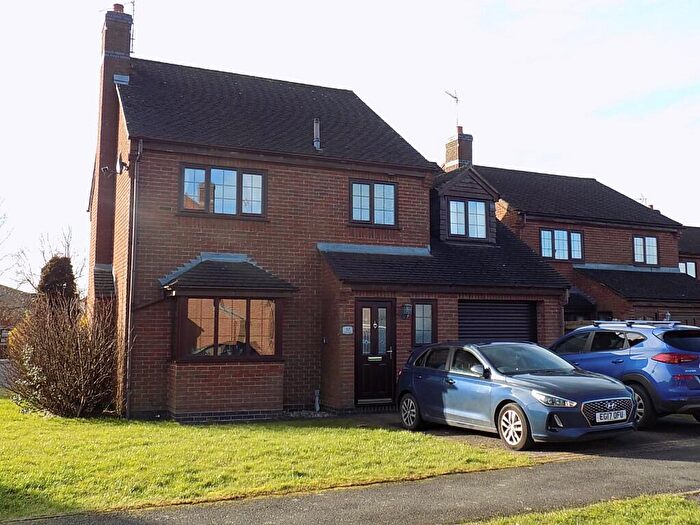
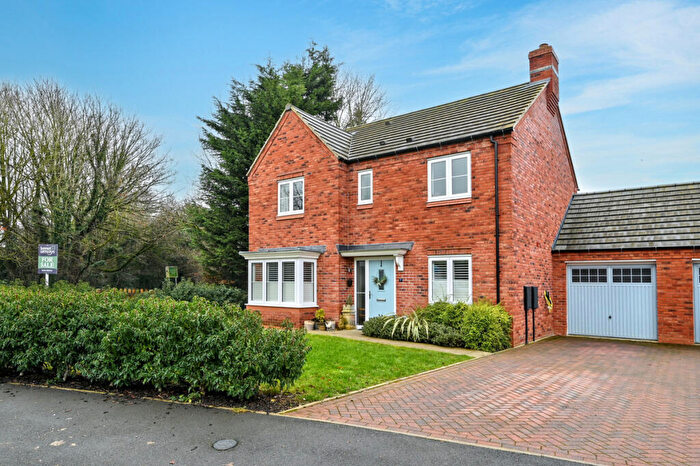
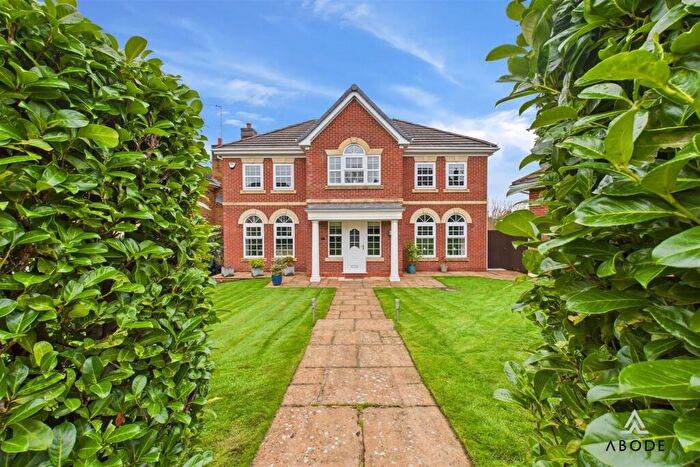
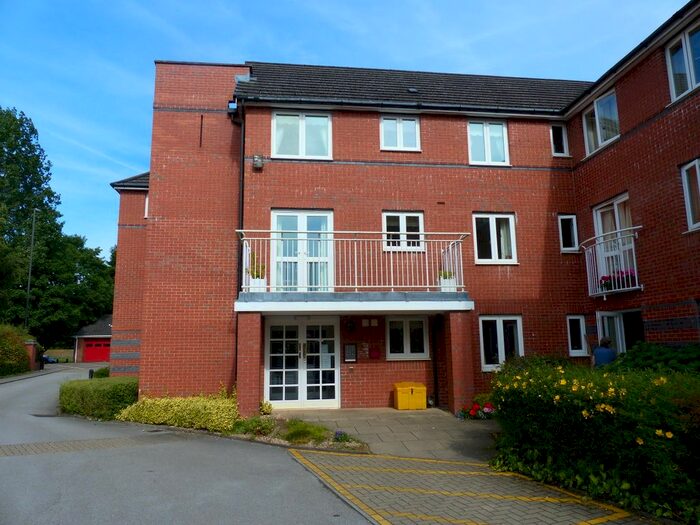
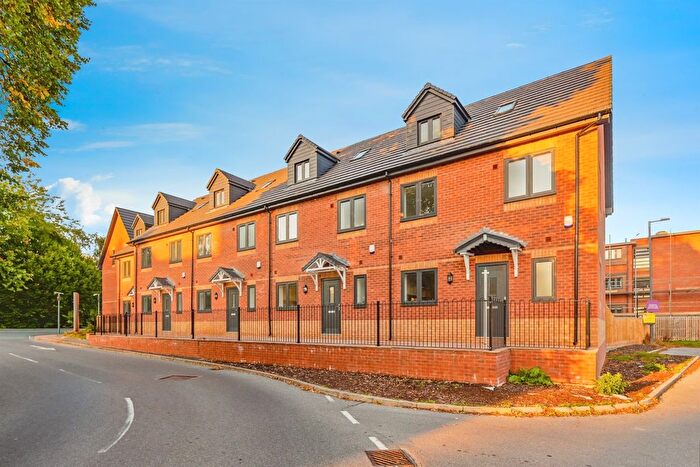
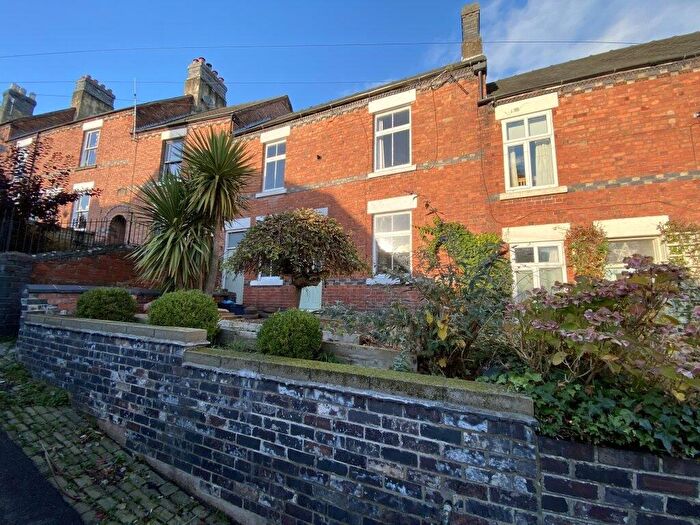
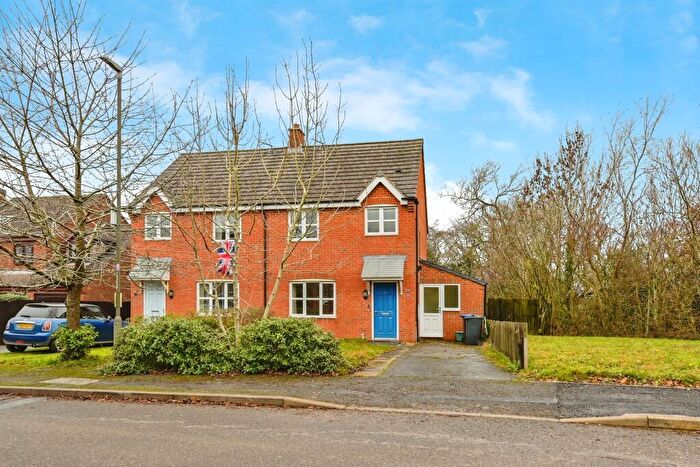
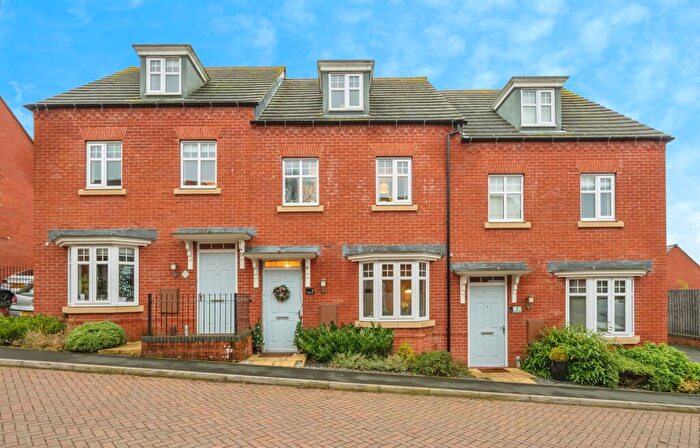
Houses for sale & to rent in Clifton And Bradley, Ashbourne
House Prices in Clifton And Bradley
Properties in Clifton And Bradley have an average house price of £551,386.00 and had 43 Property Transactions within the last 3 years¹.
Clifton And Bradley is an area in Ashbourne, Derbyshire with 772 households², where the most expensive property was sold for £3,775,000.00.
Properties for sale in Clifton And Bradley
Roads and Postcodes in Clifton And Bradley
Navigate through our locations to find the location of your next house in Clifton And Bradley, Ashbourne for sale or to rent.
| Streets | Postcodes |
|---|---|
| Anacre Cottages | DE6 2DN |
| Belper Road | DE6 1LL |
| Bradley Corner | DE6 3EL |
| Brunswood Lane | DE6 3EN DE6 1SB |
| Cackle Hill Cottages | DE6 2DL |
| Carnation Way | DE6 1AY |
| Clifton Road | DE6 2DH |
| Cocks Head Lane | DE6 2DP |
| Collycroft Hill | DE6 2GN |
| Council Houses | DE6 1PG |
| Cross Side | DE6 2GJ |
| Derby Lane | DE6 3AT |
| Derby Road | DE6 1LS |
| Dobbin Horse Lane | DE6 1ND |
| Dog Kennel Lane | DE6 1PH |
| Green Lane | DE6 2BL DE6 2DZ |
| Hollies Close | DE6 2GR |
| Lady Hole Lane | DE6 1LR DE6 1NY |
| Long View Lane | DE6 2GH |
| Mayfield Road | DE6 2BJ DE6 2BN |
| Meadowside Close | DE6 3AW |
| Old Park | DE6 1PL |
| Park Lane | DE6 3DY |
| Pinfold Lane | DE6 1PN |
| Rough Lane | DE6 3AZ |
| Sides Lane | DE6 2GQ |
| The Crescent | DE6 3AS |
| The Fairways | DE6 2GG |
| The Greenacre | DE6 2DW |
| Windmill Lane | DE6 2GT |
| Wyaston Road | DE6 1NB |
| Yeldersley Lane | DE6 1PJ |
| DE6 1JS DE6 1LP DE6 1LQ DE6 1LW DE6 1LX DE6 2DQ DE6 2DR DE6 2EN DE6 2EP DE6 2GL DE6 2GP DE6 3AR DE6 1LT DE6 1LU DE6 1NA DE6 1NW DE6 2DJ DE6 2EA DE6 2JQ |
Transport near Clifton And Bradley
- FAQ
- Price Paid By Year
- Property Type Price
Frequently asked questions about Clifton And Bradley
What is the average price for a property for sale in Clifton And Bradley?
The average price for a property for sale in Clifton And Bradley is £551,386. This amount is 41% higher than the average price in Ashbourne. There are 1,123 property listings for sale in Clifton And Bradley.
What streets have the most expensive properties for sale in Clifton And Bradley?
The streets with the most expensive properties for sale in Clifton And Bradley are Rough Lane at an average of £2,207,500, Brunswood Lane at an average of £825,000 and Wyaston Road at an average of £606,000.
What streets have the most affordable properties for sale in Clifton And Bradley?
The streets with the most affordable properties for sale in Clifton And Bradley are Mayfield Road at an average of £290,000, The Greenacre at an average of £325,000 and Council Houses at an average of £368,000.
Which train stations are available in or near Clifton And Bradley?
Some of the train stations available in or near Clifton And Bradley are Uttoxeter, Tutbury and Hatton and Duffield.
Property Price Paid in Clifton And Bradley by Year
The average sold property price by year was:
| Year | Average Sold Price | Price Change |
Sold Properties
|
|---|---|---|---|
| 2025 | £1,046,333 | 54% |
6 Properties |
| 2024 | £482,843 | 4% |
16 Properties |
| 2023 | £462,196 | -35% |
21 Properties |
| 2022 | £624,065 | 13% |
23 Properties |
| 2021 | £543,071 | 7% |
28 Properties |
| 2020 | £505,758 | 20% |
18 Properties |
| 2019 | £405,648 | -8% |
33 Properties |
| 2018 | £437,088 | 7% |
22 Properties |
| 2017 | £406,026 | -5% |
19 Properties |
| 2016 | £424,372 | 10% |
24 Properties |
| 2015 | £382,181 | 8% |
19 Properties |
| 2014 | £352,171 | -10% |
26 Properties |
| 2013 | £388,918 | 6% |
19 Properties |
| 2012 | £367,452 | 4% |
14 Properties |
| 2011 | £353,079 | -14% |
12 Properties |
| 2010 | £401,809 | 27% |
21 Properties |
| 2009 | £292,833 | -3% |
15 Properties |
| 2008 | £301,167 | -29% |
17 Properties |
| 2007 | £387,112 | 15% |
26 Properties |
| 2006 | £329,688 | 22% |
21 Properties |
| 2005 | £256,371 | -12% |
16 Properties |
| 2004 | £286,882 | 5% |
32 Properties |
| 2003 | £273,427 | 29% |
34 Properties |
| 2002 | £194,848 | 29% |
37 Properties |
| 2001 | £137,469 | -3% |
21 Properties |
| 2000 | £141,236 | 12% |
28 Properties |
| 1999 | £123,750 | 10% |
36 Properties |
| 1998 | £111,977 | 6% |
18 Properties |
| 1997 | £105,032 | -13% |
31 Properties |
| 1996 | £118,815 | -2% |
39 Properties |
| 1995 | £121,750 | - |
14 Properties |
Property Price per Property Type in Clifton And Bradley
Here you can find historic sold price data in order to help with your property search.
The average Property Paid Price for specific property types in the last three years are:
| Property Type | Average Sold Price | Sold Properties |
|---|---|---|
| Semi Detached House | £420,571.00 | 7 Semi Detached Houses |
| Detached House | £634,660.00 | 28 Detached Houses |
| Terraced House | £374,391.00 | 8 Terraced Houses |

