
Houses for sale in Hilton, Ashbourne
House Prices in Hilton
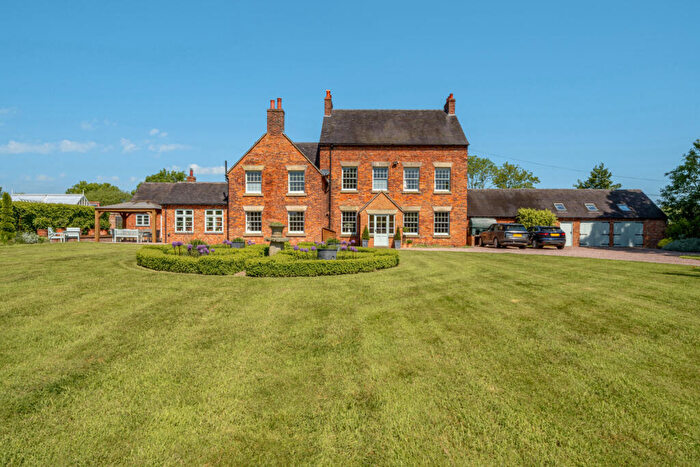
Properties in Hilton have an average house price of £481k and had 8 Property Transactions within the last 3 years¹.
Hilton is an area in Ashbourne, Derbyshire with 61 households², where the most expensive property was sold for £985k.
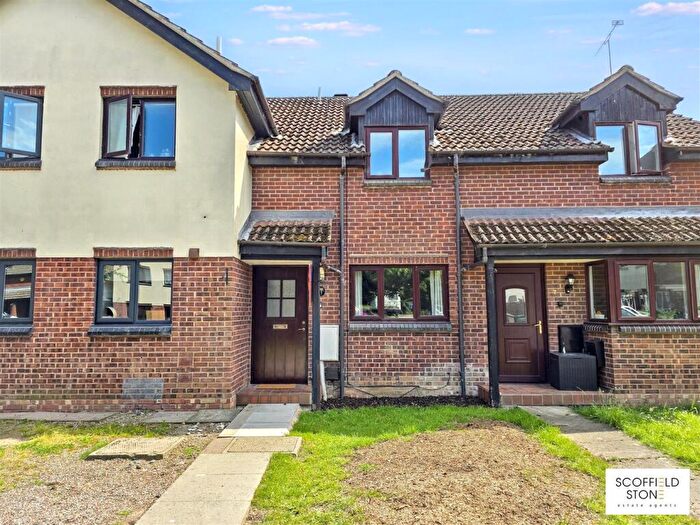
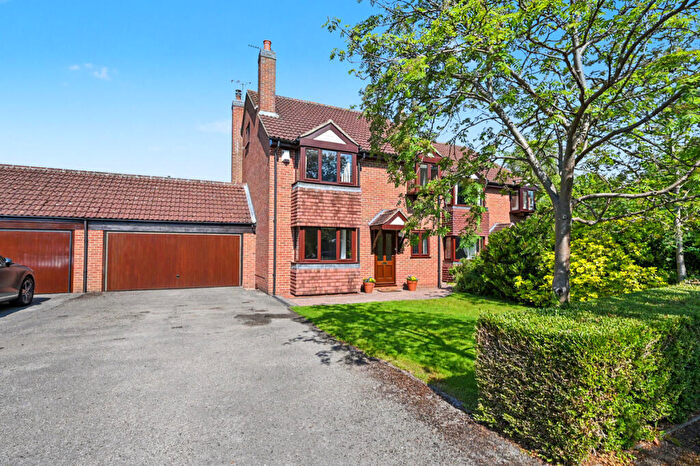
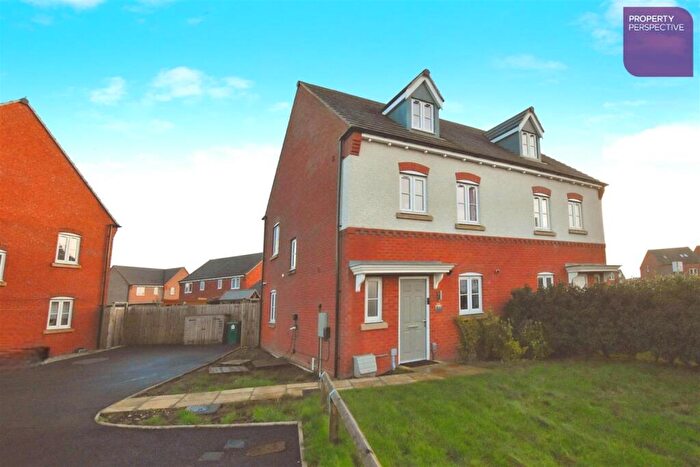
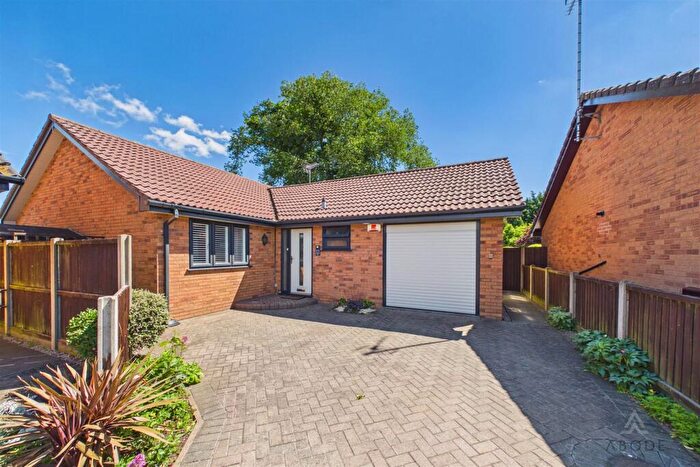
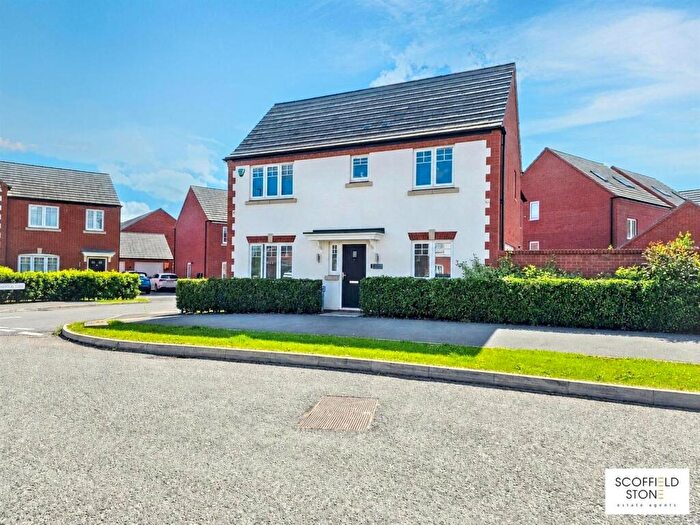
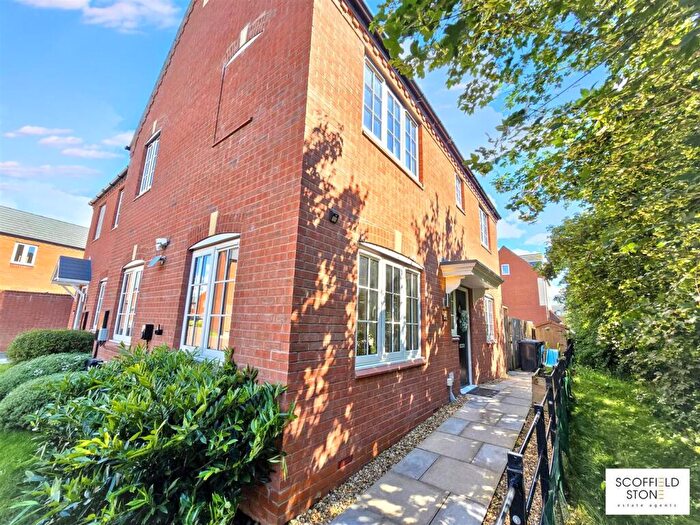
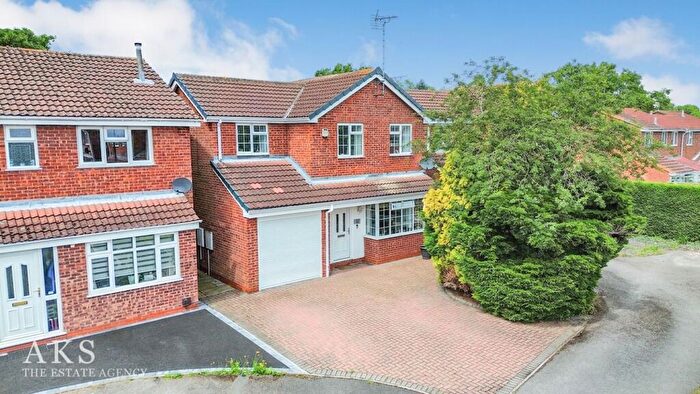
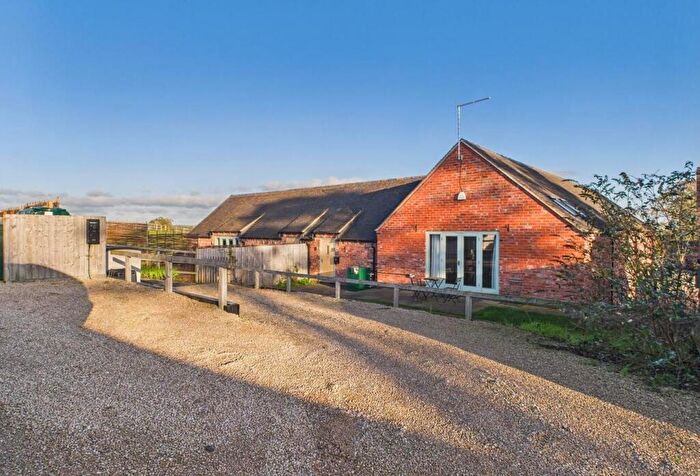
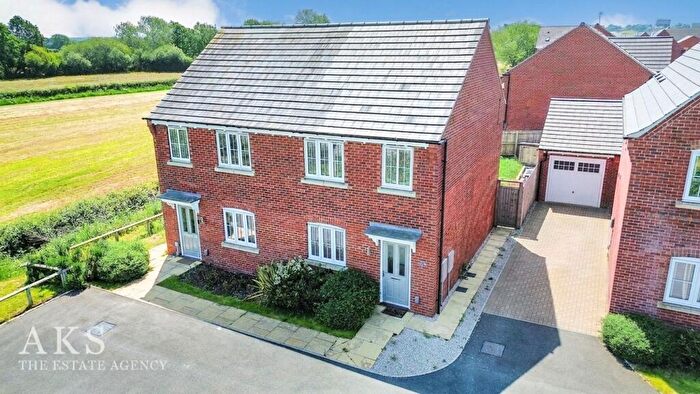
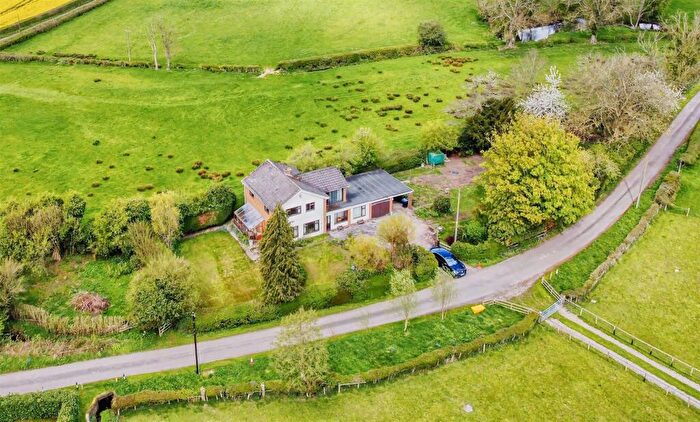
Properties for sale in Hilton
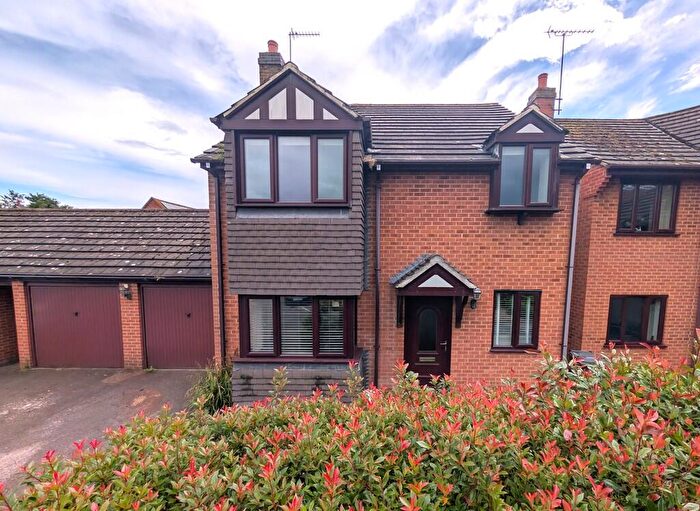
![]()
If you are looking to sell your house, let it out, or receive a property valuation, an expert can help you.
Click the button below to get started.
Roads and Postcodes in Hilton
Navigate through our locations to find the location of your next house in Hilton, Ashbourne for sale or to rent.
| Streets | Postcodes |
|---|---|
| Brook Lane | DE6 5JA |
| Common Lane | DE6 5JD |
| Dish Lane | DE6 5RA |
| Marlpit Lane | DE6 5QH |
| Muse Lane | DE6 5HJ |
| Sutton-on-the-hill | DE6 5JF |
Property price trends in Hilton
According to the latest Land Registry data, the average home in Hilton sold for £515,666 in 2025. That figure comes from 47 sales logged over the past 30 years.
Prices have continued to climb over the last three years. Compared with 2022, when the typical sale came in around £427,250, that's a rise of roughly 20.7%.
Looking back five years, average prices are down about 12.3% since 2019, a drop of around £72,584 in cash terms.
Zoom out to the past decade for the fuller picture. Back in 2015, homes here averaged £555,000, so the typical sold price has fallen about 7.1% since then, around 0.7% a year lower. Stretch the view to fifteen years and that annual pace edges up closer to 3.3%.
Frequently asked questions about Hilton
What is the average price for a property for sale in Hilton?
The average price for a property for sale in Hilton is £480,625. This amount is 24% higher than the average price in Ashbourne. There are 371 property listings for sale in Hilton.
Which train stations are available in or near Hilton?
Some of the train stations available in or near Hilton are Tutbury and Hatton, Willington and Burton-On-Trent.
Property Price Paid in Hilton by Year
The average sold property price by year was:
| Year | Average Sold Price | Price Change |
Sold Properties
|
|---|---|---|---|
| 2025 | £515,666 | 37% |
3 Properties |
| 2024 | £324,333 | -104% |
3 Properties |
| 2023 | £662,500 | 36% |
2 Properties |
| 2022 | £427,250 | -60% |
2 Properties |
| 2021 | £682,500 | 14% |
1 Property |
| 2019 | £588,250 | 32% |
4 Properties |
| 2017 | £399,823 | -30% |
4 Properties |
| 2016 | £520,000 | -7% |
4 Properties |
| 2015 | £555,000 | 48% |
1 Property |
| 2014 | £290,000 | -60% |
1 Property |
Property Price per Property Type in Hilton
Here you can find historic sold price data in order to help with your property search.
The average Property Paid Price for specific property types in the last three years are:
| Property Type | Average Sold Price | Sold Properties |
|---|---|---|
| Semi Detached House | £316,500.00 | 2 Semi Detached Houses |
| Detached House | £624,000.00 | 3 Detached Houses |
| Terraced House | £446,666.00 | 3 Terraced Houses |
