
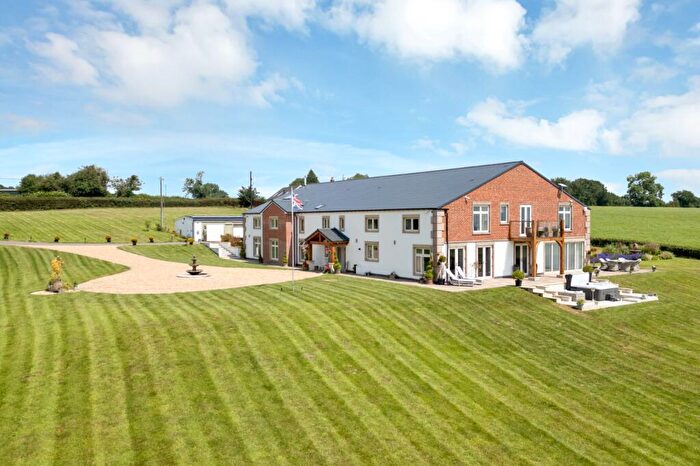
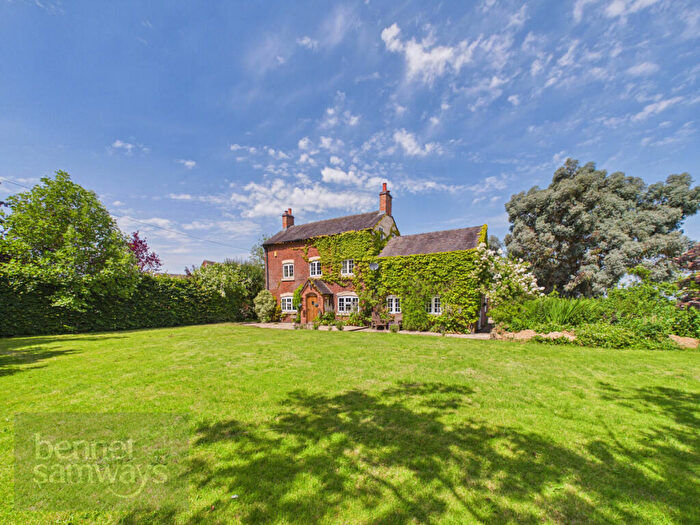
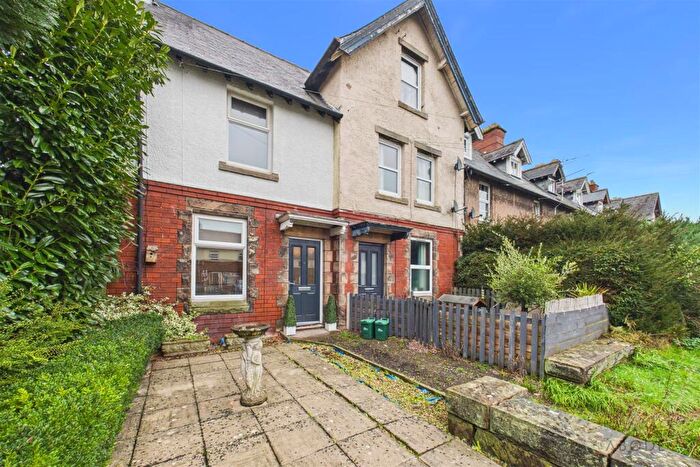
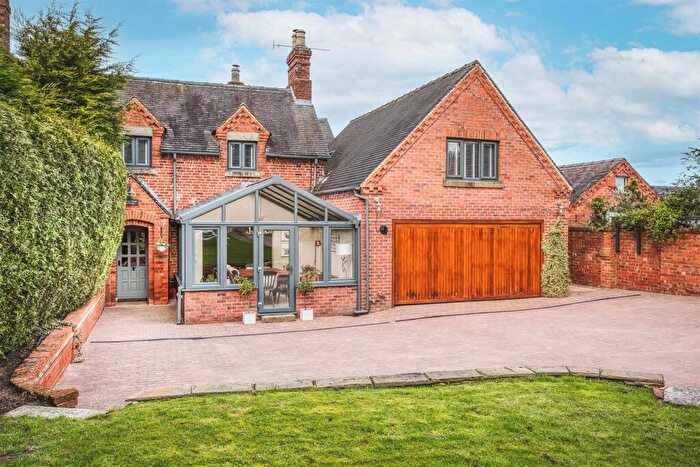
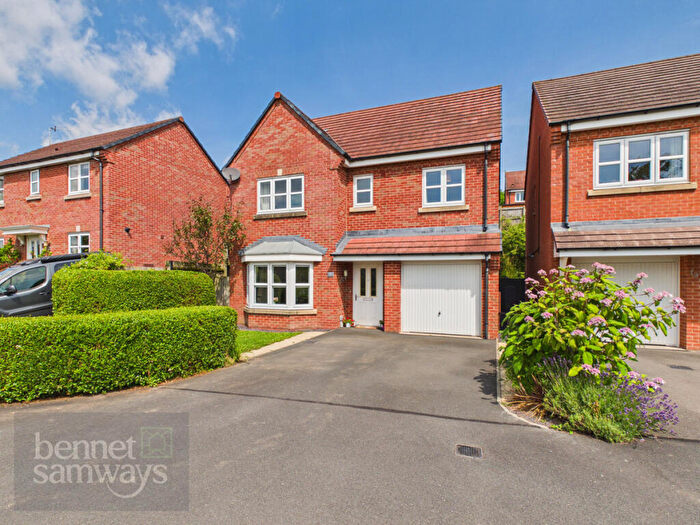
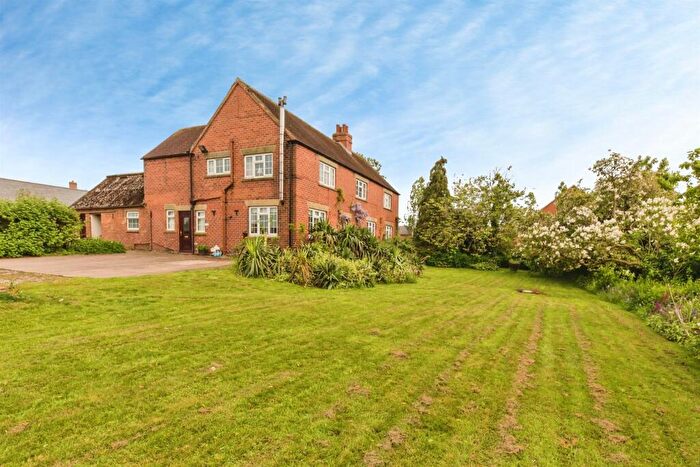
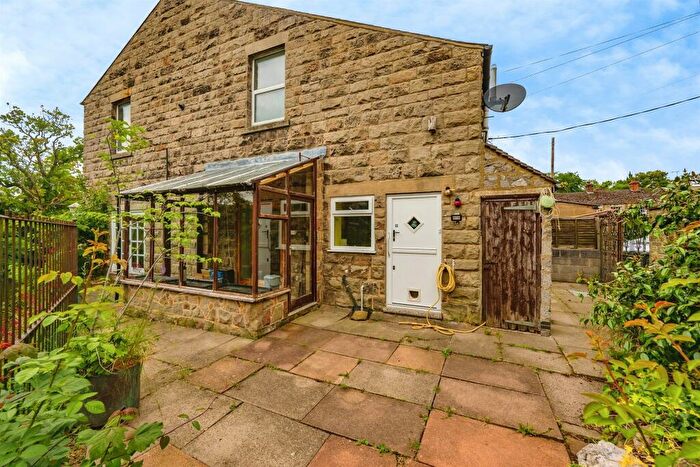
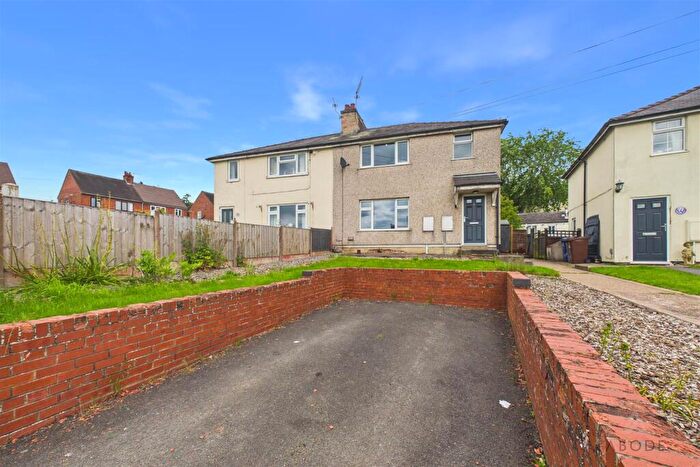
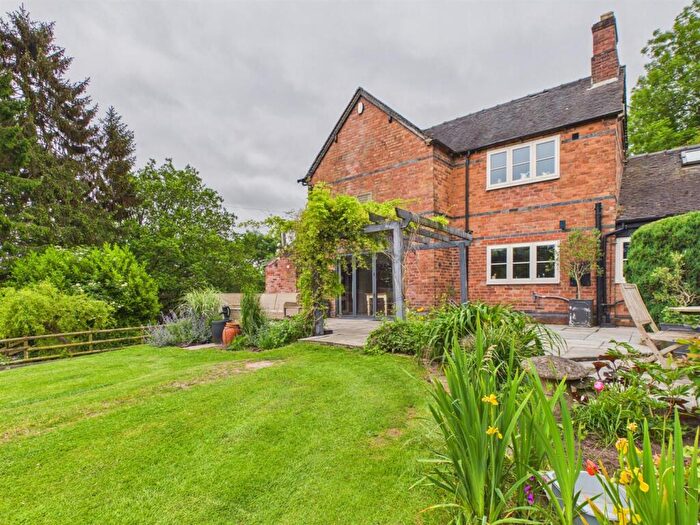
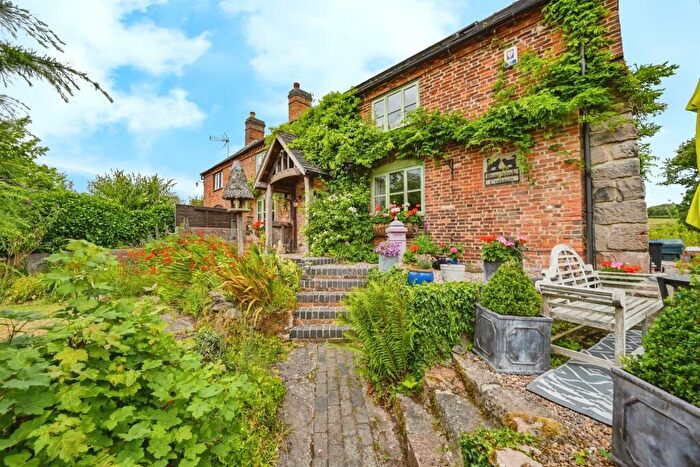
Houses for sale in Norbury, Ashbourne
House Prices in Norbury
Properties in Norbury have an average house price of £494k and had 56 Property Transactions within the last 3 years¹.
Norbury is an area in Ashbourne, Derbyshire with 702 households², where the most expensive property was sold for £1.6M.
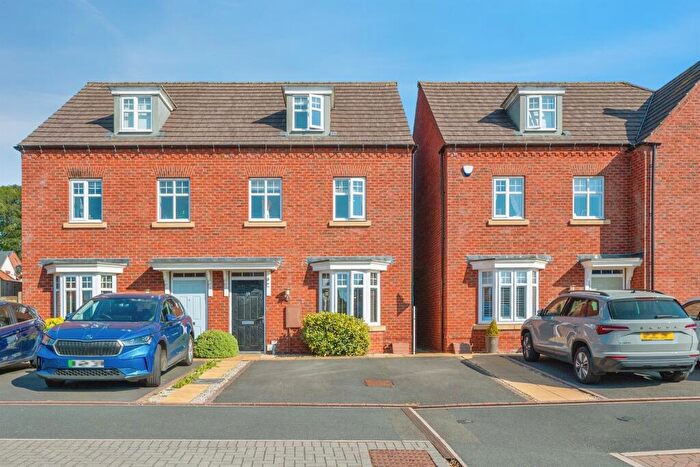
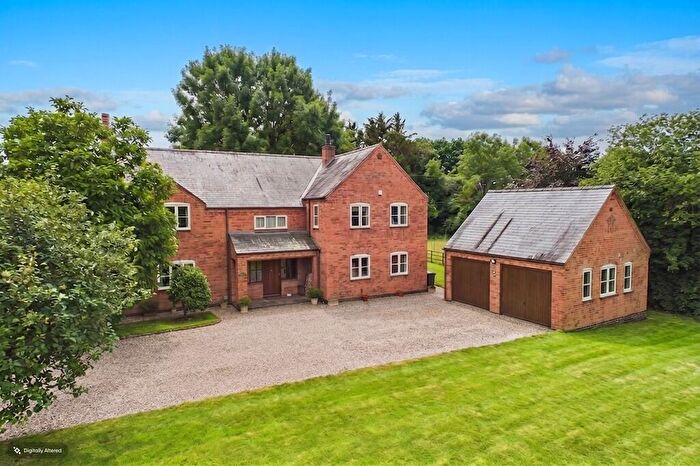
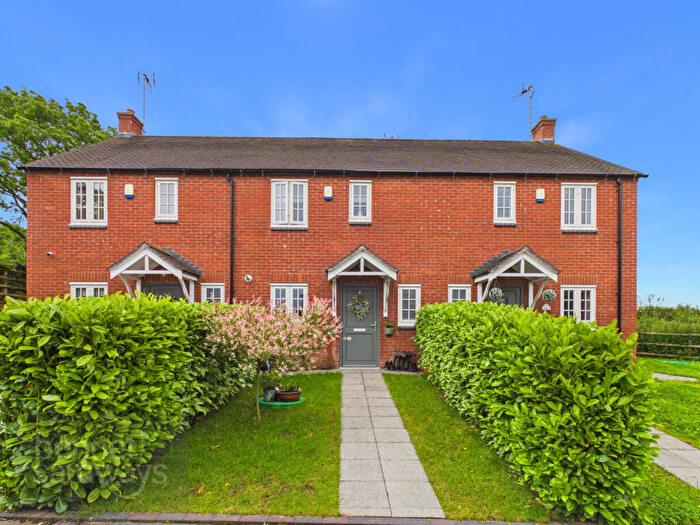
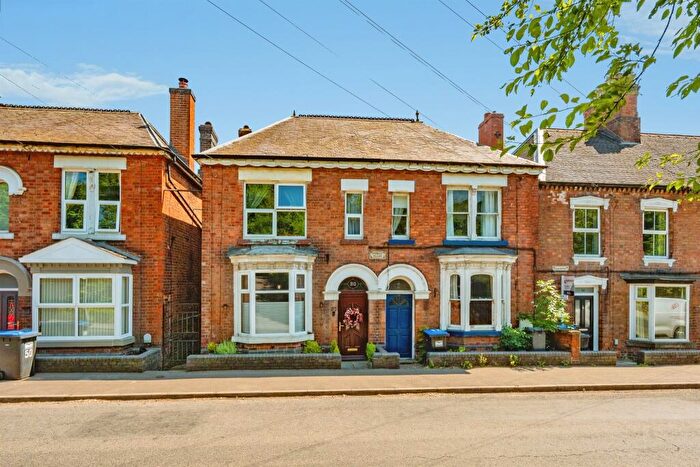
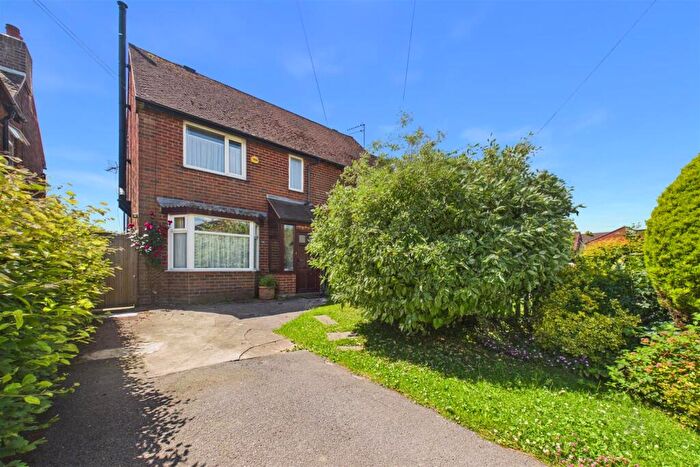
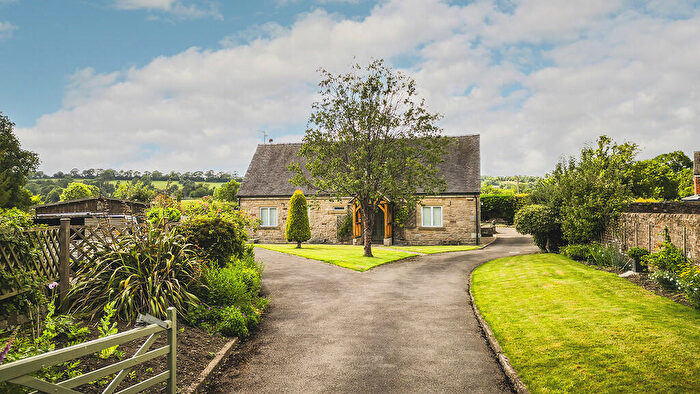
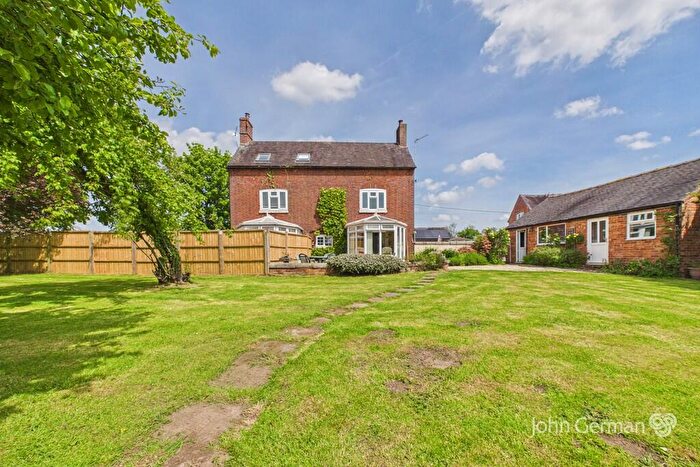
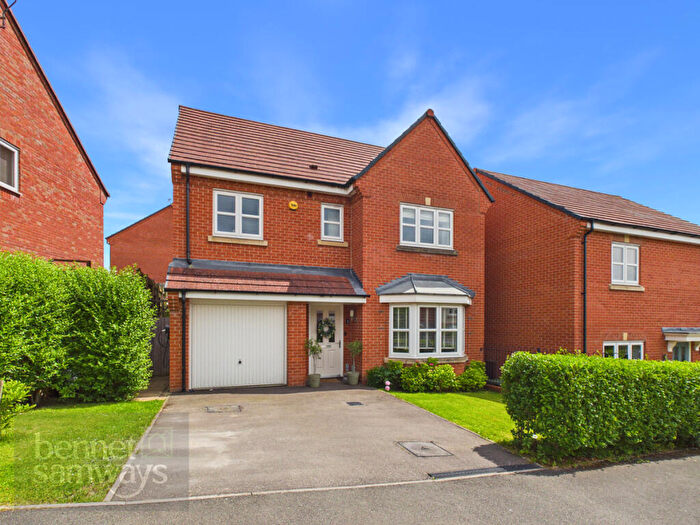
Properties for sale in Norbury
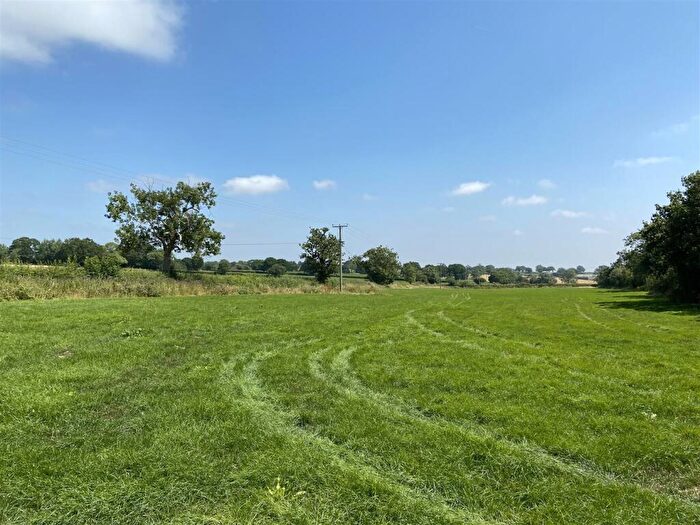


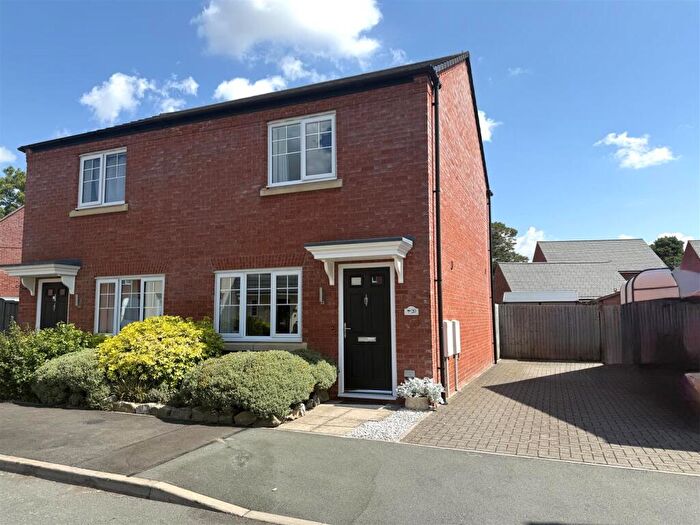
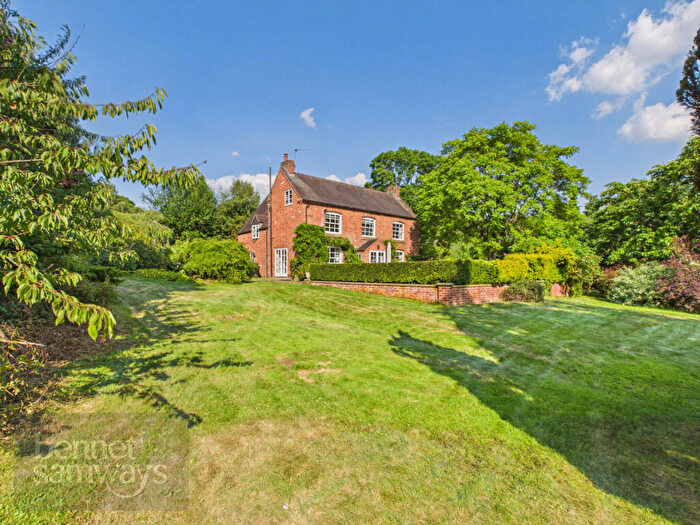
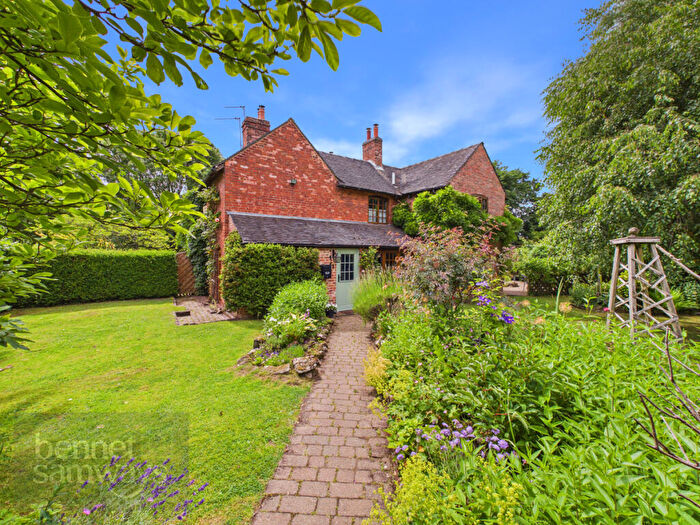
![]()
If you are looking to sell your house, let it out, or receive a property valuation, an expert can help you.
Click the button below to get started.
Roads and Postcodes in Norbury
Navigate through our locations to find the location of your next house in Norbury, Ashbourne for sale or to rent.
| Streets | Postcodes |
|---|---|
| Appletree Lane | DE6 2FP |
| Ashbourne Road | DE6 5QX |
| Ashbrook Grove | DE6 5QY |
| Audishaw Lane | DE6 5AE |
| Council Houses | DE6 3DH |
| Crofton Close | DE6 2ES |
| Cubley Common | DE6 2EX |
| Cubley Lane | DE6 2FG |
| Cubley Wood | DE6 2EU |
| Gravelly Bank Mews | DE6 2DY |
| Grove Lane | DE6 5PB |
| Hales Green | DE6 2DS |
| Hollies Lane | DE6 2EW |
| Leapley Lane | DE6 2DU |
| Little Cubley | DE6 2FB |
| Marston Common | DE6 2EJ |
| Marston Lane | DE6 5LS |
| Old School Meadows | DE6 2FQ |
| Orchard View | DE6 2HG |
| Priory Close | DE6 2DX |
| Riggs Lane | DE6 2FD |
| Roston Common | DE6 2EL |
| The Cottage | DE6 3AQ |
| Undertown Lane | DE6 2ER |
| Waldley | DE6 5LR |
| Weston Bank | DE6 2FN |
| DE6 2DT DE6 2ED DE6 2EE DE6 2EF DE6 2EG DE6 2EH DE6 2EQ DE6 2ET DE6 2EY DE6 2EZ DE6 2FE DE6 2FF DE6 2FH DE6 2FJ DE6 2FL DE6 3AL DE6 3AN DE6 3AP DE6 3DF DE6 3DG DE6 3DJ DE6 3DL DE6 5AA DE6 5AB DE6 5AD DE6 5PD |
Property price trends in Norbury
According to the latest Land Registry data, the average home in Norbury sold for £430,000 in 2026. That figure comes from 556 sales logged over the past 31 years.
Prices have fallen back over the last three years. Compared with 2023, when the typical sale came in around £563,733, that's a fall of roughly 23.7%.
Looking back five years, average prices are down about 29.1% since 2021, a drop of around £176,307 in cash terms.
Zoom out to the past decade for the fuller picture. Back in 2016, homes here averaged £403,428, so the typical sold price has climbed about 6.6% since then, roughly 0.6% a year. Stretch the view to fifteen years and that annual pace edges up closer to 2.2%.
Frequently asked questions about Norbury
What is the average price for a property for sale in Norbury?
The average price for a property for sale in Norbury is £493,971. This amount is 28% higher than the average price in Ashbourne. There are 510 property listings for sale in Norbury.
What streets have the most expensive properties for sale in Norbury?
The streets with the most expensive properties for sale in Norbury are Cubley Common at an average of £442,500, Council Houses at an average of £425,827 and Leapley Lane at an average of £312,000.
What streets have the most affordable properties for sale in Norbury?
The streets with the most affordable properties for sale in Norbury are Gravelly Bank Mews at an average of £176,500, Weston Bank at an average of £180,000 and Roston Common at an average of £295,000.
Which train stations are available in or near Norbury?
Some of the train stations available in or near Norbury are Uttoxeter, Tutbury and Hatton and Willington.
Property Price Paid in Norbury by Year
The average sold property price by year was:
| Year | Average Sold Price | Price Change |
Sold Properties
|
|---|---|---|---|
| 2026 | £430,000 | -12% |
1 Property |
| 2025 | £482,893 | 5% |
19 Properties |
| 2024 | £457,211 | -23% |
21 Properties |
| 2023 | £563,733 | 13% |
15 Properties |
| 2022 | £489,743 | -24% |
15 Properties |
| 2021 | £606,307 | 14% |
14 Properties |
| 2020 | £520,979 | -4% |
12 Properties |
| 2019 | £540,100 | 49% |
20 Properties |
| 2018 | £273,700 | -34% |
16 Properties |
| 2017 | £365,810 | -10% |
19 Properties |
Property Price per Property Type in Norbury
Here you can find historic sold price data in order to help with your property search.
The average Property Paid Price for specific property types in the last three years are:
| Property Type | Average Sold Price | Sold Properties |
|---|---|---|
| Semi Detached House | £297,132.00 | 15 Semi Detached Houses |
| Detached House | £656,030.00 | 31 Detached Houses |
| Terraced House | £286,850.00 | 10 Terraced Houses |
