
Houses for sale in Bakewell, Bakewell
House Prices in Bakewell
Properties in Bakewell have an average house price of £414k and had 217 Property Transactions within the last 3 years¹.
Bakewell is an area in Bakewell, Derbyshire with 2,043 households², where the most expensive property was sold for £1.23M.
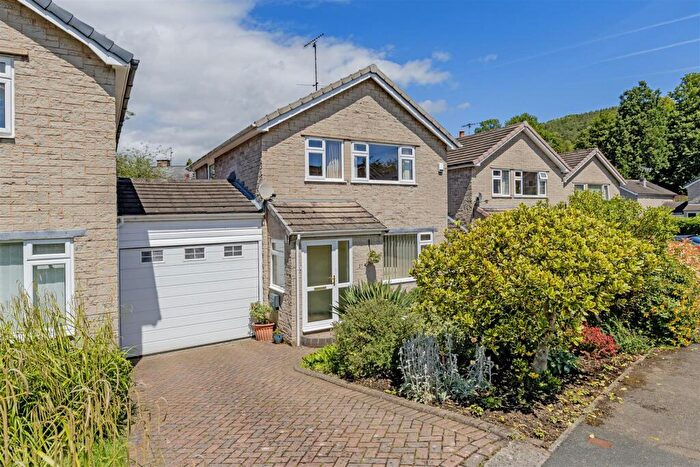
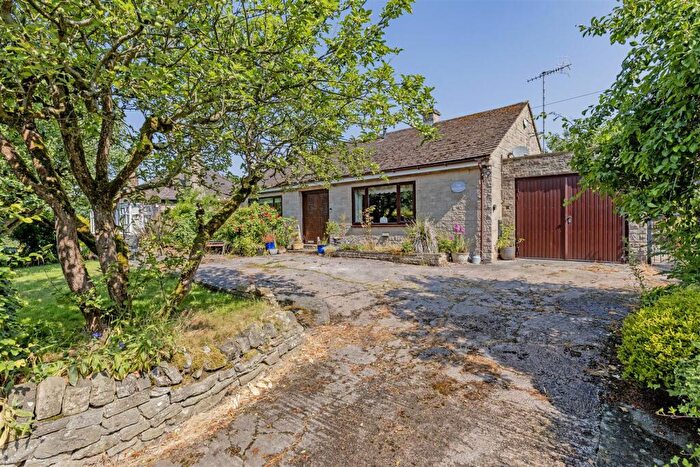
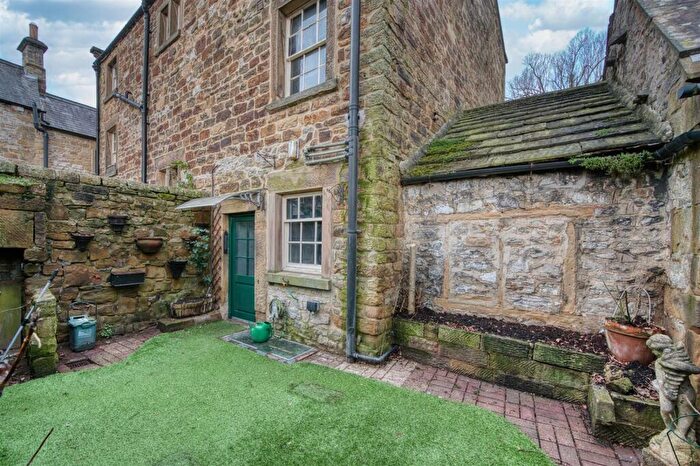
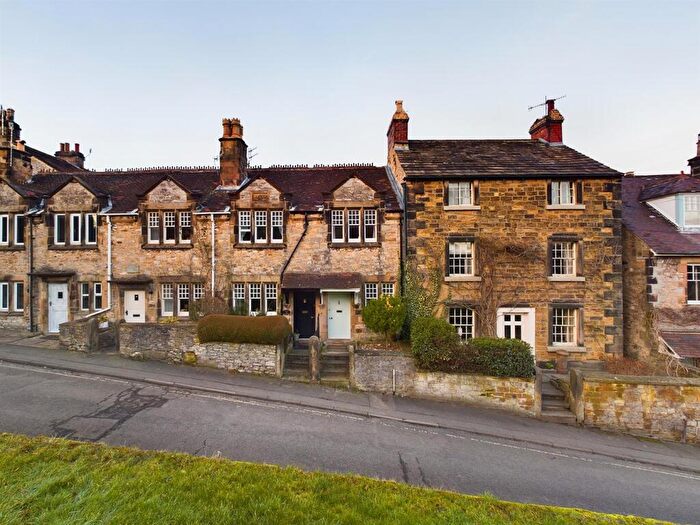
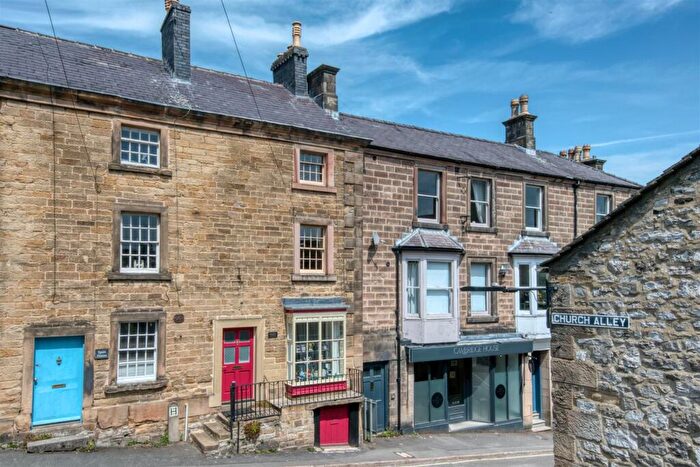
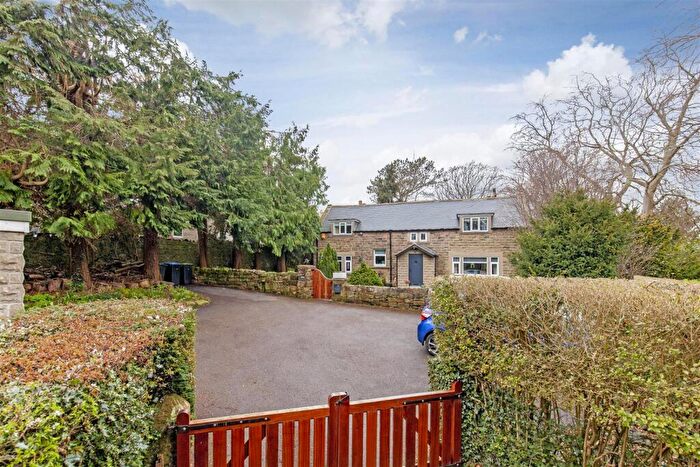
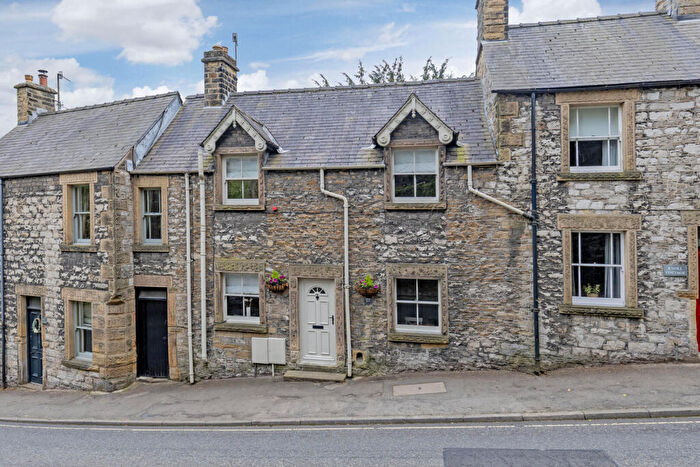
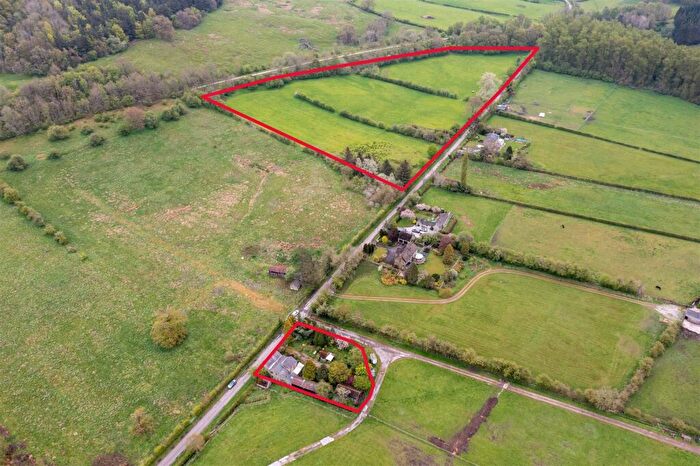
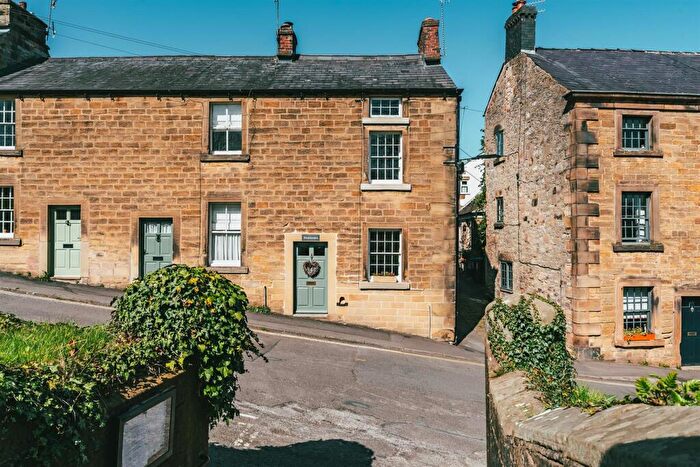
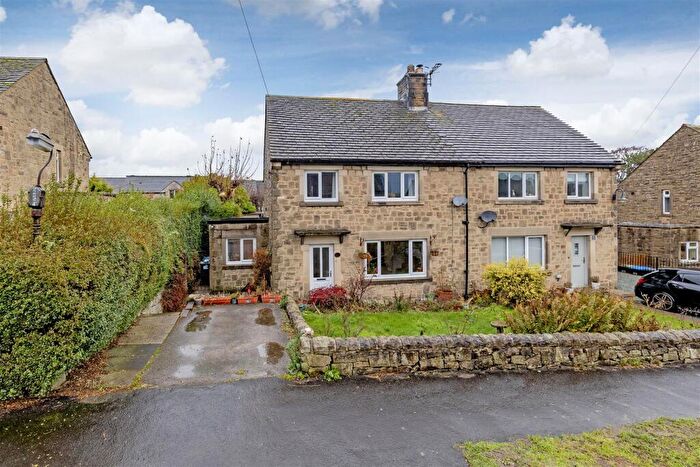
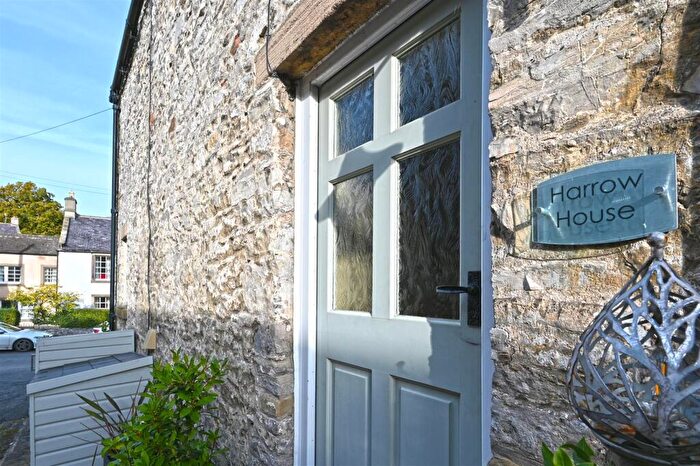
Properties for sale in Bakewell
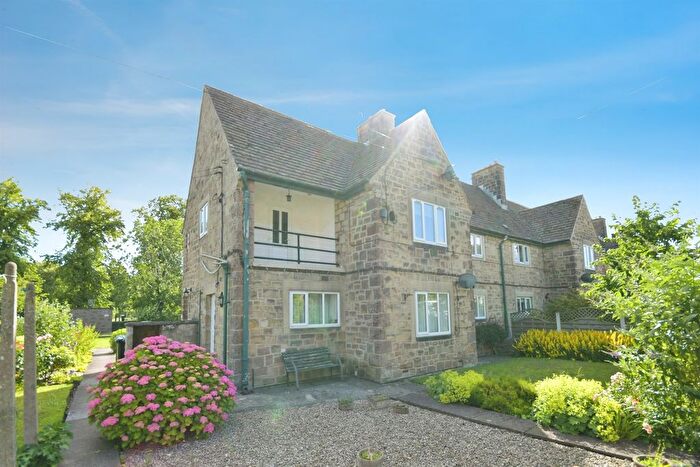
![]()
If you are looking to sell your house, let it out, or receive a property valuation, an expert can help you.
Click the button below to get started.
Roads and Postcodes in Bakewell
Navigate through our locations to find the location of your next house in Bakewell, Bakewell for sale or to rent.
| Streets | Postcodes |
|---|---|
| Agricultural Way | DE45 1AH |
| Aldern Way | DE45 1AJ |
| Anchor Square | DE45 1DR |
| Ashford Lane | DE45 1NJ |
| Ashford Road | DE45 1GL DE45 1GT DE45 1PX |
| Bagshaw Hill | DE45 1DL |
| Bakewell Road | DE45 1HY |
| Baslow Road | DE45 1AD DE45 1AE DE45 1AA DE45 1AB DE45 1AF DE45 1QA |
| Bath Street | DE45 1BX |
| Betty Lane | DE45 1PZ |
| Bole Hill | DE45 1QW |
| Bridge Street | DE45 1FY DE45 1DS |
| Brookfield Lane | DE45 1AN |
| Brookside | DE45 1DY |
| Burre Close | DE45 1GD |
| Burton Close Drive | DE45 1BG |
| Burton Close Mews | DE45 1AG |
| Burton Edge | DE45 1FQ |
| Butts Road | DE45 1ED DE45 1BP |
| Butts Terrace | DE45 1EB |
| Butts View | DE45 1FE |
| Buxton Road | DE45 1GS DE45 1BW DE45 1BZ DE45 1DA DE45 1QP |
| Calton View | DE45 1FN |
| Castle Close | DE45 1AU |
| Castle Drive | DE45 1AS |
| Castle Mount Crescent | DE45 1AT |
| Castle Mount Way | DE45 1BQ |
| Castle Street | DE45 1DU |
| Catcliffe Close | DE45 1AZ |
| Catcliffe Cottages | DE45 1FL |
| Chapel Row | DE45 1EL |
| Cherry Close | DE45 1QE |
| Church Alley | DE45 1FF |
| Church Lane | DE45 1DE |
| Church Street | DE45 1QB |
| Colonel Wright Close | DE45 1JY |
| Coombs Road | DE45 1AQ DE45 1AR DE45 1BU |
| Court Lane | DE45 1QG |
| Cunningham Place | DE45 1DD |
| Dagnall Gardens | DE45 1EH DE45 1EN DE45 1FB |
| Fennel Street | DE45 1QF |
| Fly Hill | DE45 1DN |
| Granby Arcade | DE45 1EG |
| Granby Croft | DE45 1ET |
| Granby Road | DE45 1ES |
| Greaves Lane | DE45 1QH |
| Green Lane | DE45 1HX |
| Haddon Drive | DE45 1BD |
| Haddon Grove | DE45 1JF |
| Haddon Road | DE45 1BN DE45 1AW DE45 1EP |
| Hall End Lane | DE45 1QJ |
| Hassop Road | DE45 1AP |
| Highfield Close | DE45 1GP |
| Highfield Drive | DE45 1GW |
| Highfields | DE45 1QN |
| Hill Cross | DE45 1QL |
| Holme Lane | DE45 1GF |
| Holywell | DE45 1BA |
| Horsecroft Court | DE45 1HJ |
| Intake Lane | DE45 1BL |
| John Bank Lane | DE45 1PY |
| King Street | DE45 1DZ |
| Lakeside | DE45 1GN |
| Longstone Lane | DE45 1NH |
| Market Street | DE45 1HG |
| Matlock Street | DE45 1EE DE45 1GQ DE45 1HD |
| Merrial Close | DE45 1JB |
| Mesne Lane | DE45 1AL |
| Milford | DE45 1DX |
| Mill Street | DE45 1HH |
| Monsal Head | DE45 1NL |
| Monyash Road | DE45 1FG DE45 1HZ DE45 1QY DE45 1QZ |
| Moorhall | DE45 1FT |
| Moorhall Estate | DE45 1FP |
| New Close Lane | DE45 1HQ |
| New Lumford | DE45 1GH |
| New Street | DE45 1BF DE45 1DW |
| North Church Street | DE45 1DB |
| Old Lumford Cottages | DE45 1GG |
| Park Road | DE45 1AX |
| Park View | DE45 1BS |
| Parsonage Croft | DE45 1DF |
| Pinfold View | DE45 1GR |
| Portland Square | DE45 1HA DE45 1HB |
| Prospect Terrace | DE45 1DG |
| Riverside Business Park | DE45 1GZ DE45 1GU |
| Riverside Crescent | DE45 1HF |
| Rock Terrace | DE45 1DJ |
| School Lane | DE45 1HT |
| Sheldon Lane | DE45 1QR |
| Shutts Lane | DE45 1JA |
| Smiths Lane | DE45 1EJ |
| South Church Street | DE45 1EA DE45 1FD |
| Stanedge Road | DE45 1DP |
| Stanton View | DE45 1FS |
| Station Road | DE45 1GA DE45 1GB DE45 1GE |
| Stoney Close | DE45 1FR |
| The Avenue | DE45 1EQ |
| The Dukes Drive | DE45 1QQ |
| The Square | DE45 1BT |
| The Yeld | DE45 1FH |
| Undercliffe | DE45 1DH |
| Vernon Drive | DE45 1FZ |
| Vernon Green | DE45 1DT |
| Water Lane | DE45 1EU DE45 1YY |
| Water Street | DE45 1EW |
| Woodside Close | DE45 1AY |
| Woodside Drive | DE45 1ER |
| Wye Bank Grove | DE45 1BJ |
| Wye Croft Court | DE45 1EZ |
| Wye Dale Close | DE45 1BB |
| Wyebank | DE45 1BH |
| Wyedale Crescent | DE45 1BE |
| Yeld Close | DE45 1FX |
| Yeld Road | DE45 1FJ DE45 1FW |
| Youlgrave Road | DE45 1JD |
| DE45 1LT DE45 1QU DE45 1YB DE45 1YG DE45 9AY DE45 9BE DE45 9BF DE45 9BG DE45 9BH DE45 9BJ DE45 9BL DE45 9BP DE45 1JE DE45 1JG DE45 1JX DE45 1LA DE45 1NB DE45 1ND DE45 1NX DE45 1NZ DE45 1QS DE45 1QT DE45 1QX |
Property price trends in Bakewell
According to the latest Land Registry data, the average home in Bakewell sold for £365,416 in 2026. That figure comes from 2,548 sales logged over the past 31 years.
Prices have softened over the last three years. Compared with 2023, when the typical sale came in around £378,663, that's a fall of roughly 3.5%.
Looking back five years, average prices are down about 17.9% since 2021, a drop of around £79,727 in cash terms.
Zoom out to the past decade for the fuller picture. Back in 2016, homes here averaged £347,469, so the typical sold price has climbed about 5.2% since then, roughly 0.5% a year. Stretch the view to fifteen years and that annual pace edges up closer to 1.7%.
Frequently asked questions about Bakewell
What is the average price for a property for sale in Bakewell?
The average price for a property for sale in Bakewell is £414,314. This amount is 10% lower than the average price in Bakewell. There are 498 property listings for sale in Bakewell.
What streets have the most expensive properties for sale in Bakewell?
The streets with the most expensive properties for sale in Bakewell are Butts View at an average of £1,150,000, Station Road at an average of £1,080,000 and Church Lane at an average of £800,000.
What streets have the most affordable properties for sale in Bakewell?
The streets with the most affordable properties for sale in Bakewell are Highfield Drive at an average of £152,333, Rock Terrace at an average of £169,750 and Church Alley at an average of £180,000.
Which train stations are available in or near Bakewell?
Some of the train stations available in or near Bakewell are Grindleford, Matlock and Hathersage.
Property Price Paid in Bakewell by Year
The average sold property price by year was:
| Year | Average Sold Price | Price Change |
Sold Properties
|
|---|---|---|---|
| 2026 | £365,416 | -17% |
6 Properties |
| 2025 | £427,652 | -2% |
72 Properties |
| 2024 | £436,618 | 13% |
74 Properties |
| 2023 | £378,663 | -22% |
65 Properties |
| 2022 | £462,460 | 4% |
82 Properties |
| 2021 | £445,143 | 5% |
88 Properties |
| 2020 | £422,566 | 12% |
63 Properties |
| 2019 | £369,871 | 1% |
86 Properties |
| 2018 | £366,240 | 13% |
67 Properties |
| 2017 | £320,296 | -8% |
80 Properties |
Property Price per Property Type in Bakewell
Here you can find historic sold price data in order to help with your property search.
The average Property Paid Price for specific property types in the last three years are:
| Property Type | Average Sold Price | Sold Properties |
|---|---|---|
| Flat | £232,875.00 | 20 Flats |
| Semi Detached House | £376,478.00 | 73 Semi Detached Houses |
| Detached House | £565,920.00 | 73 Detached Houses |
| Terraced House | £322,621.00 | 51 Terraced Houses |
