
Houses for sale in Chatsworth, Matlock
House Prices in Chatsworth
Properties in Chatsworth have an average house price of £357k and had 2 Property Transactions within the last 3 years¹.
Chatsworth is an area in Matlock, Derbyshire with 66 households², where the most expensive property was sold for £500k.
Previously listed properties in Chatsworth
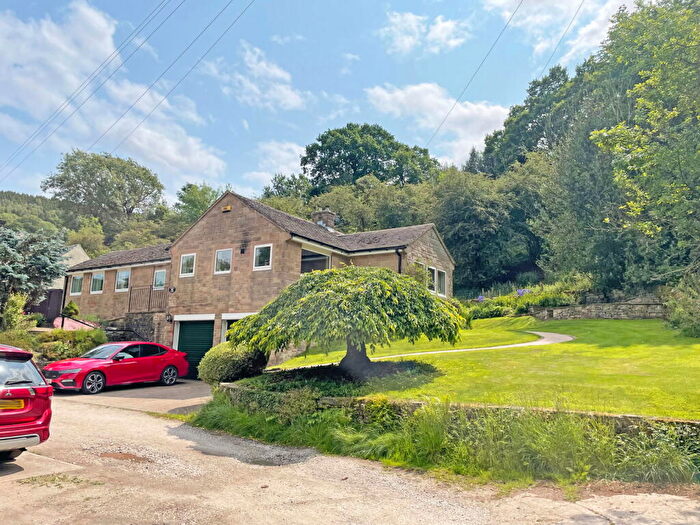

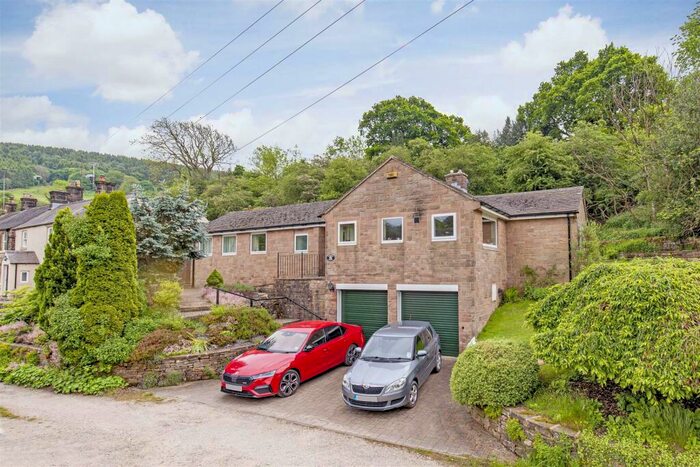
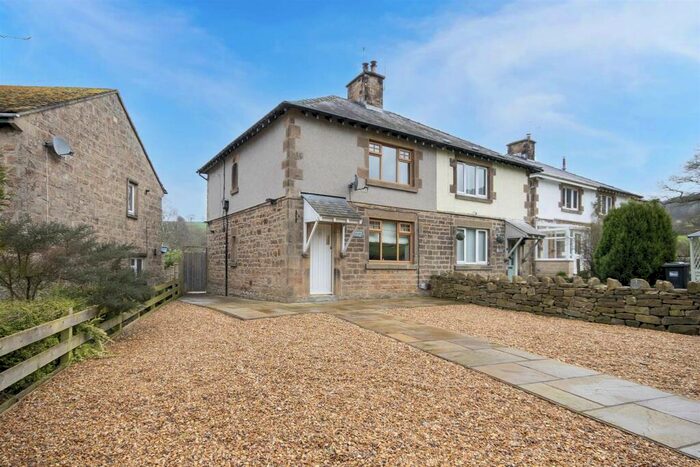
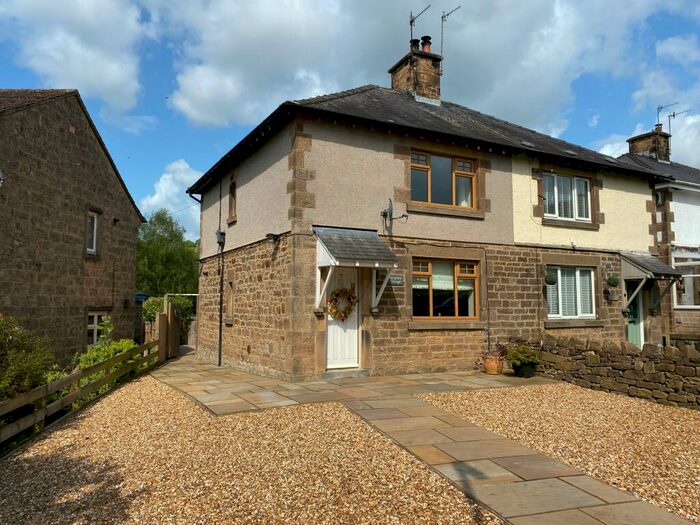

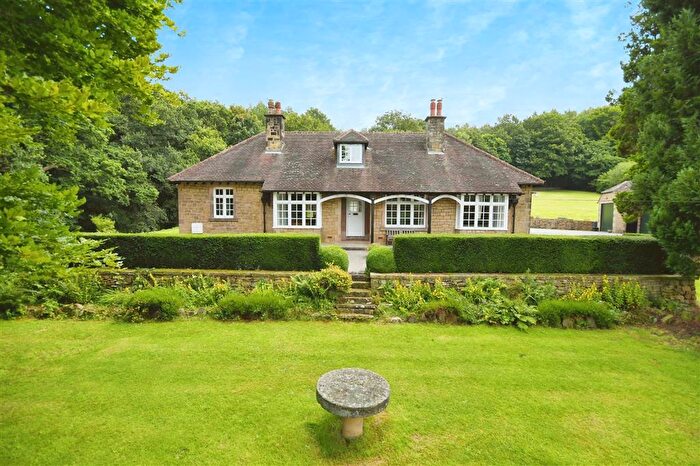
![]()
If you are looking to sell your house, let it out, or receive a property valuation, an expert can help you.
Click the button below to get started.


Roads and Postcodes in Chatsworth
Navigate through our locations to find the location of your next house in Chatsworth, Matlock for sale or to rent.
| Streets | Postcodes |
|---|---|
| Brookside | DE4 2NB |
| Calton Lees | DE4 2NX |
| Chapel Hill | DE4 2ND |
| Chesterfield Road | DE4 2NQ |
| Church Lane | DE4 2NY |
| Devonshire Square | DE4 2NR DE4 2NZ |
| Hill Top | DE4 2NW |
| Moor End | DE4 2NS |
| Pig Lane | DE4 2NT |
| Rowsley Road | DE4 2PS |
| School Lane | DE4 2NU |
Property price trends in Chatsworth
According to the latest Land Registry data, the average home in Chatsworth sold for £356,500 in 2025. That figure comes from 35 sales logged over the past 30 years.
Prices have fallen back over the last three years. Compared with 2022, when the typical sale came in around £652,750, that's a fall of roughly 45.4%.
Looking back five years, average prices are down about 18% since 2020, a drop of around £78,500 in cash terms.
Zoom out to the past decade for the fuller picture. Back in 2015, homes here averaged £554,975, so the typical sold price has fallen about 35.8% since then, around 4.3% a year lower. Stretch the view to fifteen years and that annual pace edges up closer to -0.4%.
Frequently asked questions about Chatsworth
What is the average price for a property for sale in Chatsworth?
The average price for a property for sale in Chatsworth is £356,500. This amount is 9% higher than the average price in Matlock. There are 11 property listings for sale in Chatsworth.
Which train stations are available in or near Chatsworth?
Some of the train stations available in or near Chatsworth are Matlock, Matlock Bath and Cromford.
Property Price Paid in Chatsworth by Year
The average sold property price by year was:
| Year | Average Sold Price | Price Change |
Sold Properties
|
|---|---|---|---|
| 2025 | £356,500 | -83% |
2 Properties |
| 2022 | £652,750 | -22% |
1 Property |
| 2021 | £797,500 | 45% |
2 Properties |
| 2020 | £435,000 | 37% |
1 Property |
| 2019 | £272,500 | -22% |
2 Properties |
| 2017 | £331,250 | 12% |
2 Properties |
| 2016 | £292,500 | -90% |
2 Properties |
| 2015 | £554,975 | 68% |
2 Properties |
| 2014 | £175,000 | -64% |
1 Property |
| 2013 | £287,500 | -31% |
2 Properties |
Property Price per Property Type in Chatsworth
Here you can find historic sold price data in order to help with your property search.
The average Property Paid Price for specific property types in the last three years are:
| Property Type | Average Sold Price | Sold Properties |
|---|---|---|
| Terraced House | £356,500.00 | 2 Terraced Houses |
