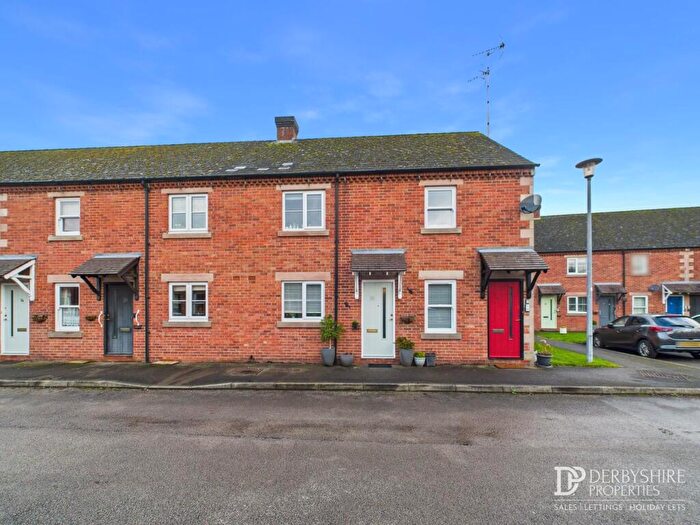
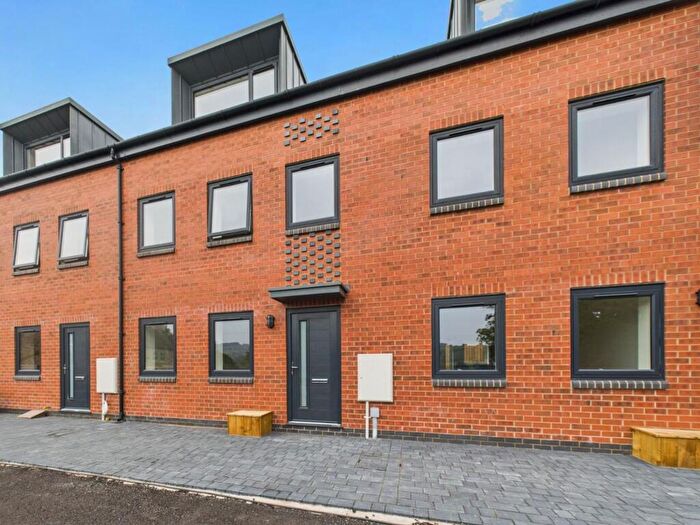
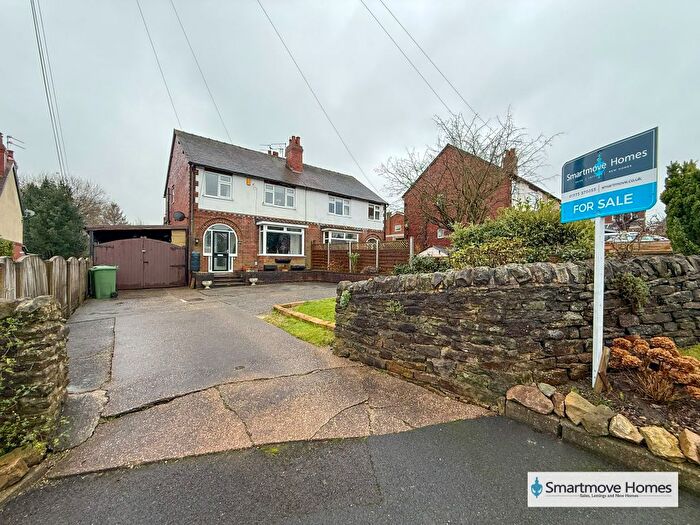
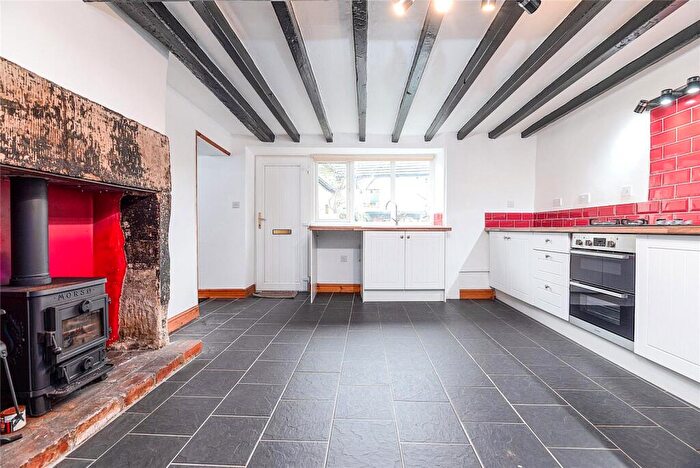
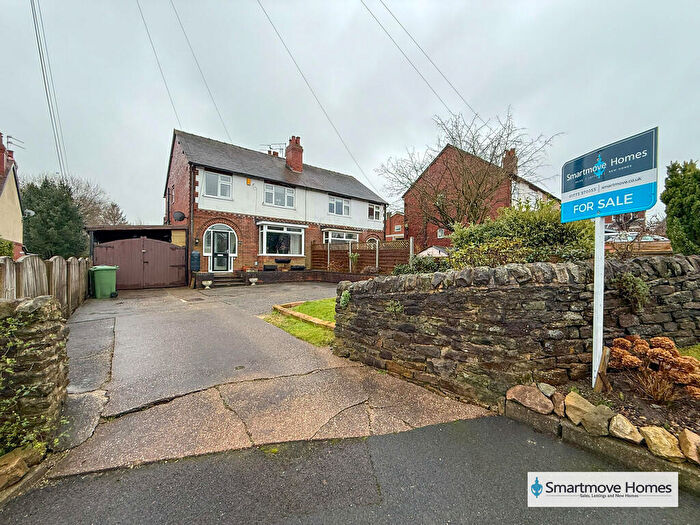
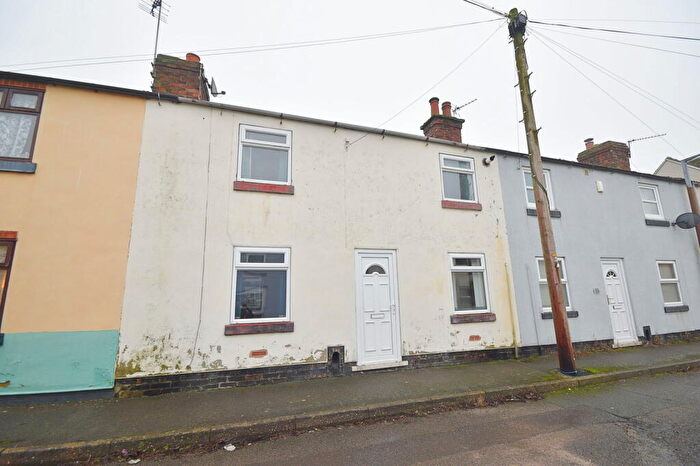
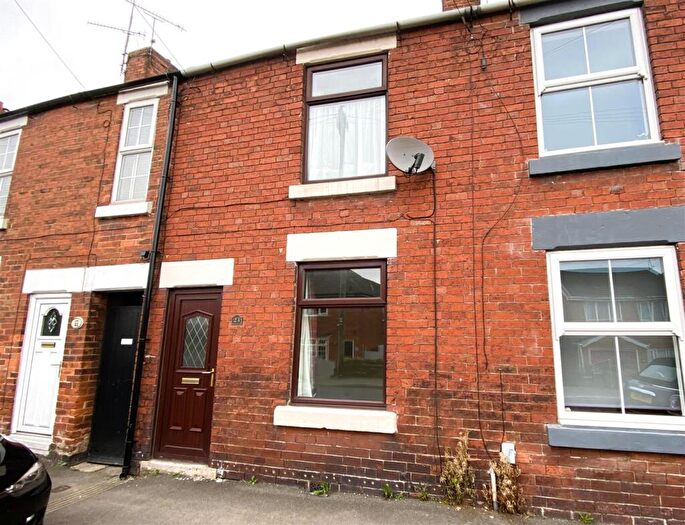
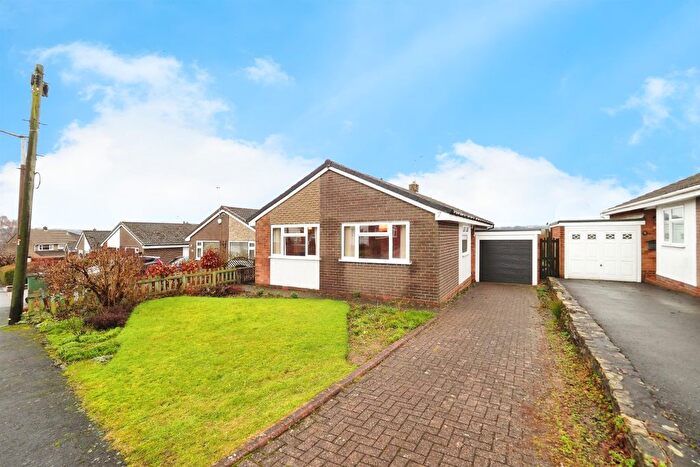
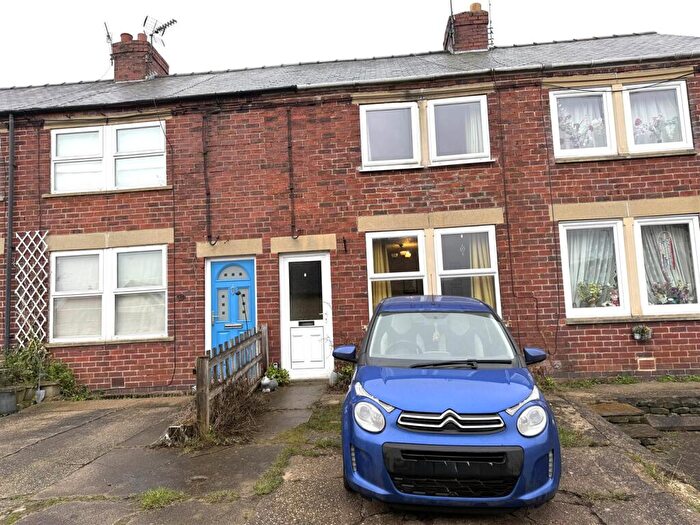
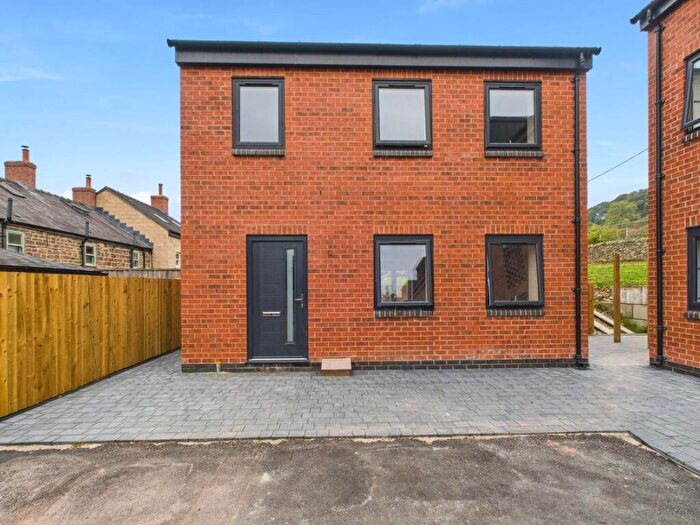
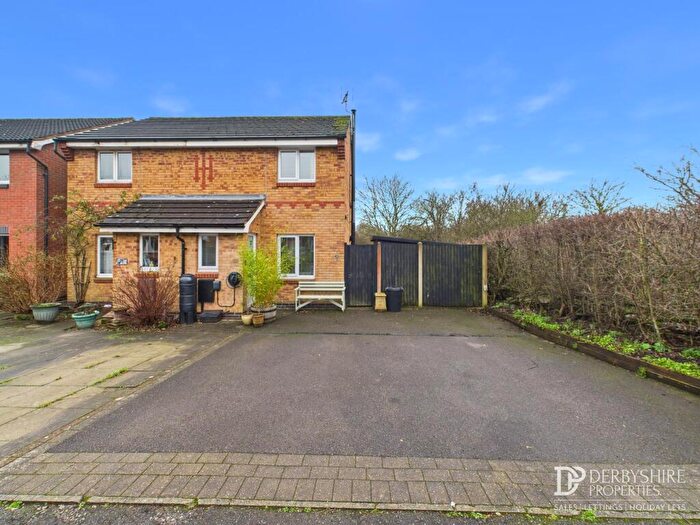
Houses for sale & to rent in Belper North, Belper
House Prices in Belper North
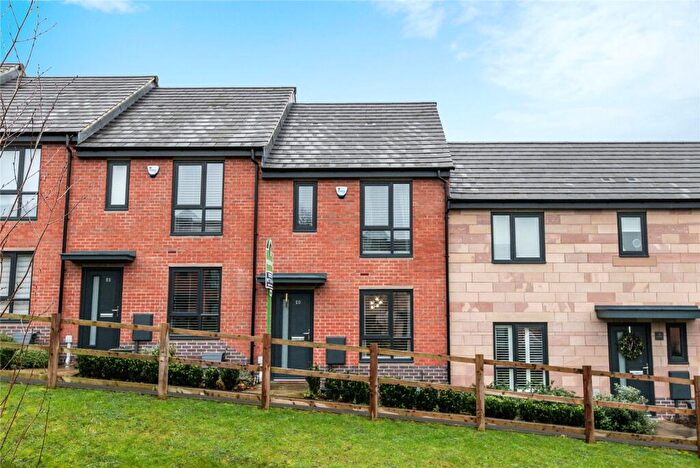
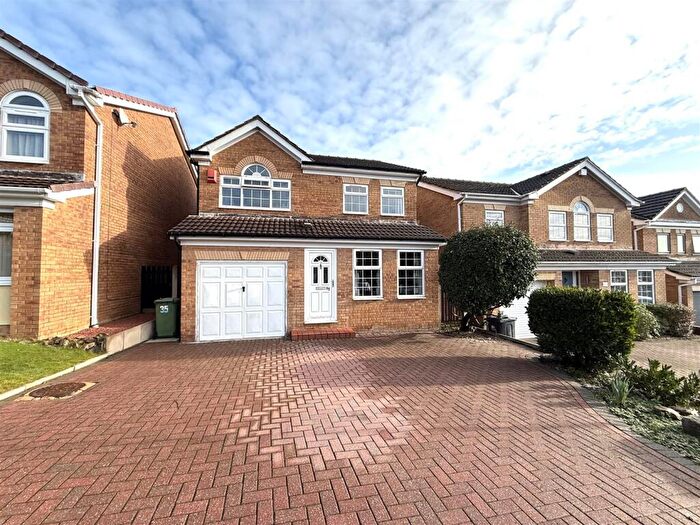
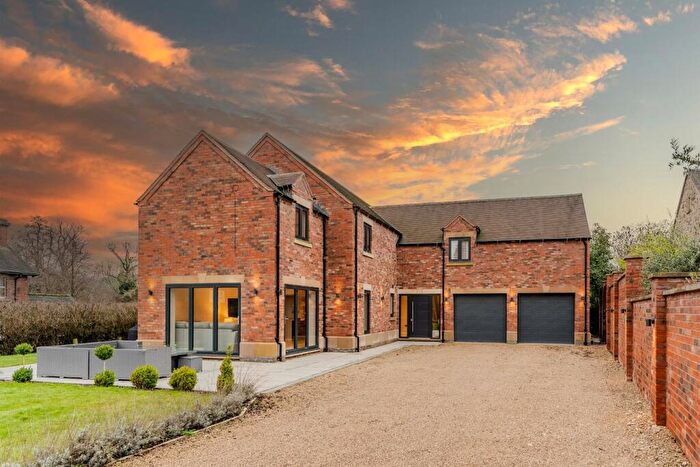
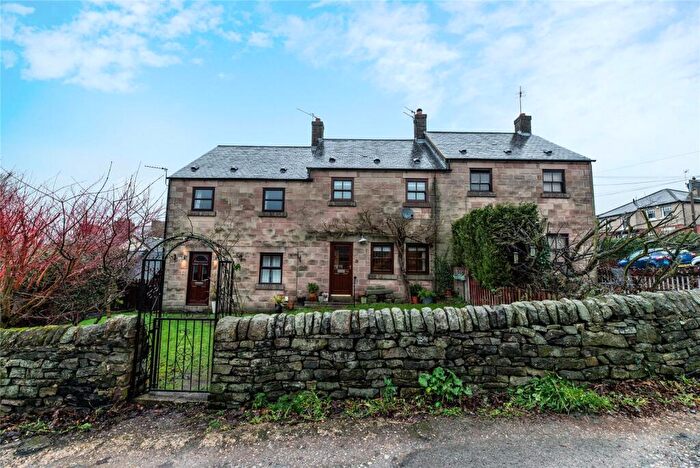
Properties in Belper North have an average house price of £298,655.00 and had 185 Property Transactions within the last 3 years¹.
Belper North is an area in Belper, Derbyshire with 2,147 households², where the most expensive property was sold for £899,950.00.
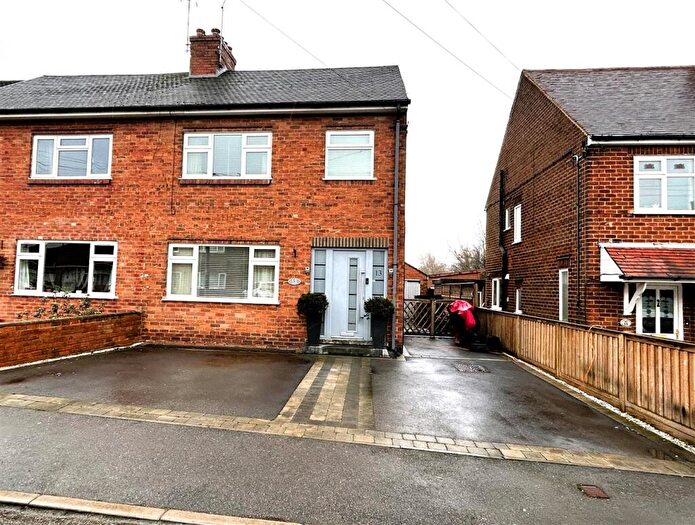
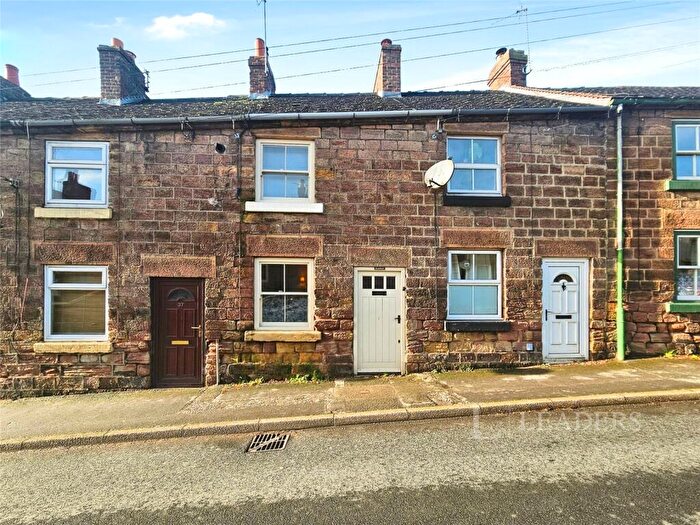
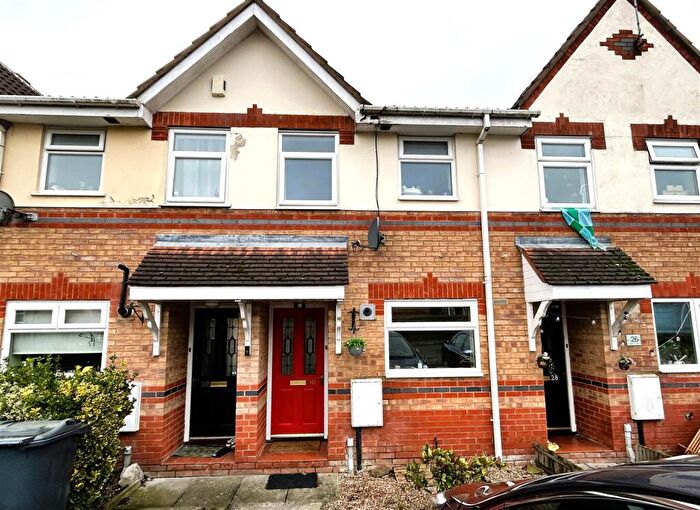
Properties for sale in Belper North
Roads and Postcodes in Belper North
Navigate through our locations to find the location of your next house in Belper North, Belper for sale or to rent.
| Streets | Postcodes |
|---|---|
| Abbots Grove | DE56 1BX |
| Acorn Drive | DE56 1BQ DE56 1EL |
| Acorn Way | DE56 1BG |
| Allstone Lee | DE56 1BS |
| Amber Court | DE56 1HG |
| Appleton Drive | DE56 1FQ |
| Ashbourne Road | DE56 2DA |
| Beechwood Close | DE56 2TU |
| Belper Lane | DE56 2UG DE56 2UH DE56 2UJ DE56 2UQ |
| Belper Lane End | DE56 2DL |
| Bessalone Drive | DE56 1ES |
| Birch Vale | DE56 1BR |
| Bosley Mews | DE56 1BU |
| Bradshaw Croft | DE56 2TX |
| Bridge Foot | DE56 2UA |
| Bridge Hill | DE56 2BY |
| Bridgehill Way | DE56 2UU |
| Broadholme Lane | DE56 2JF DE56 2JG |
| Broom Close | DE56 2TZ |
| Cemetery Road | DE56 1EJ DE56 2DG |
| Charnwood Avenue | DE56 1EA |
| Cherry Tree Avenue | DE56 1FR DE56 1GJ |
| Chesterfield Road | DE56 1FD DE56 1FF |
| Chevin Road | DE56 2UW |
| Church Walk | DE56 1DB |
| Coronation Avenue | DE56 1ER |
| Crich Lane | DE56 1EN DE56 1EP DE56 1EU |
| Dalley Lane | DE56 2DJ |
| Derwent View | DE56 2UD |
| Duncan Close | DE56 1FS |
| Edale Way | DE56 1BP |
| Edward Street | DE56 1DZ |
| Eyam Walk | DE56 1BL |
| Far Laund | DE56 1FJ DE56 1FN DE56 1HB |
| Farnah Green | DE56 2UP |
| Field Row | DE56 1DH |
| Ford Street | DE56 1DX |
| George Street | DE56 1DL |
| Gorsey Close | DE56 2TT |
| High Edge Mews | DE56 1BN |
| Hilltop Rise | DE56 2UR |
| Holly House Lane | DE56 2DE |
| Joseph Street | DE56 1DP |
| Knowl Avenue | DE56 2TL |
| Lancaster Rise | DE56 1HF |
| Laund Close | DE56 1ET |
| Laund Hill | DE56 1FH |
| Leycote Way | DE56 1BT |
| Lodge Drive | DE56 2TP |
| Long Row | DE56 1DR DE56 1DS |
| Longstone Rise | DE56 1ED |
| Marsh Lane | DE56 1GW |
| Matlock Road | DE56 1BE DE56 2JE DE56 2JD |
| Mill Street | DE56 1DT DE56 1DU |
| Mill View | DE56 1FE |
| Mount Pleasant Drive | DE56 2TH DE56 2TQ |
| Oakhurst Close | DE56 2TR |
| Pinewood Road | DE56 2TS |
| Pingle Crescent | DE56 1DY |
| Pingle Lane | DE56 1DW |
| Plains Lane | DE56 2DD |
| Queens Drive | DE56 2TJ |
| Shireoaks | DE56 2BZ |
| Short Row | DE56 1DJ |
| Spring Close | DE56 2TY |
| St Peters Close | DE56 1EB |
| St Peters Croft | DE56 1FT |
| Stoneyfield Bank | DE56 1GA |
| Swinney Bank | DE56 1EG |
| Swinney Lane | DE56 1EF |
| Tanglewood Close | DE56 1AT |
| The Green | DE56 1BW |
| The Meadows | DE56 2UL |
| The Orchard | DE56 1DF |
| The Scotches | DE56 2UE |
| The Spinney | DE56 1EQ |
| The Triangle | DE56 1BJ |
| Well Yard | DE56 1EH |
| Whitehouse Rise | DE56 2TW |
| William Street | DE56 1DN |
| Wren Park Close | DE56 2TN |
| Wyver Lane | DE56 2EF DE56 2UB |
| DE56 2DB DE56 1YD DE56 2DU |
Transport near Belper North
- FAQ
- Price Paid By Year
- Property Type Price
Frequently asked questions about Belper North
What is the average price for a property for sale in Belper North?
The average price for a property for sale in Belper North is £298,655. This amount is 2% lower than the average price in Belper. There are 1,816 property listings for sale in Belper North.
What streets have the most expensive properties for sale in Belper North?
The streets with the most expensive properties for sale in Belper North are Lodge Drive at an average of £781,225, Queens Drive at an average of £548,333 and The Scotches at an average of £535,000.
What streets have the most affordable properties for sale in Belper North?
The streets with the most affordable properties for sale in Belper North are Broadholme Lane at an average of £167,833, Short Row at an average of £168,333 and Coronation Avenue at an average of £185,000.
Which train stations are available in or near Belper North?
Some of the train stations available in or near Belper North are Belper, Ambergate and Duffield.
Property Price Paid in Belper North by Year
The average sold property price by year was:
| Year | Average Sold Price | Price Change |
Sold Properties
|
|---|---|---|---|
| 2025 | £308,860 | 4% |
47 Properties |
| 2024 | £297,542 | 2% |
75 Properties |
| 2023 | £292,366 | 3% |
63 Properties |
| 2022 | £284,246 | -7% |
77 Properties |
| 2021 | £304,511 | 14% |
122 Properties |
| 2020 | £262,374 | 12% |
81 Properties |
| 2019 | £231,134 | -5% |
74 Properties |
| 2018 | £243,168 | 12% |
72 Properties |
| 2017 | £213,690 | 12% |
67 Properties |
| 2016 | £188,878 | -11% |
105 Properties |
| 2015 | £209,637 | 6% |
104 Properties |
| 2014 | £196,640 | 8% |
95 Properties |
| 2013 | £181,843 | 3% |
87 Properties |
| 2012 | £176,261 | 5% |
79 Properties |
| 2011 | £167,254 | -16% |
74 Properties |
| 2010 | £193,877 | 10% |
76 Properties |
| 2009 | £174,207 | -13% |
60 Properties |
| 2008 | £196,055 | 1% |
59 Properties |
| 2007 | £193,958 | 2% |
107 Properties |
| 2006 | £190,661 | 18% |
109 Properties |
| 2005 | £155,575 | -7% |
86 Properties |
| 2004 | £167,192 | 25% |
101 Properties |
| 2003 | £125,458 | 13% |
127 Properties |
| 2002 | £109,333 | 14% |
107 Properties |
| 2001 | £93,787 | 7% |
113 Properties |
| 2000 | £87,091 | 26% |
90 Properties |
| 1999 | £64,547 | 5% |
108 Properties |
| 1998 | £61,095 | 2% |
101 Properties |
| 1997 | £59,598 | 7% |
113 Properties |
| 1996 | £55,441 | -10% |
86 Properties |
| 1995 | £61,100 | - |
71 Properties |
Property Price per Property Type in Belper North
Here you can find historic sold price data in order to help with your property search.
The average Property Paid Price for specific property types in the last three years are:
| Property Type | Average Sold Price | Sold Properties |
|---|---|---|
| Semi Detached House | £260,669.00 | 69 Semi Detached Houses |
| Detached House | £369,387.00 | 80 Detached Houses |
| Terraced House | £214,344.00 | 35 Terraced Houses |
| Flat | £212,000.00 | 1 Flat |

