
Houses for sale in Belper, Derbyshire
House Prices in Belper
Properties in Belper have an average house price of £306k and had 1,691 Property Transactions within the last 3 years.¹
Belper is an area in Derbyshire with 17,524 households², where the most expensive property was sold for £2.76M.
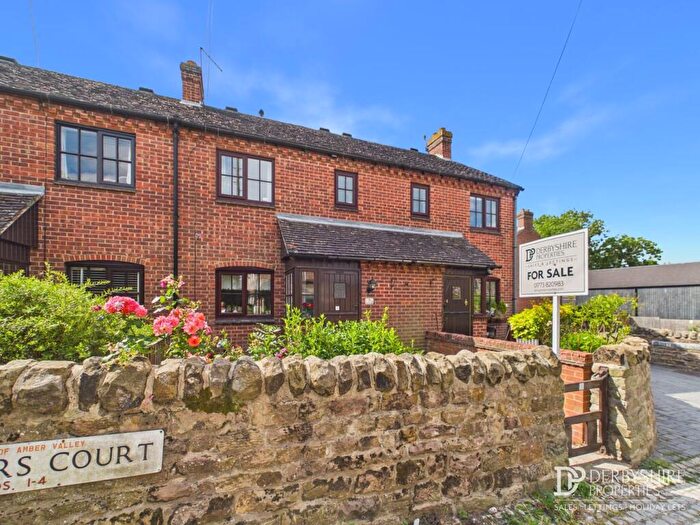
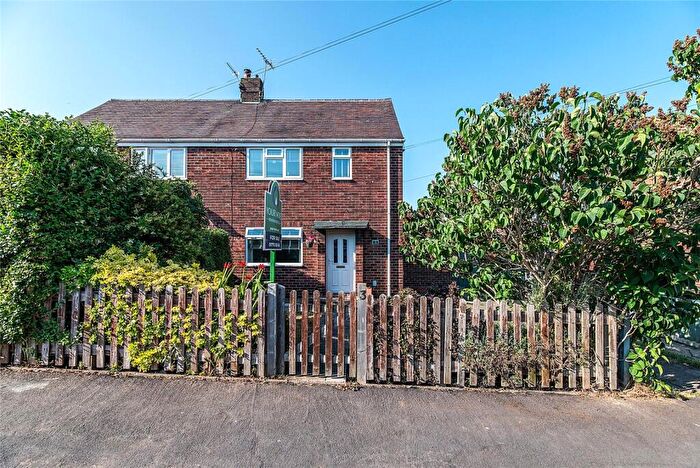
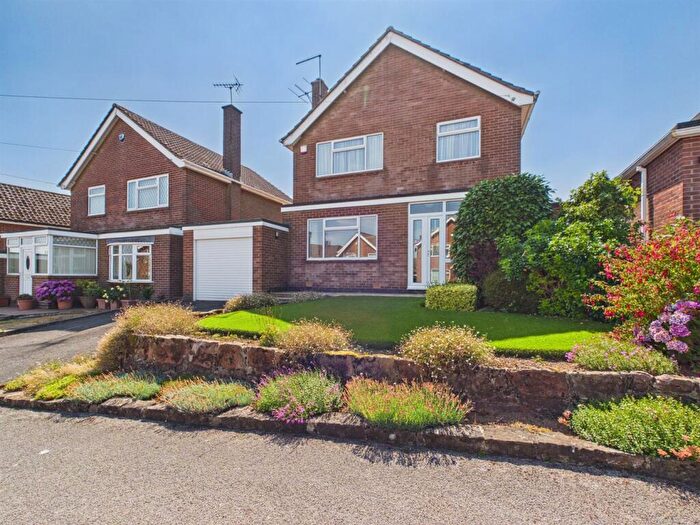
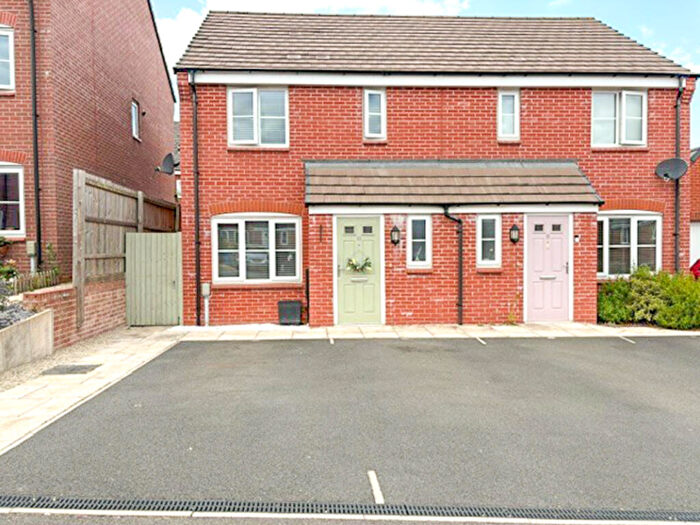
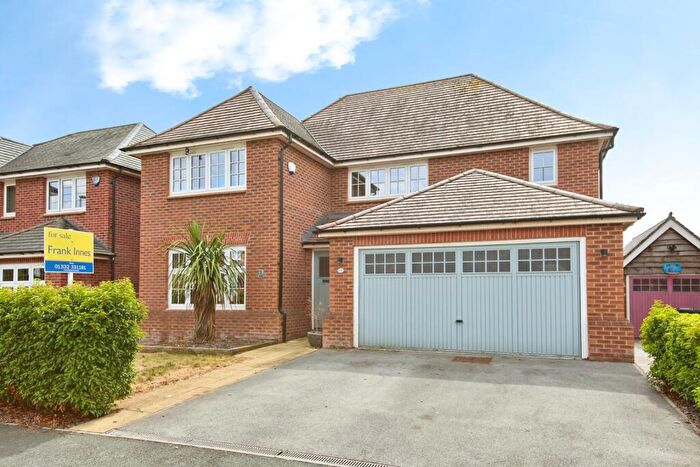
Properties for sale in Belper
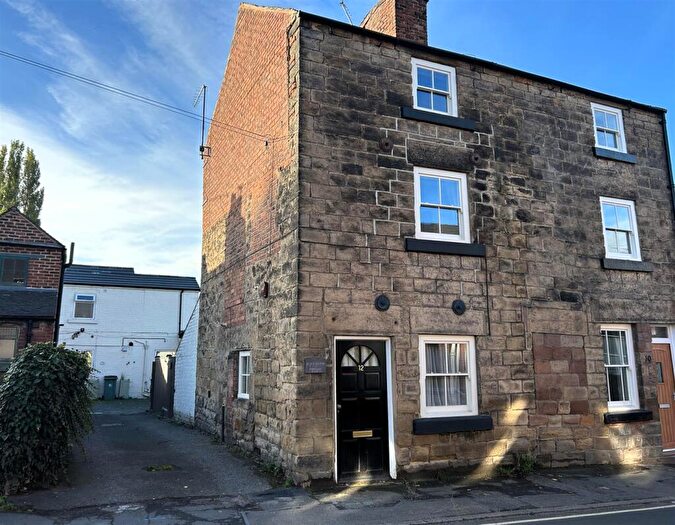
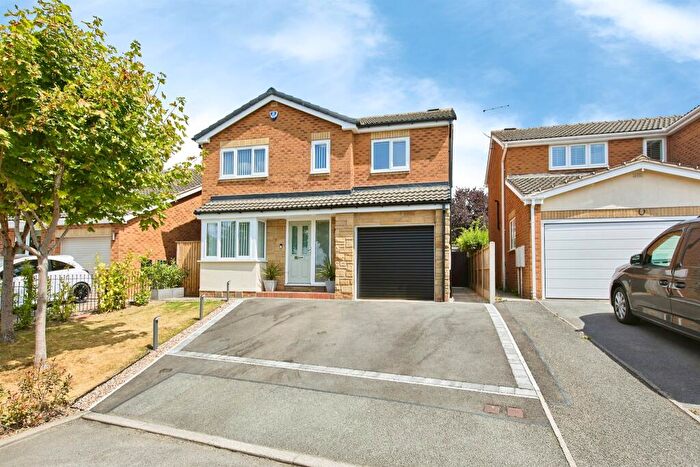
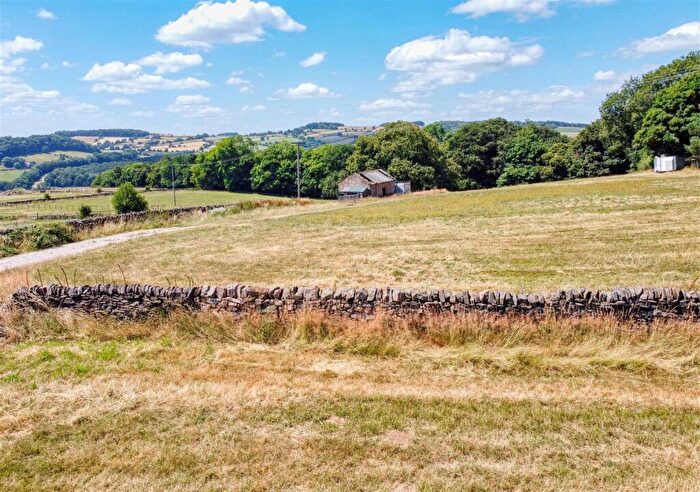
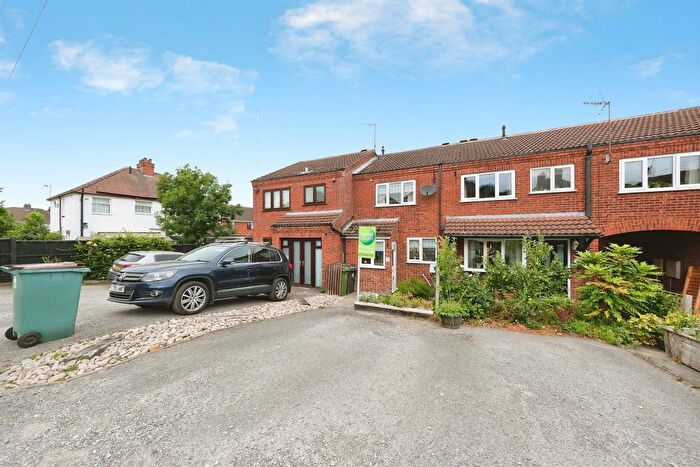
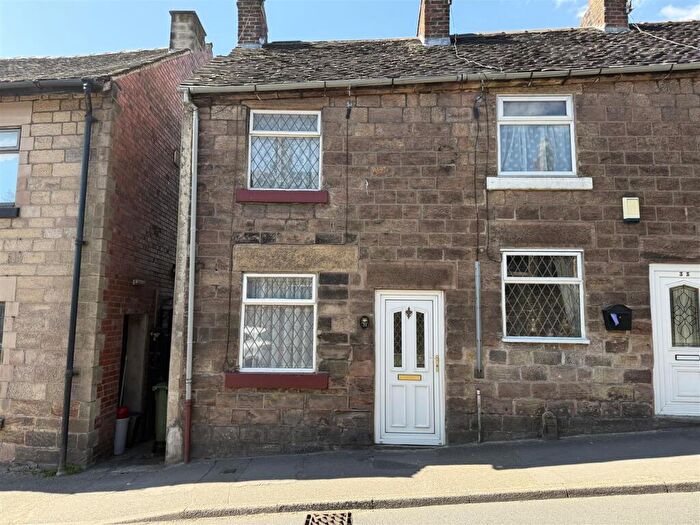
![]()
If you are looking to sell your house, let it out, or receive a property valuation, an expert can help you.
Click the button below to get started.


Neighbourhoods in Belper
Navigate through our locations to find the location of your next house in Belper, Derbyshire for sale or to rent.
Property price trends in Belper
According to the latest Land Registry data, the average home in Belper sold for £315,250 in 2026. That figure comes from a substantial record of 24,394 sales logged over the past 31 years.
Prices have moved up over the last three years. Compared with 2023, when the typical sale came in around £301,880, that's a rise of roughly 4.4%.
Looking back five years, average prices are up about 8.6% since 2021, a gain of around £24,939 in cash terms.
Zoom out to the past decade for the fuller picture. Back in 2016, homes here averaged £208,898, so the typical sold price has climbed about 50.9% since then, roughly 4.2% a year. Stretch the view to fifteen years and that annual pace eases back to about 3.5%.
Frequently asked questions about Belper
What is the average price for a property for sale in Belper?
The average price for a property for sale in Belper is £306,041. This amount is 21% higher than the average price in Derbyshire. There are more than 10,000 property listings for sale in Belper.
What locations have the most expensive properties for sale in Belper?
The locations with the most expensive properties for sale in Belper are Alport at an average of £649,524, South West Parishes at an average of £612,093 and Duffield at an average of £503,246.
What locations have the most affordable properties for sale in Belper?
The locations with the most affordable properties for sale in Belper are Belper Central at an average of £244,393, Belper South at an average of £246,950 and Kilburn, Denby And Holbrook at an average of £251,055.
Which train stations are available in or near Belper?
Some of the train stations available in or near Belper are Belper, Duffield and Ambergate.
Property Price Paid in Belper by Year
The average sold property price by year was:
| Year | Average Sold Price | Price Change |
Sold Properties
|
|---|---|---|---|
| 2026 | £315,250 | 4% |
30 Properties |
| 2025 | £301,529 | -4% |
550 Properties |
| 2024 | £313,901 | 4% |
568 Properties |
| 2023 | £301,880 | -2% |
543 Properties |
| 2022 | £306,654 | 5% |
680 Properties |
| 2021 | £290,311 | 5% |
858 Properties |
| 2020 | £277,141 | 10% |
645 Properties |
| 2019 | £250,217 | 4% |
707 Properties |
| 2018 | £240,465 | 4% |
771 Properties |
| 2017 | £230,416 | 9% |
760 Properties |
Property Price per Property Type in Belper
Here you can find historic sold price data in order to help with your property search.
The average Property Paid Price for specific property types in the last three years are:
| Property Type | Average Sold Price | Sold Properties |
|---|---|---|
| Semi Detached House | £260,252.00 | 515 Semi Detached Houses |
| Detached House | £436,140.00 | 628 Detached Houses |
| Terraced House | £207,735.00 | 447 Terraced Houses |
| Flat | £165,658.00 | 101 Flats |
Transport in Belper
Please see below transportation links in this area:
