Houses for sale & to rent in Belper South, Belper
House Prices in Belper South
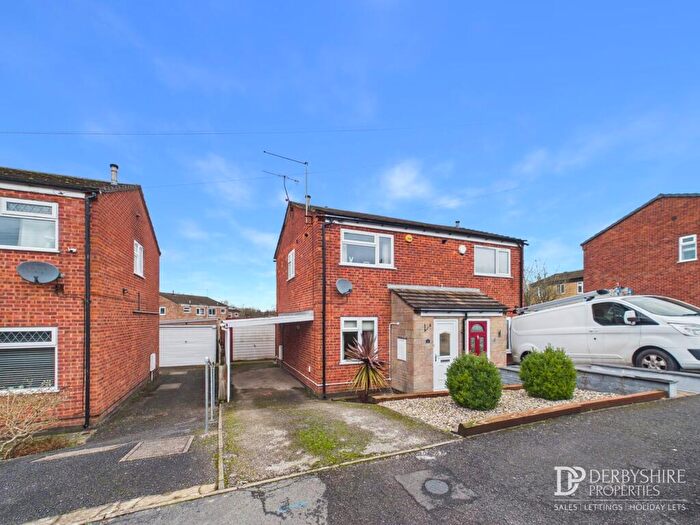
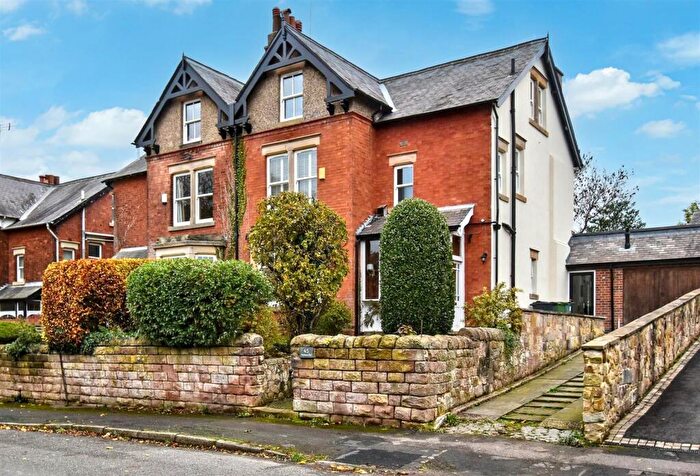
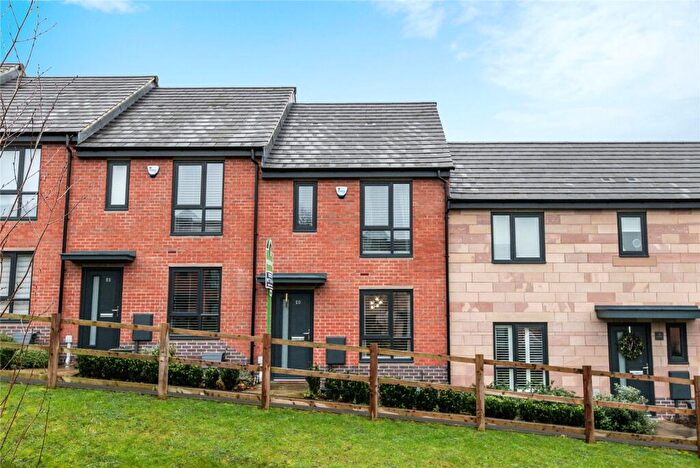
Properties in Belper South have an average house price of £249,425.00 and had 242 Property Transactions within the last 3 years¹.
Belper South is an area in Belper, Derbyshire with 2,461 households², where the most expensive property was sold for £2,760,000.00.
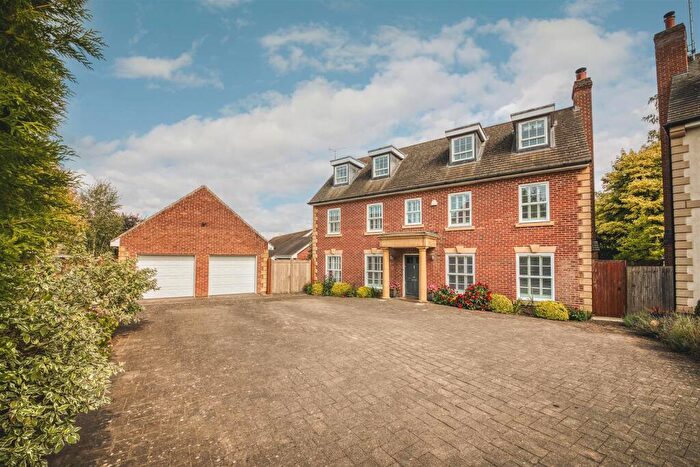
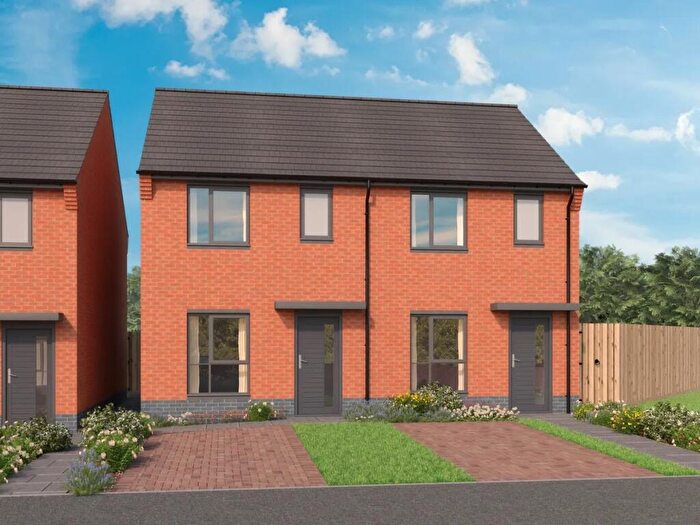
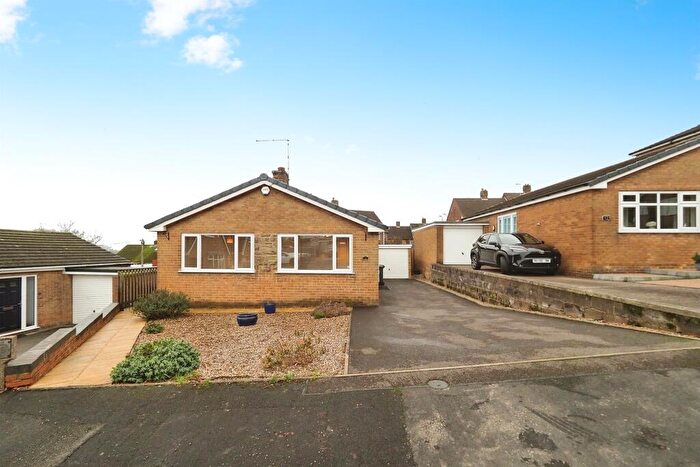
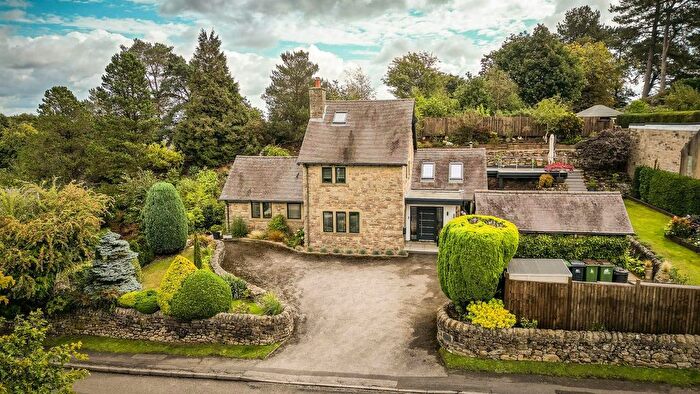
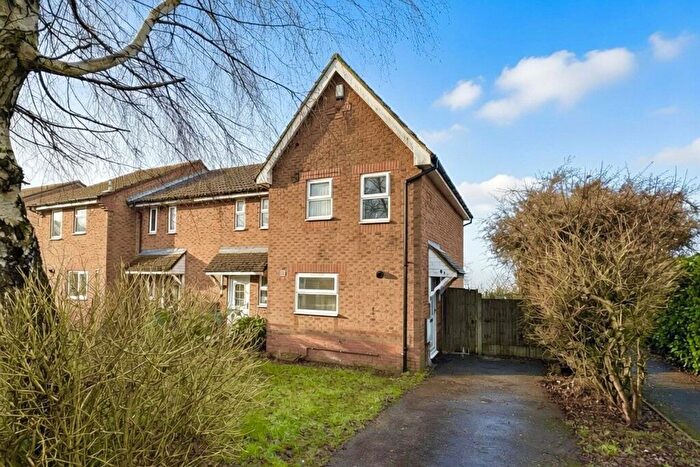
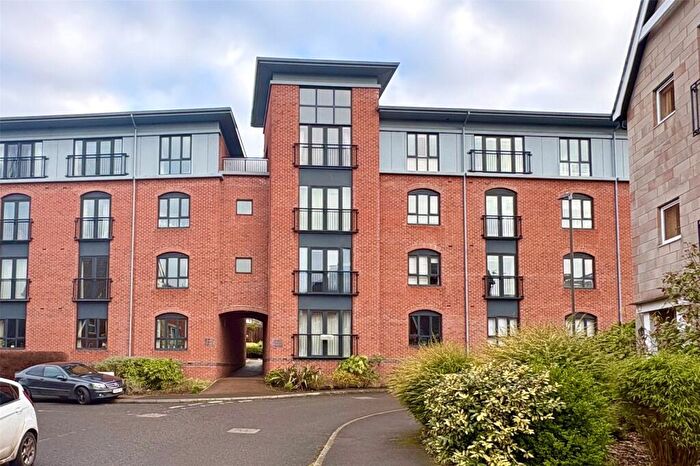
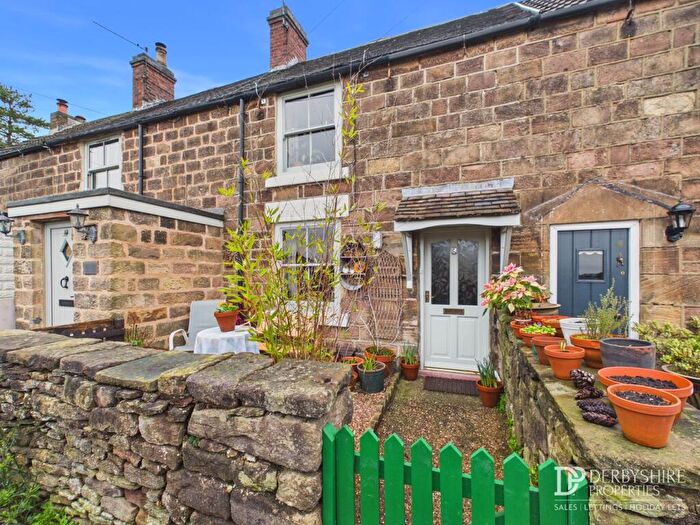
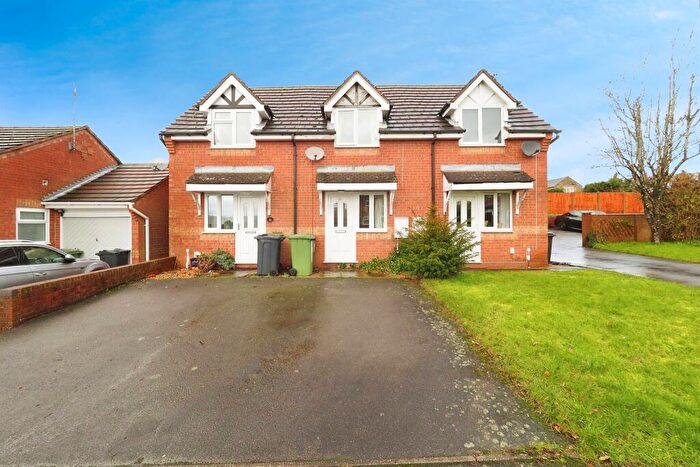
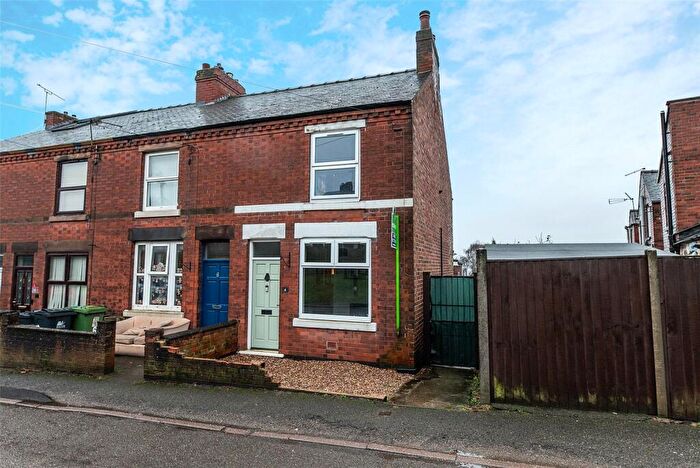
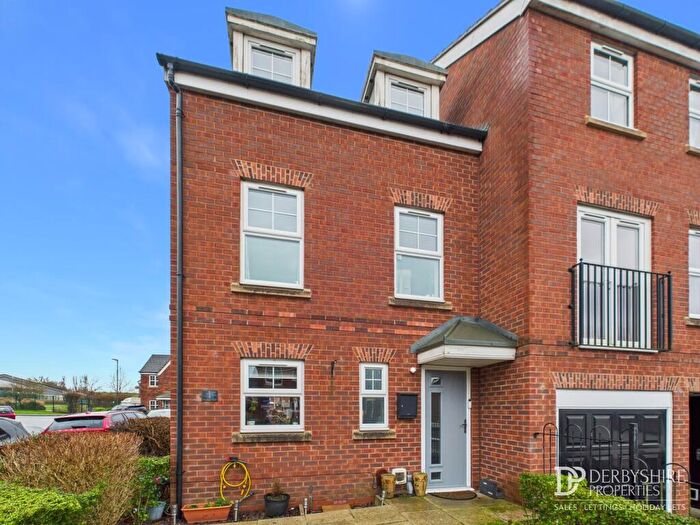
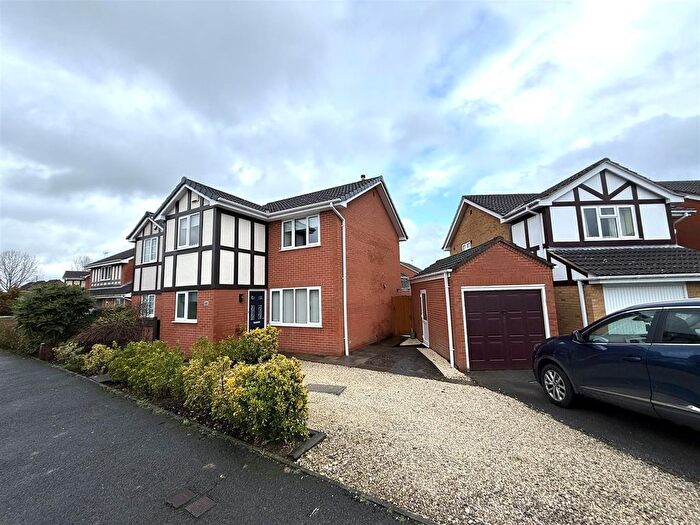
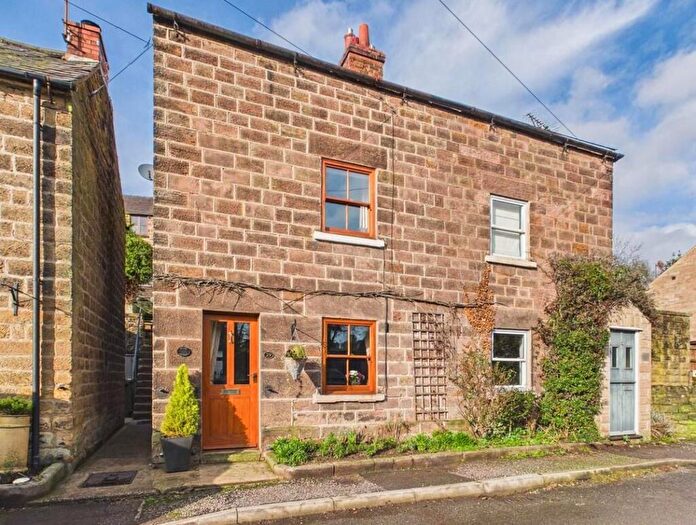
Properties for sale in Belper South
Roads and Postcodes in Belper South
Navigate through our locations to find the location of your next house in Belper South, Belper for sale or to rent.
| Streets | Postcodes |
|---|---|
| Acacia Croft | DE56 1SN |
| Alder Road | DE56 1LP |
| Ash Fields | DE56 1LF |
| Bank Buildings | DE56 0QJ |
| Bargate Close | DE56 0TL |
| Bargate Road | DE56 1NE DE56 1NF DE56 1ST |
| Barley Croft | DE56 1RR |
| Becksitch Lane | DE56 1UZ |
| Beech Close | DE56 1LQ |
| Bell Acre Close | DE56 1SS |
| Belrope Acre | DE56 1SR |
| Birch View Close | DE56 1RS |
| Blackberry Rise | DE56 0QT |
| Bridge View | DE56 0RG |
| Brooke Close | DE56 1SY |
| Bullfinch Close | DE56 1RA |
| Canada Street | DE56 1PF |
| Cedar Grove | DE56 1LS |
| Chestnut Avenue | DE56 1LW DE56 1LY |
| Chevin Alley | DE56 0QE |
| Chevin Mews | DE56 1PQ |
| Chevin Road | DE56 0QH DE56 2UN DE56 2US |
| Clan Drive | DE56 1RB |
| Dark Lane | DE56 0UU |
| Derby Road | DE56 0RA DE56 0RP DE56 1AB DE56 1UU DE56 1UX DE56 0QW DE56 1SW DE56 1WH DE56 1WJ DE56 1WL |
| Derwent Avenue | DE56 0RB |
| Derwent Vale | DE56 1UW |
| Derwentside Drive | DE56 1RD |
| Dukes Buildings | DE56 0RQ |
| Eagle Close | DE56 1UG |
| East Terrace | DE56 0RF |
| Elm Avenue | DE56 1NB |
| Fleet Crescent | DE56 1NX |
| Fleet Park | DE56 1PJ |
| Foundry Lane | DE56 0RN |
| Fullers Close | DE56 0SA |
| Gibfield Lane | DE56 1WA |
| Glenview | DE56 1PE |
| Grangewood Drive | DE56 0RW |
| Haslam Place | DE56 0AG |
| High Wood Bank | DE56 0SP |
| Highfield Road | DE56 1NZ |
| Highwood Avenue | DE56 1SP |
| Hillside Rise | DE56 1NH |
| Hillside View | DE56 0QX |
| Holbrook Road | DE56 1PA DE56 1PB |
| Holly Bush Lane | DE56 0RX |
| Honeycroft Close | DE56 1RL |
| Hopping Hill | DE56 0RJ DE56 0RL |
| Jackson Lane | DE56 0QD |
| Jubilee Court | DE56 1NN |
| Kedleston Close | DE56 1TZ |
| Kiln Drive | DE56 1SE |
| Kirks Lane | DE56 1LJ |
| Ladywell Court | DE56 1LE |
| Leighton Way | DE56 1SU DE56 1SX |
| Lime Crescent | DE56 1NA |
| Little Fallows | DE56 0RY |
| Makeney | DE56 0RU |
| Makeney Road | DE56 0UH |
| Makeney Terrace | DE56 0RS |
| Manor Road | DE56 1NT |
| Maple Drive | DE56 1LR |
| Meadow View | DE56 1UT |
| Melbourne Close | DE56 1NG |
| Mill Lane | DE56 1LG DE56 1LH |
| Millbank Avenue | DE56 1QD |
| Milldale Court | DE56 1RP |
| Millers Way | DE56 0RZ DE56 0UL DE56 0UP DE56 0UQ |
| Moscow | DE56 0QG |
| Mount Pleasant | DE56 0QF |
| Mulberry Close | DE56 1RQ |
| Park Cottages | DE56 1ND |
| Park Road | DE56 1LN DE56 1LZ |
| Pennine Place | DE56 1SG |
| Prospect Drive | DE56 1UY |
| Quarry Road | DE56 1PR |
| Ravenoak Close | DE56 1NY |
| Red Lane | DE56 0RT |
| Redhill Court | DE56 1QE |
| River View | DE56 0QY |
| Rowan Court | DE56 1SJ |
| Sandbed Lane | DE56 0JA DE56 0SH DE56 0SJ DE56 0SL DE56 0SN |
| Shaw Lane | DE56 0RE DE56 0TJ |
| Shroggs Wood Crescent | DE56 1LT |
| Snowberry Avenue | DE56 1RE |
| South View | DE56 0RH |
| St Swithuns Court | DE56 1QH |
| Sunny Bank Gardens | DE56 1WD |
| Sunny Hill | DE56 0QR |
| Sunny Hill Gardens | DE56 0QZ |
| Sycamore Croft | DE56 1SL |
| The Avenue | DE56 1WB |
| The Bridge | DE56 0RR |
| The Croft | DE56 1SQ |
| The Fleet | DE56 1NU DE56 1NW |
| The Woodridge | DE56 0QA |
| Thornhill Avenue | DE56 1SH |
| Valley View | DE56 1PG |
| Vicarage Road | DE56 0RD |
| Walnut Road | DE56 1RG |
| Well Lane | DE56 0QQ |
| Wilders Lea Court | DE56 1QJ |
| Wildersley Road | DE56 1PD |
| Willow Grove | DE56 1LX |
| Wood Lane | DE56 0QS |
| DE56 0XP DE56 1AS DE56 1QN DE56 1RW DE56 1ZL DE56 2ZL DE56 9AH DE56 9DH DE56 9EQ DE56 9FF DE56 9FL DE56 9FN DE56 9FQ DE56 9FS DE56 9FU DE56 9FW DE56 9GF DE56 9GL DE56 9GN DE56 9GP DE56 9GQ |
Transport near Belper South
- FAQ
- Price Paid By Year
- Property Type Price
Frequently asked questions about Belper South
What is the average price for a property for sale in Belper South?
The average price for a property for sale in Belper South is £249,425. This amount is 18% lower than the average price in Belper. There are 1,949 property listings for sale in Belper South.
What streets have the most expensive properties for sale in Belper South?
The streets with the most expensive properties for sale in Belper South are Wildersley Road at an average of £2,760,000, Wood Lane at an average of £477,140 and Holly Bush Lane at an average of £455,000.
What streets have the most affordable properties for sale in Belper South?
The streets with the most affordable properties for sale in Belper South are Lime Crescent at an average of £108,250, Kedleston Close at an average of £130,447 and The Bridge at an average of £134,500.
Which train stations are available in or near Belper South?
Some of the train stations available in or near Belper South are Belper, Duffield and Ambergate.
Property Price Paid in Belper South by Year
The average sold property price by year was:
| Year | Average Sold Price | Price Change |
Sold Properties
|
|---|---|---|---|
| 2025 | £234,832 | -11% |
72 Properties |
| 2024 | £260,611 | 4% |
89 Properties |
| 2023 | £250,106 | 8% |
81 Properties |
| 2022 | £229,557 | -7% |
111 Properties |
| 2021 | £244,994 | 20% |
115 Properties |
| 2020 | £196,074 | - |
93 Properties |
| 2019 | £196,117 | -1% |
108 Properties |
| 2018 | £197,503 | 3% |
110 Properties |
| 2017 | £190,944 | 9% |
129 Properties |
| 2016 | £173,161 | -1% |
118 Properties |
| 2015 | £174,388 | 2% |
132 Properties |
| 2014 | £170,218 | 15% |
124 Properties |
| 2013 | £145,506 | 2% |
103 Properties |
| 2012 | £142,454 | -3% |
106 Properties |
| 2011 | £146,434 | -2% |
115 Properties |
| 2010 | £149,658 | 3% |
120 Properties |
| 2009 | £145,356 | -18% |
107 Properties |
| 2008 | £170,938 | -5% |
137 Properties |
| 2007 | £179,805 | 14% |
193 Properties |
| 2006 | £155,279 | 8% |
194 Properties |
| 2005 | £142,470 | 11% |
98 Properties |
| 2004 | £127,165 | 11% |
120 Properties |
| 2003 | £113,615 | 20% |
99 Properties |
| 2002 | £90,449 | 13% |
146 Properties |
| 2001 | £78,269 | 18% |
142 Properties |
| 2000 | £64,465 | 13% |
146 Properties |
| 1999 | £56,363 | 3% |
113 Properties |
| 1998 | £54,903 | 2% |
145 Properties |
| 1997 | £53,611 | 3% |
143 Properties |
| 1996 | £51,966 | 6% |
124 Properties |
| 1995 | £49,033 | - |
74 Properties |
Property Price per Property Type in Belper South
Here you can find historic sold price data in order to help with your property search.
The average Property Paid Price for specific property types in the last three years are:
| Property Type | Average Sold Price | Sold Properties |
|---|---|---|
| Semi Detached House | £251,668.00 | 74 Semi Detached Houses |
| Detached House | £379,420.00 | 44 Detached Houses |
| Terraced House | £225,779.00 | 90 Terraced Houses |
| Flat | £138,910.00 | 34 Flats |

