
Houses for sale in Buxton, Derbyshire
House Prices in Buxton
Properties in Buxton have an average house price of £283k and had 1,288 Property Transactions within the last 3 years.¹
Buxton is an area in Derbyshire with 13,121 households², where the most expensive property was sold for £1.8M.
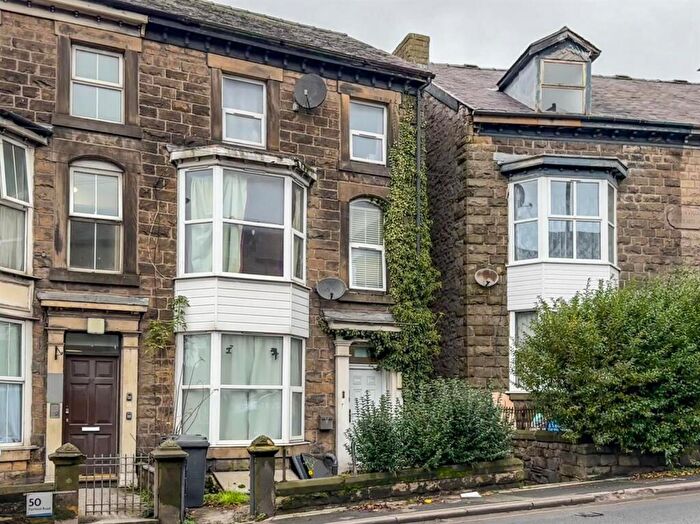
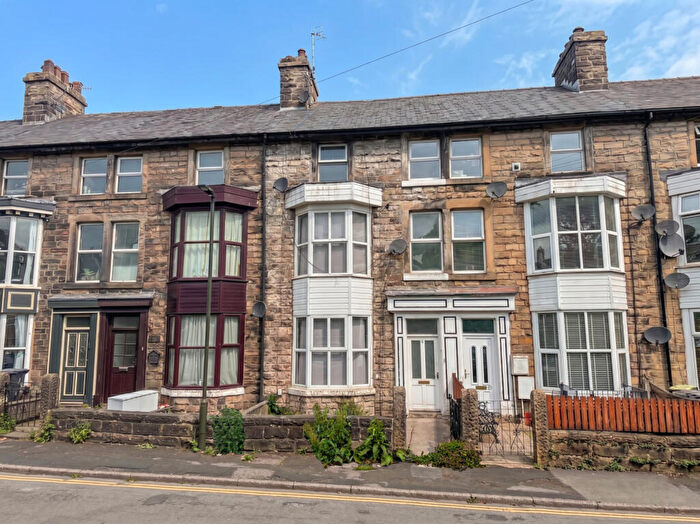
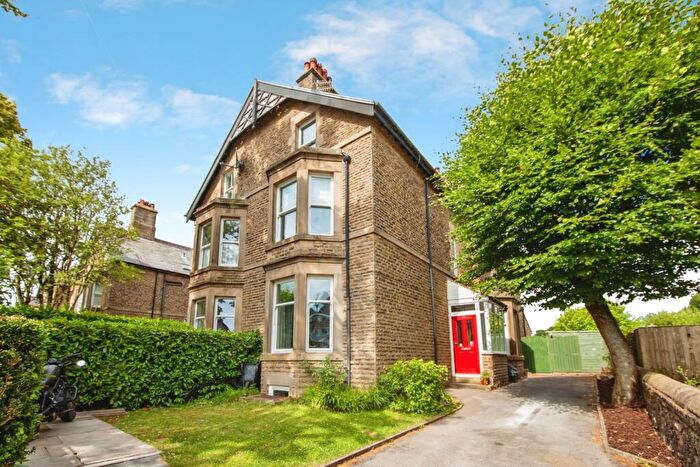
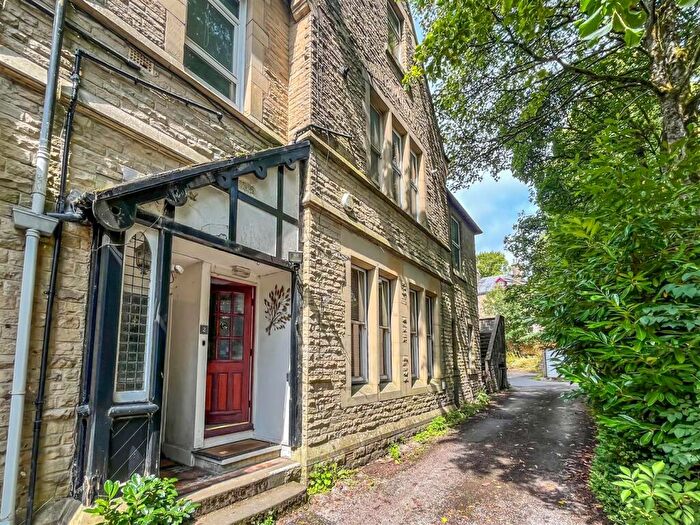
Properties for sale in Buxton
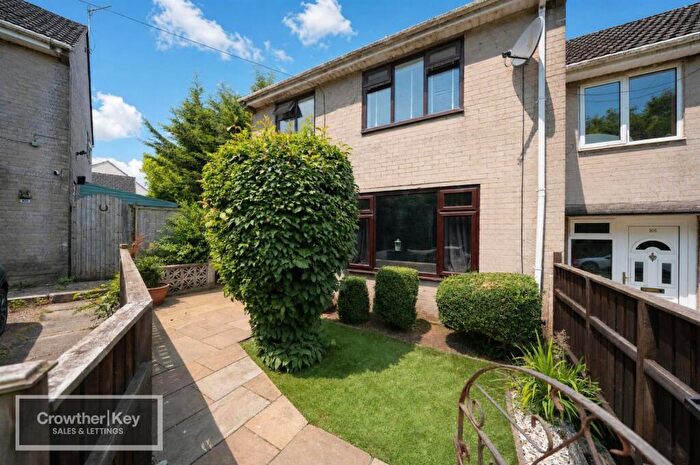
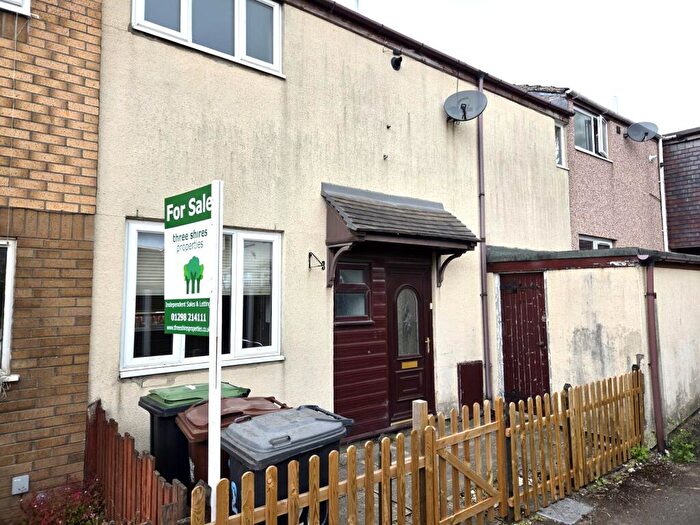
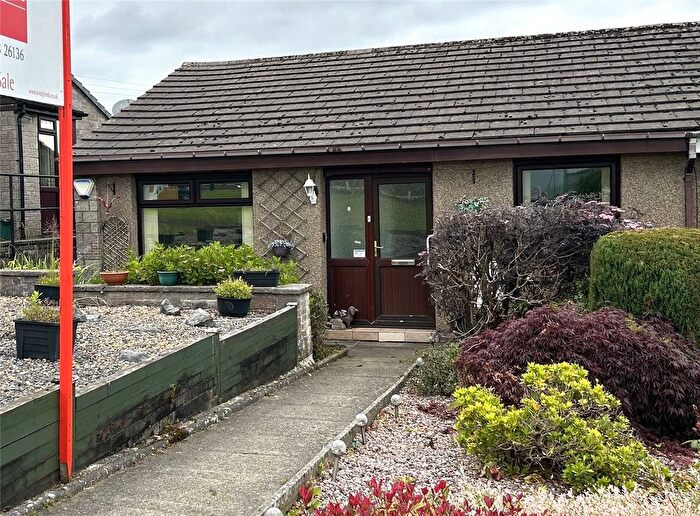
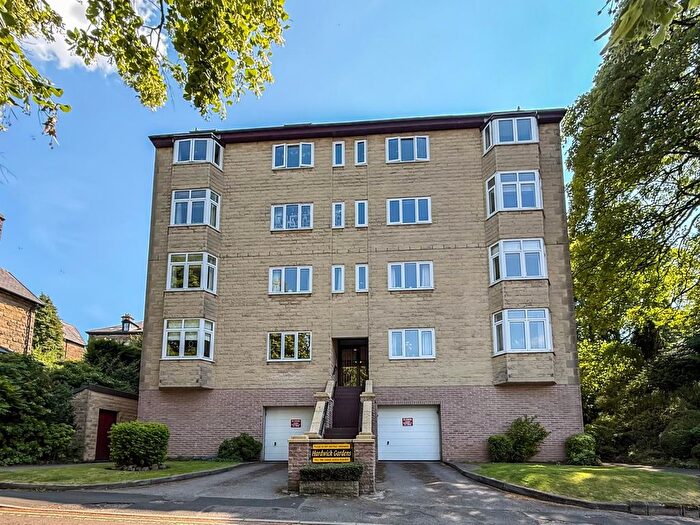
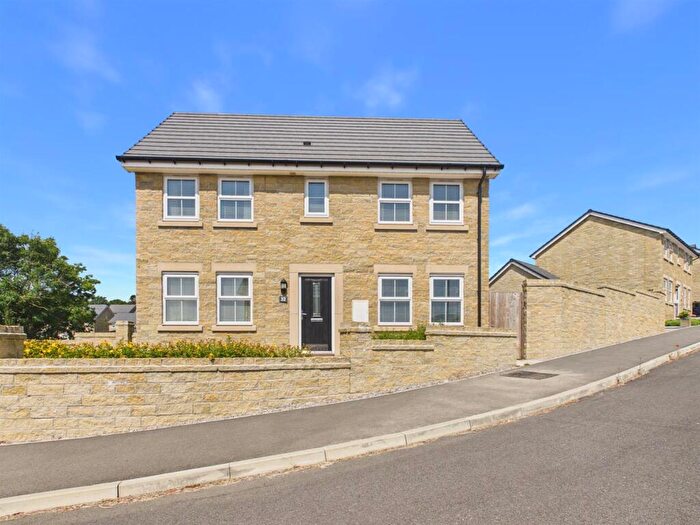
![]()
If you are looking to sell your house, let it out, or receive a property valuation, an expert can help you.
Click the button below to get started.


Neighbourhoods in Buxton
Navigate through our locations to find the location of your next house in Buxton, Derbyshire for sale or to rent.
Property price trends in Buxton
According to the latest Land Registry data, the average home in Buxton sold for £266,195 in 2026. That figure comes from a substantial record of 16,152 sales logged over the past 31 years.
Prices have softened over the last three years. Compared with 2023, when the typical sale came in around £277,727, that's a fall of roughly 4.2%.
Looking back five years, average prices are up about 7.5% since 2021, a gain of around £18,596 in cash terms.
Zoom out to the past decade for the fuller picture. Back in 2016, homes here averaged £208,056, so the typical sold price has climbed about 27.9% since then, roughly 2.5% a year. Stretch the view to fifteen years and that annual pace holds at about 2.4%.
Frequently asked questions about Buxton
What is the average price for a property for sale in Buxton?
The average price for a property for sale in Buxton is £282,931. This amount is 12% higher than the average price in Derbyshire. There are 5,550 property listings for sale in Buxton.
What locations have the most expensive properties for sale in Buxton?
The locations with the most expensive properties for sale in Buxton are Dovedale And Parwich at an average of £547,857, Bradwell at an average of £497,125 and Hartington And Taddington at an average of £433,010.
What locations have the most affordable properties for sale in Buxton?
The locations with the most affordable properties for sale in Buxton are Stone Bench at an average of £175,636, Barms at an average of £208,896 and Buxton Central at an average of £231,910.
Which train stations are available in or near Buxton?
Some of the train stations available in or near Buxton are Buxton, Dove Holes and Chapel-En-Le-Frith.
Property Price Paid in Buxton by Year
The average sold property price by year was:
| Year | Average Sold Price | Price Change |
Sold Properties
|
|---|---|---|---|
| 2026 | £266,195 | -8% |
33 Properties |
| 2025 | £288,273 | 1% |
405 Properties |
| 2024 | £284,208 | 2% |
434 Properties |
| 2023 | £277,727 | 4% |
416 Properties |
| 2022 | £267,362 | 7% |
551 Properties |
| 2021 | £247,599 | 1% |
678 Properties |
| 2020 | £246,124 | 13% |
449 Properties |
| 2019 | £214,197 | -4% |
528 Properties |
| 2018 | £221,807 | 6% |
472 Properties |
| 2017 | £208,941 | 0,4% |
508 Properties |
Property Price per Property Type in Buxton
Here you can find historic sold price data in order to help with your property search.
The average Property Paid Price for specific property types in the last three years are:
| Property Type | Average Sold Price | Sold Properties |
|---|---|---|
| Semi Detached House | £276,371.00 | 414 Semi Detached Houses |
| Detached House | £475,251.00 | 246 Detached Houses |
| Terraced House | £230,671.00 | 410 Terraced Houses |
| Flat | £176,656.00 | 218 Flats |
Transport in Buxton
Please see below transportation links in this area:
