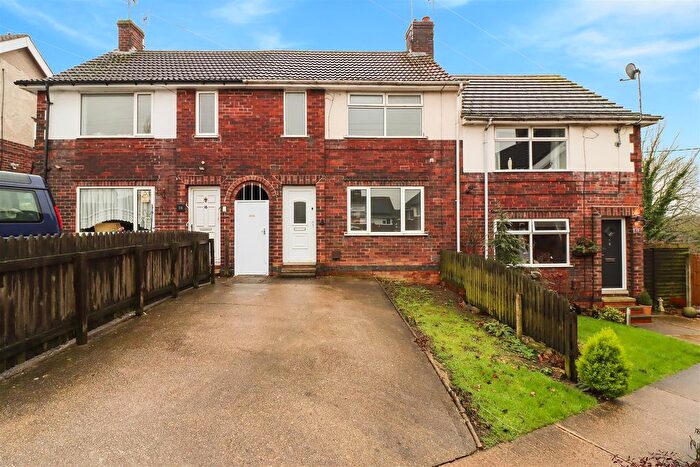
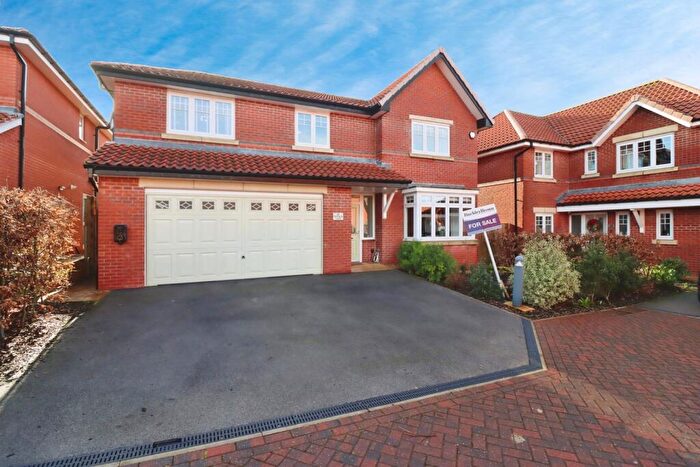
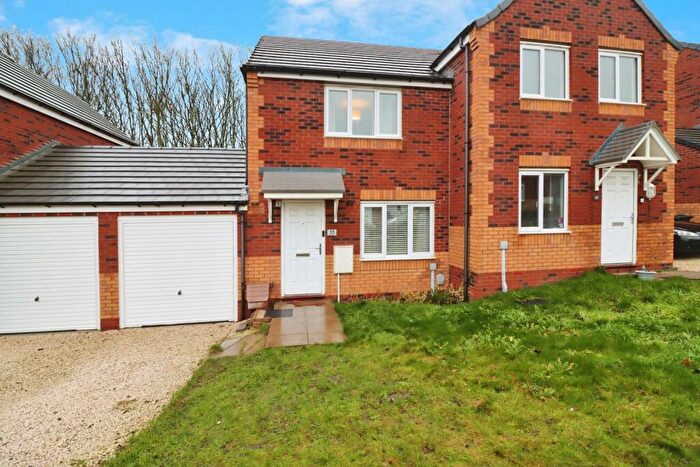
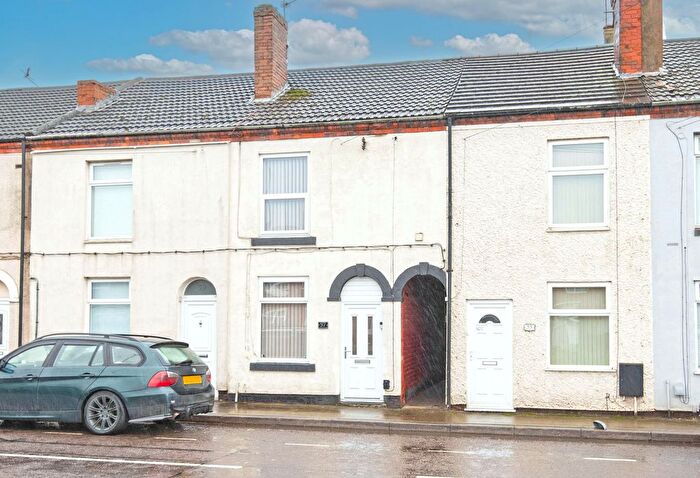
Houses for sale & to rent in Bolsover North West, Chesterfield
House Prices in Bolsover North West
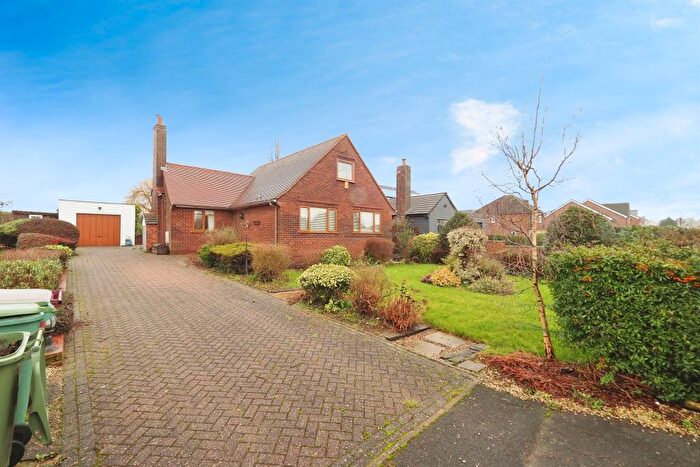
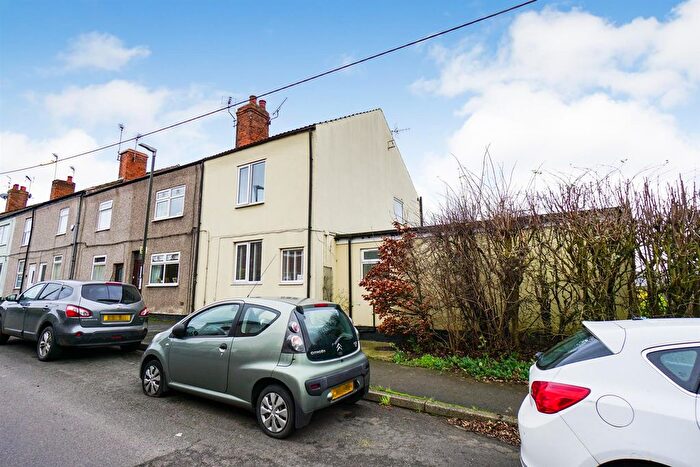
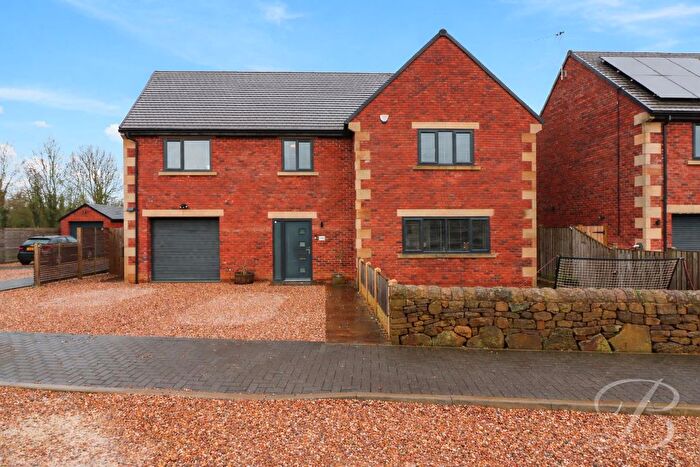
Properties in Bolsover North West have an average house price of £142,853.00 and had 187 Property Transactions within the last 3 years¹.
Bolsover North West is an area in Chesterfield, Derbyshire with 1,616 households², where the most expensive property was sold for £500,000.00.
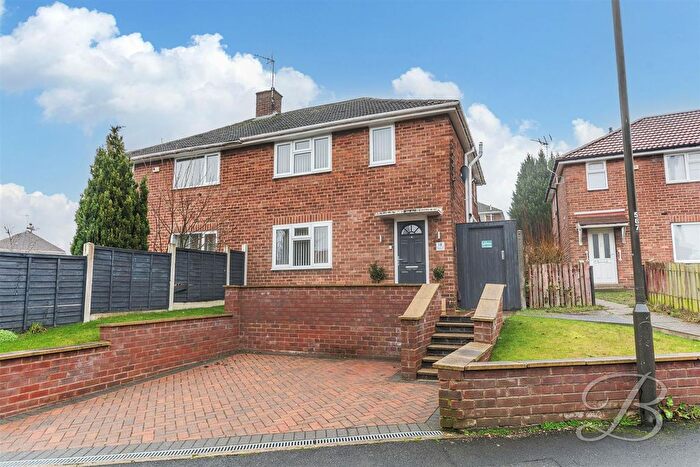
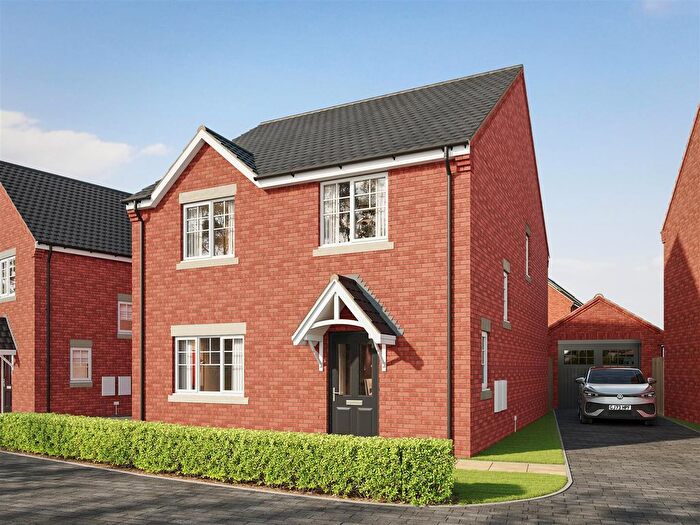
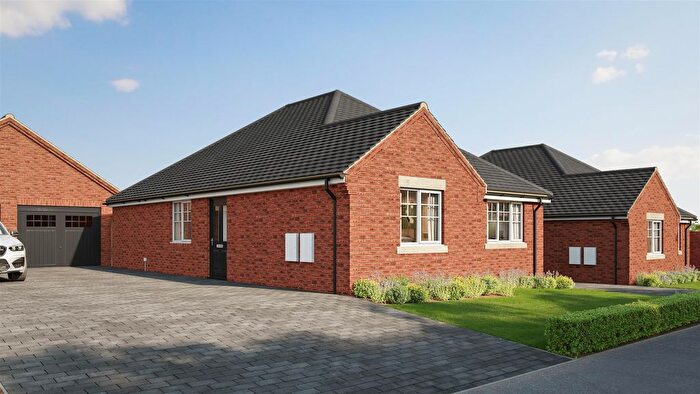
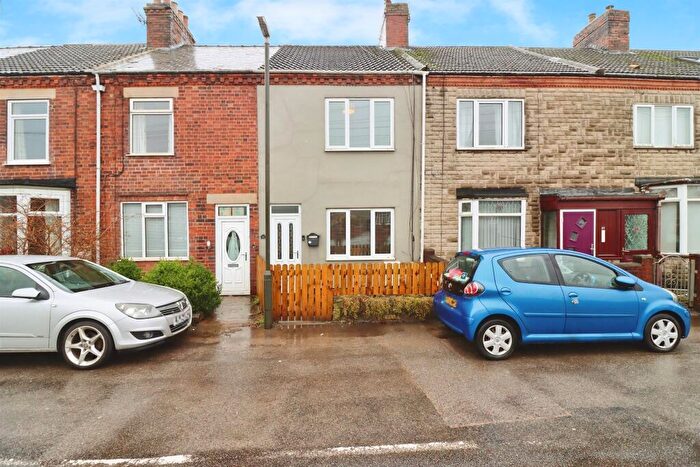
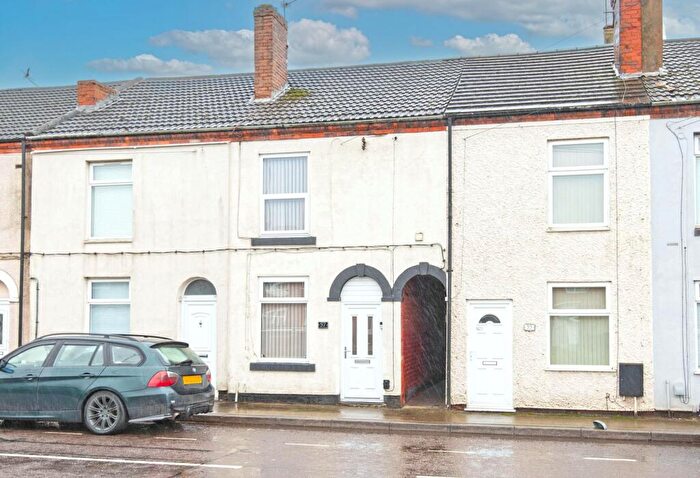
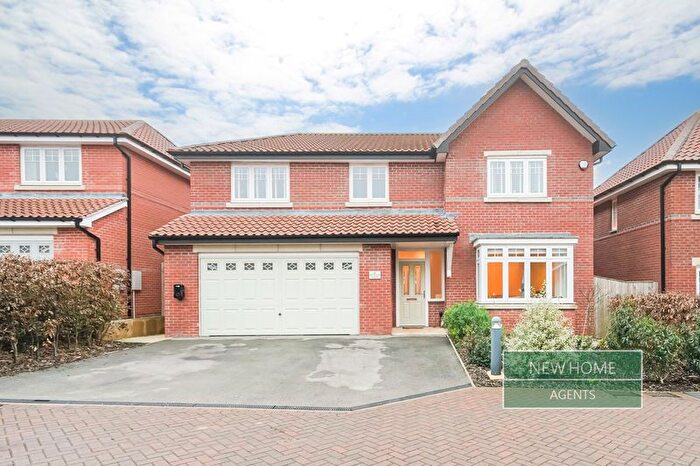
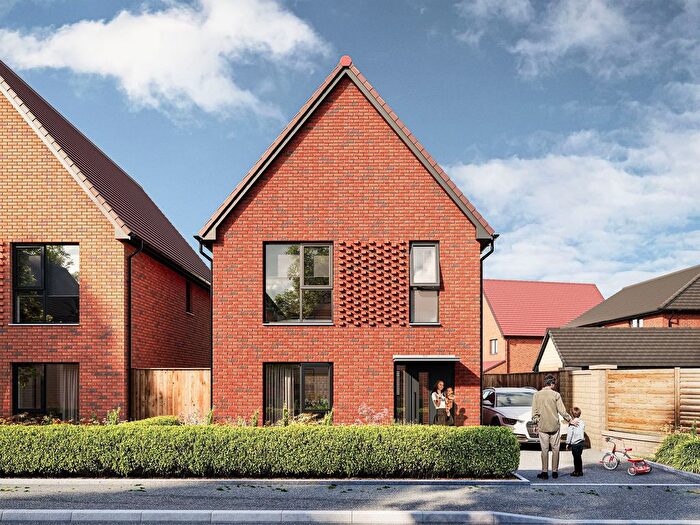
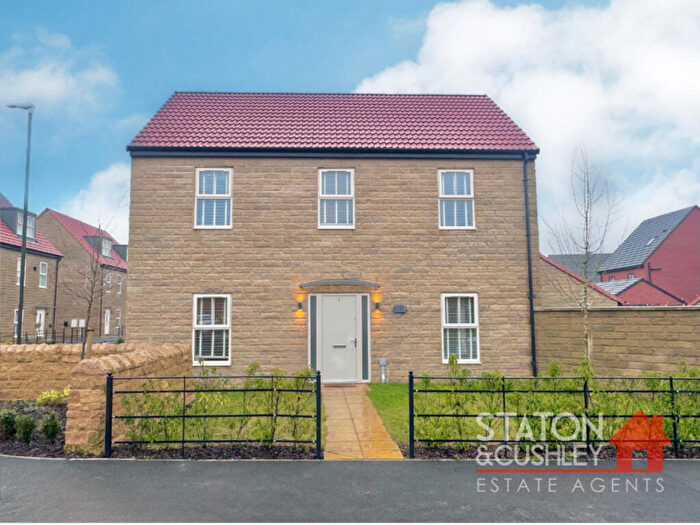
Properties for sale in Bolsover North West
Roads and Postcodes in Bolsover North West
Navigate through our locations to find the location of your next house in Bolsover North West, Chesterfield for sale or to rent.
| Streets | Postcodes |
|---|---|
| Adin Avenue | S44 6QU |
| Appletree Road | S44 6AJ |
| Bentinck Road | S44 6RG S44 6RQ |
| Blackbanks | S44 6FD S44 6GQ |
| Bluebank Lane | S44 6QJ |
| Bolsover Hill | S44 6BG |
| Bolsover Road | S44 6QX |
| Bridle Road | S44 6AP |
| Brockley Avenue | S44 6RB |
| Castle Street | S44 6PP |
| Chesterfield Road | S44 6QL S44 6QN S44 6QS S44 6QT |
| Church Road | S44 6AQ |
| Church Street | S44 6HB |
| Clowne Road | S44 6AF S44 6AG S44 6AR S44 6AW |
| Craggs Road | S44 6BQ S44 6NL |
| Crossfield Villas | S44 6QP |
| Cundy Road | S44 6NW S44 6RR |
| Davey Court | S44 6RS |
| Deepdale Road | S44 6BY |
| East Avenue | S44 6AH |
| Ellesmere Villas | S44 6QR |
| Farmfields Close | S44 6BX |
| Featherbed Close | S44 6FG |
| Field View | S44 6FL |
| Haldane Crescent | S44 6RU |
| Harvey Court | S44 6SJ |
| Haslam Court | S44 6SL |
| Hill Top | S44 6XW |
| Houfton Crescent | S44 6BP |
| Houfton Road | S44 6BW S44 6RP S44 6SG S44 6SH |
| Houldsworth Crescent | S44 6SQ |
| Hyndley Road | S44 6RT S44 6RX |
| Iron Cliff Road | S44 6SB |
| Kestrel Close | S44 6QH |
| Kingfisher Court | S44 6QG |
| Manor Close | S44 6DA |
| Manor Court Road | S44 6SD |
| Merlin Avenue | S44 6QF |
| Mill Lane | S44 6NR |
| Mill Walk | S44 6NY |
| Nether Springs Road | S44 6SA |
| Norton Avenue | S44 6RA |
| Nursery Drive | S44 6SW |
| Oxcroft | S44 6AS S44 6AT |
| Oxcroft Lane | S44 6AU |
| Oxcroft View | S44 6AA |
| Peveril Road | S44 6RZ |
| Pretoria Street | S44 6QQ |
| Shuttlewood Road | S44 6NU S44 6NX S44 6PA S44 6PB |
| Springfield Crescent | S44 6RY |
| Station Road | S44 6BE S44 6BH |
| Thornfield Villas | S44 6QW |
| Vivian Street | S44 6QY |
| Woodhouse Lane | S44 6BJ S44 6BL |
| Woodthorpe Close | S44 6RE |
| Woodthorpe Road | S44 6RD S44 6RF |
Transport near Bolsover North West
- FAQ
- Price Paid By Year
- Property Type Price
Frequently asked questions about Bolsover North West
What is the average price for a property for sale in Bolsover North West?
The average price for a property for sale in Bolsover North West is £142,853. This amount is 33% lower than the average price in Chesterfield. There are 921 property listings for sale in Bolsover North West.
What streets have the most expensive properties for sale in Bolsover North West?
The streets with the most expensive properties for sale in Bolsover North West are Oxcroft at an average of £500,000, Oxcroft Lane at an average of £329,000 and Norton Avenue at an average of £266,000.
What streets have the most affordable properties for sale in Bolsover North West?
The streets with the most affordable properties for sale in Bolsover North West are Harvey Court at an average of £88,045, Haldane Crescent at an average of £94,812 and Vivian Street at an average of £95,983.
Which train stations are available in or near Bolsover North West?
Some of the train stations available in or near Bolsover North West are Creswell (Derbys), Langwith and Whitwell (Derbys).
Property Price Paid in Bolsover North West by Year
The average sold property price by year was:
| Year | Average Sold Price | Price Change |
Sold Properties
|
|---|---|---|---|
| 2025 | £148,789 | - |
49 Properties |
| 2024 | £148,744 | 11% |
71 Properties |
| 2023 | £132,269 | -19% |
67 Properties |
| 2022 | £157,659 | 6% |
69 Properties |
| 2021 | £148,612 | 14% |
94 Properties |
| 2020 | £127,764 | 11% |
58 Properties |
| 2019 | £113,853 | -7% |
65 Properties |
| 2018 | £121,258 | 2% |
55 Properties |
| 2017 | £118,901 | 6% |
65 Properties |
| 2016 | £111,268 | 24% |
90 Properties |
| 2015 | £84,776 | -17% |
95 Properties |
| 2014 | £99,298 | 13% |
66 Properties |
| 2013 | £86,561 | -28% |
44 Properties |
| 2012 | £110,919 | 21% |
31 Properties |
| 2011 | £88,116 | -8% |
25 Properties |
| 2010 | £95,232 | -22% |
31 Properties |
| 2009 | £116,331 | -8% |
49 Properties |
| 2008 | £125,520 | 3% |
54 Properties |
| 2007 | £121,242 | -8% |
80 Properties |
| 2006 | £130,429 | 7% |
91 Properties |
| 2005 | £121,393 | 28% |
81 Properties |
| 2004 | £86,872 | 15% |
99 Properties |
| 2003 | £73,863 | 32% |
143 Properties |
| 2002 | £50,220 | 18% |
115 Properties |
| 2001 | £41,390 | 6% |
88 Properties |
| 2000 | £38,901 | 26% |
70 Properties |
| 1999 | £28,808 | -10% |
42 Properties |
| 1998 | £31,701 | 9% |
54 Properties |
| 1997 | £28,699 | 4% |
40 Properties |
| 1996 | £27,611 | -20% |
46 Properties |
| 1995 | £33,201 | - |
37 Properties |
Property Price per Property Type in Bolsover North West
Here you can find historic sold price data in order to help with your property search.
The average Property Paid Price for specific property types in the last three years are:
| Property Type | Average Sold Price | Sold Properties |
|---|---|---|
| Semi Detached House | £136,912.00 | 83 Semi Detached Houses |
| Detached House | £266,356.00 | 25 Detached Houses |
| Terraced House | £110,012.00 | 79 Terraced Houses |

