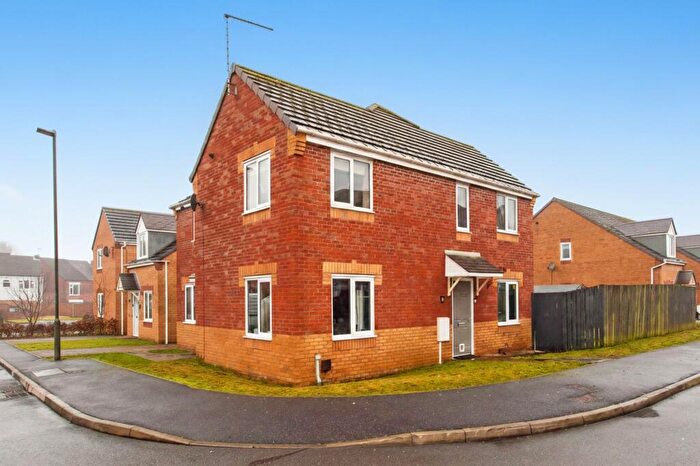
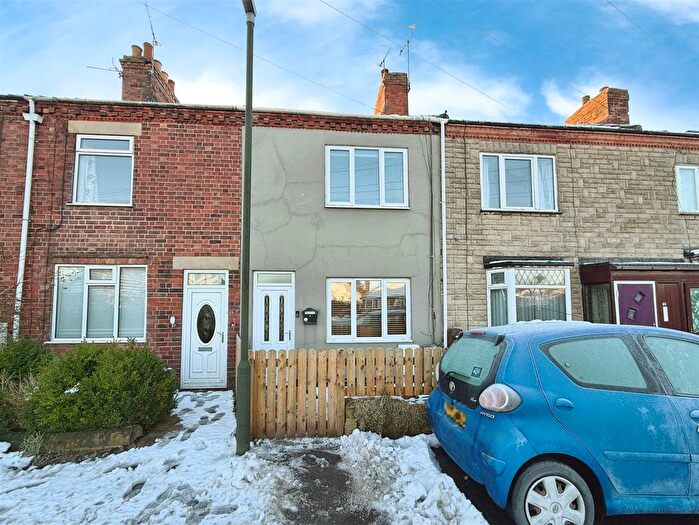
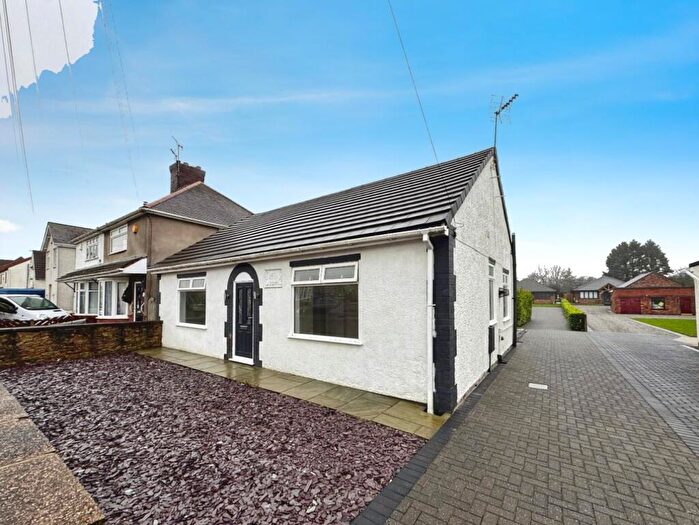
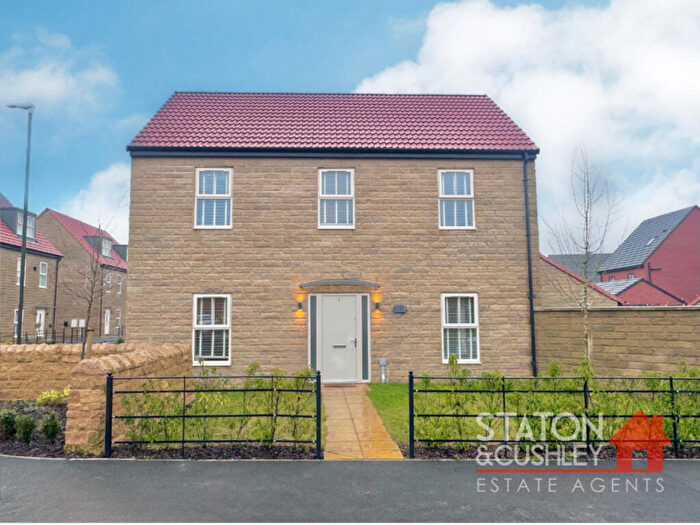
Houses for sale & to rent in Bolsover South, Chesterfield
House Prices in Bolsover South
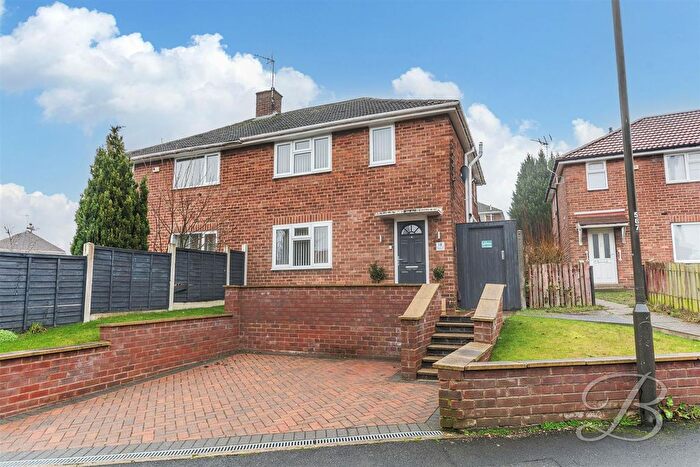
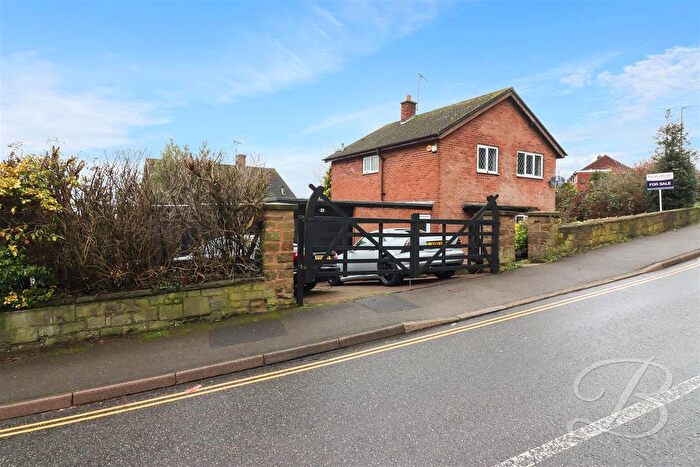
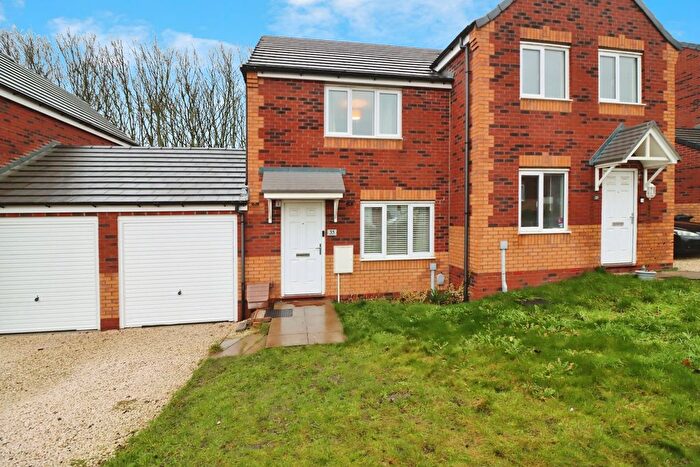
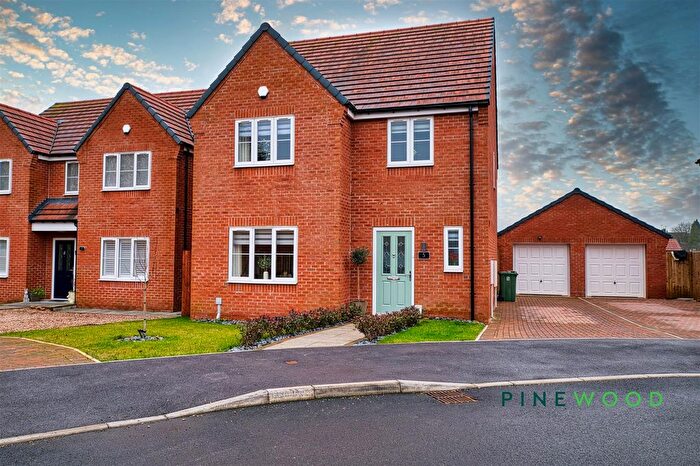
Properties in Bolsover South have an average house price of £177,272.00 and had 148 Property Transactions within the last 3 years¹.
Bolsover South is an area in Chesterfield, Derbyshire with 1,554 households², where the most expensive property was sold for £435,000.00.
Properties for sale in Bolsover South
Roads and Postcodes in Bolsover South
Navigate through our locations to find the location of your next house in Bolsover South, Chesterfield for sale or to rent.
| Streets | Postcodes |
|---|---|
| Bank Close | S44 6NE |
| Beck Close | S44 6XS |
| Bretton Avenue | S44 6XN |
| Carr Lane | S44 6UU |
| Carr Vale Road | S44 6JD |
| Castle Industrial Estate Road | S44 6BN |
| Cavendish Road | S44 6HN |
| Cedar Park Drive | S44 6XP |
| Charlesworth Gardens | S44 6JT |
| Chatsworth Close | S44 6XJ |
| Cherry Tree Close | S44 6ET |
| Cornmill Close | S44 6XL |
| Darwood Lane | S44 6LD |
| Dykes Close | S44 6PF |
| Elm Close | S44 6EA |
| Hill Top | S44 6NG S44 6NJ S44 6NN |
| Holbeck Avenue | S44 6XT |
| Horsehead Lane | S44 6HU S44 6XH |
| Huntingdon Avenue | S44 6EE |
| Laburnum Close | S44 6EU |
| Langstone Avenue | S44 6ES |
| Langwith Road | S44 6HP S44 6HW |
| Lilac Grove | S44 6EX |
| Limekiln Fields | S44 6NQ S44 6NS |
| Longlands | S44 6DL |
| Market Place | S44 6PH |
| Meadowlands | S44 6XR |
| Mill Lane | S44 6NP |
| Millrise | S44 6FP |
| Moor Lane | S44 6EB S44 6EP S44 6EW |
| Mooracre Lane | S44 6ER S44 6XA |
| Moorfield Avenue | S44 6EJ S44 6EL |
| Moorfield Square | S44 6EN |
| New Station Road | S44 6PY |
| New Street | S44 6NH |
| North View Street | S44 6JA |
| Orchard View | S44 6JU |
| Oxcroft Lane | S44 6AX S44 6DJ S44 6DW |
| Park View Close | S44 6FN |
| Peveril Place | S44 6NZ |
| Portland Avenue | S44 6EF S44 6EQ |
| Quarry Road | S44 6NT |
| Redacre Close | S44 6XU |
| Ridgeway Avenue | S44 6XQ |
| Riverside Way | S44 6GA |
| Sandhills Road | S44 6EY |
| Sherwood Street | S44 6FQ S44 6GF |
| St Lawrence Avenue | S44 6HS S44 6HT |
| Stables Court | S44 6HX |
| Steel Lane | S44 6DU |
| Stratton Road | S44 6DR |
| Sycamore Close | S44 6DZ |
| Town End | S44 6DT |
| Valley View | S44 6NB |
| Welbeck Gardens | S44 6XX |
| Welbeck Road | S44 6DE S44 6DF S44 6DH S44 6XF |
| Welbeck Villas | S44 6DG |
| Windmill Close | S44 6ND |
Transport near Bolsover South
- FAQ
- Price Paid By Year
- Property Type Price
Frequently asked questions about Bolsover South
What is the average price for a property for sale in Bolsover South?
The average price for a property for sale in Bolsover South is £177,272. This amount is 17% lower than the average price in Chesterfield. There are 963 property listings for sale in Bolsover South.
What streets have the most expensive properties for sale in Bolsover South?
The streets with the most expensive properties for sale in Bolsover South are Chatsworth Close at an average of £350,000, Beck Close at an average of £327,500 and Windmill Close at an average of £282,500.
What streets have the most affordable properties for sale in Bolsover South?
The streets with the most affordable properties for sale in Bolsover South are New Street at an average of £90,283, Peveril Place at an average of £102,500 and Cavendish Road at an average of £131,875.
Which train stations are available in or near Bolsover South?
Some of the train stations available in or near Bolsover South are Langwith, Creswell (Derbys) and Shirebrook (Derbys).
Property Price Paid in Bolsover South by Year
The average sold property price by year was:
| Year | Average Sold Price | Price Change |
Sold Properties
|
|---|---|---|---|
| 2025 | £185,015 | 7% |
44 Properties |
| 2024 | £171,382 | -3% |
43 Properties |
| 2023 | £175,838 | -7% |
61 Properties |
| 2022 | £188,564 | 12% |
57 Properties |
| 2021 | £165,005 | 10% |
69 Properties |
| 2020 | £149,210 | -4% |
57 Properties |
| 2019 | £155,843 | 10% |
66 Properties |
| 2018 | £140,695 | -6% |
76 Properties |
| 2017 | £148,564 | 12% |
51 Properties |
| 2016 | £131,067 | 5% |
72 Properties |
| 2015 | £123,861 | 2% |
48 Properties |
| 2014 | £121,342 | 13% |
56 Properties |
| 2013 | £105,004 | -23% |
47 Properties |
| 2012 | £129,114 | 9% |
58 Properties |
| 2011 | £117,088 | -6% |
33 Properties |
| 2010 | £124,433 | 5% |
39 Properties |
| 2009 | £117,879 | 7% |
50 Properties |
| 2008 | £109,300 | -21% |
26 Properties |
| 2007 | £132,530 | 0,4% |
69 Properties |
| 2006 | £132,058 | 5% |
85 Properties |
| 2005 | £125,835 | 8% |
51 Properties |
| 2004 | £115,256 | 28% |
82 Properties |
| 2003 | £82,826 | 26% |
80 Properties |
| 2002 | £61,614 | 14% |
80 Properties |
| 2001 | £52,799 | 15% |
91 Properties |
| 2000 | £44,741 | -0,3% |
52 Properties |
| 1999 | £44,874 | 7% |
86 Properties |
| 1998 | £41,796 | -4% |
47 Properties |
| 1997 | £43,606 | -2% |
69 Properties |
| 1996 | £44,492 | -21% |
94 Properties |
| 1995 | £53,843 | - |
108 Properties |
Property Price per Property Type in Bolsover South
Here you can find historic sold price data in order to help with your property search.
The average Property Paid Price for specific property types in the last three years are:
| Property Type | Average Sold Price | Sold Properties |
|---|---|---|
| Semi Detached House | £165,171.00 | 64 Semi Detached Houses |
| Detached House | £253,388.00 | 36 Detached Houses |
| Terraced House | £138,060.00 | 46 Terraced Houses |
| Flat | £96,250.00 | 2 Flats |

