
Houses for sale & to rent in Clowne North, Chesterfield
House Prices in Clowne North
Properties in Clowne North have an average house price of £141k and had 181 Property Transactions within the last 3 years¹.
Clowne North is an area in Chesterfield, Derbyshire with 1,720 households², where the most expensive property was sold for £385k.
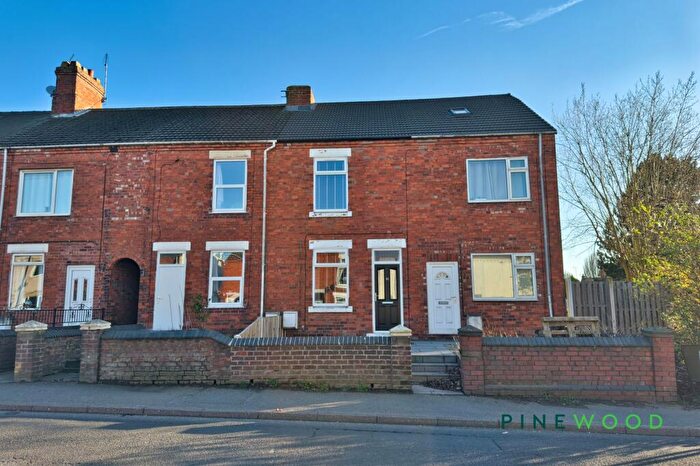
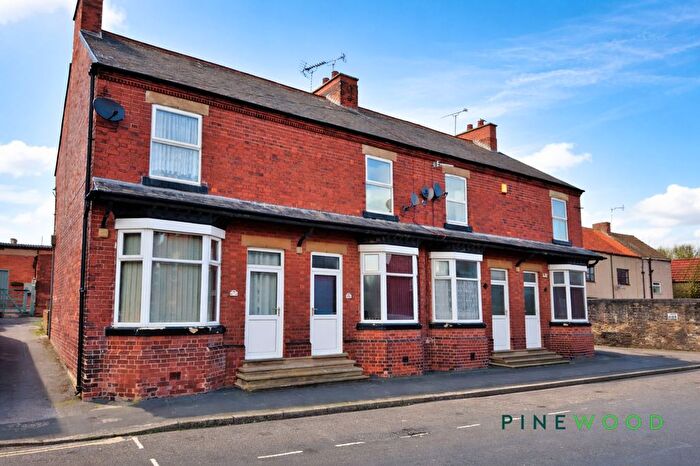
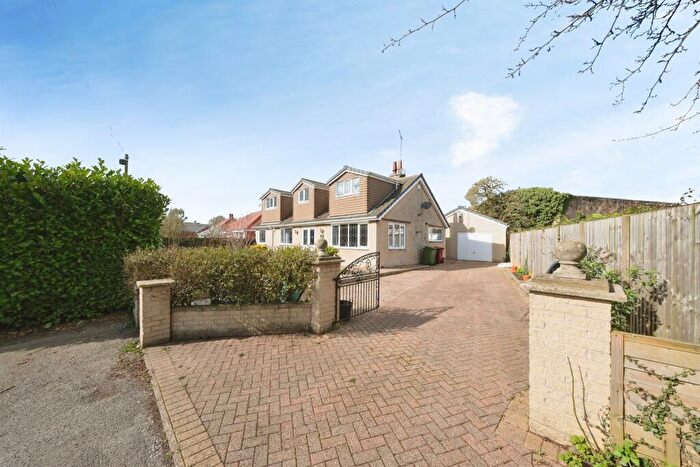
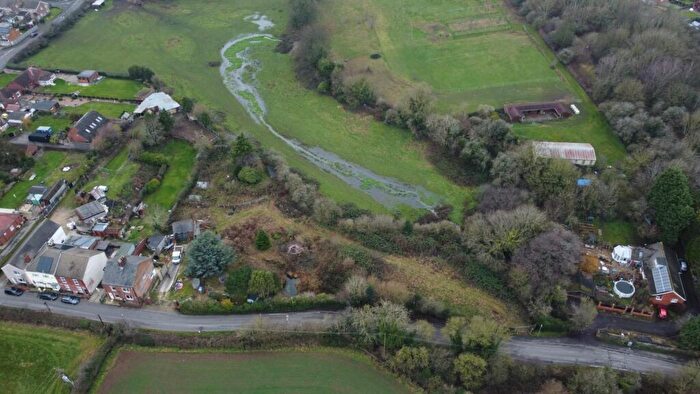
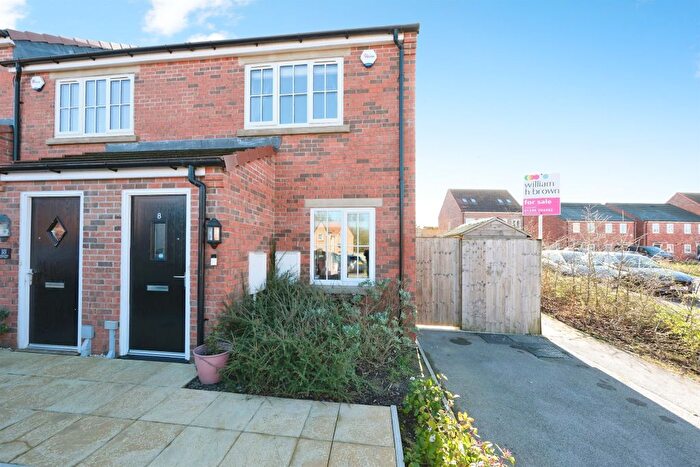
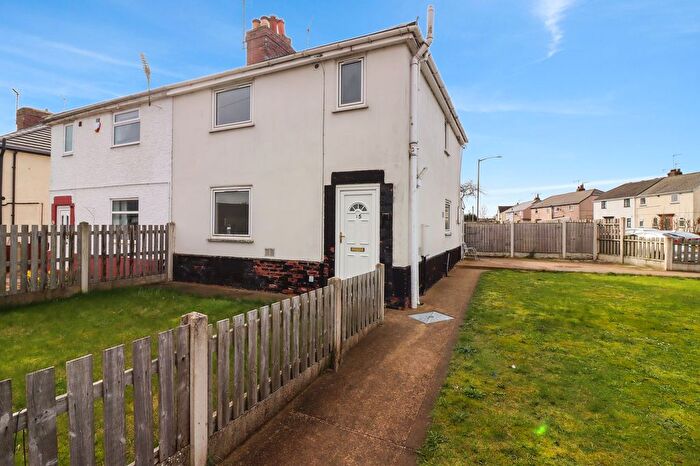
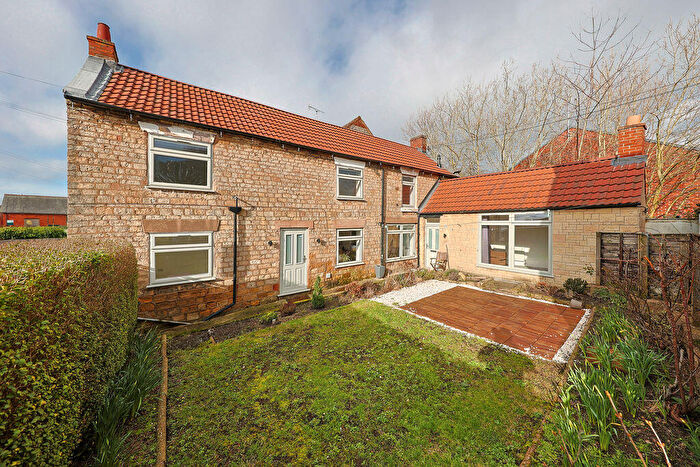
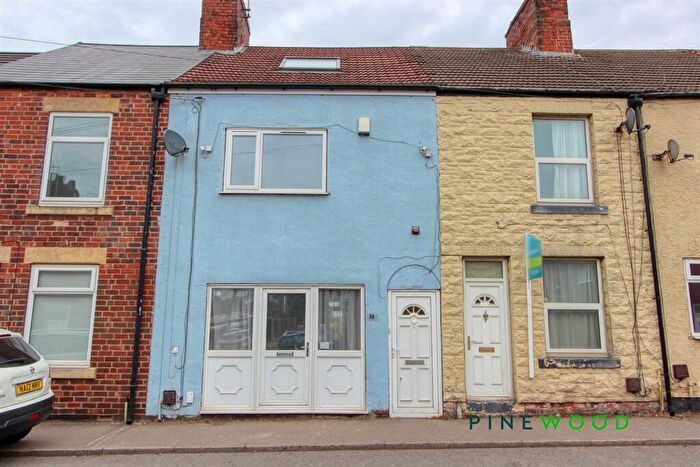
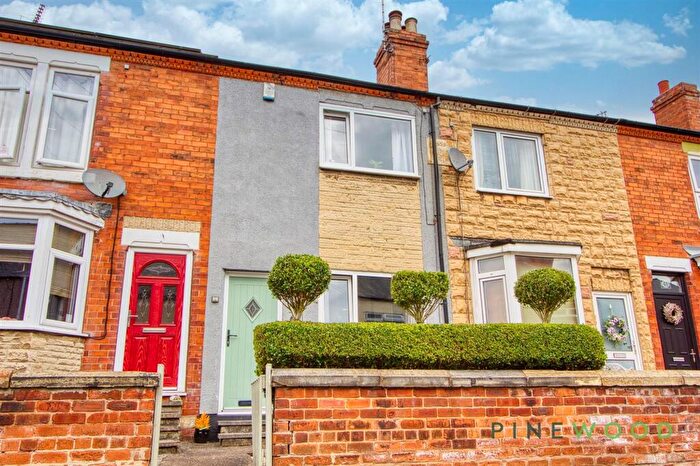
Properties for sale in Clowne North
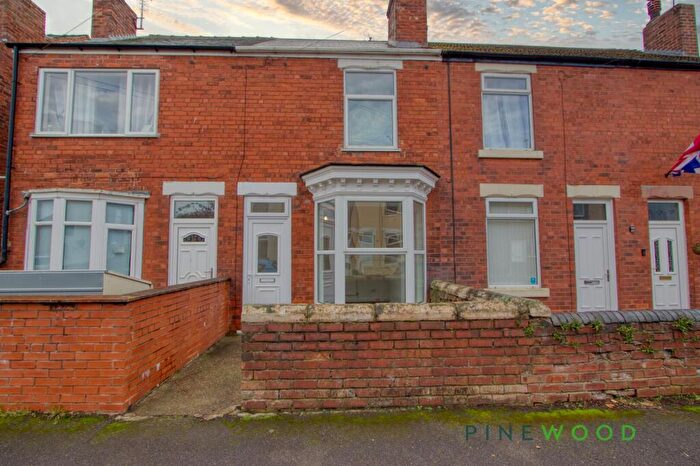
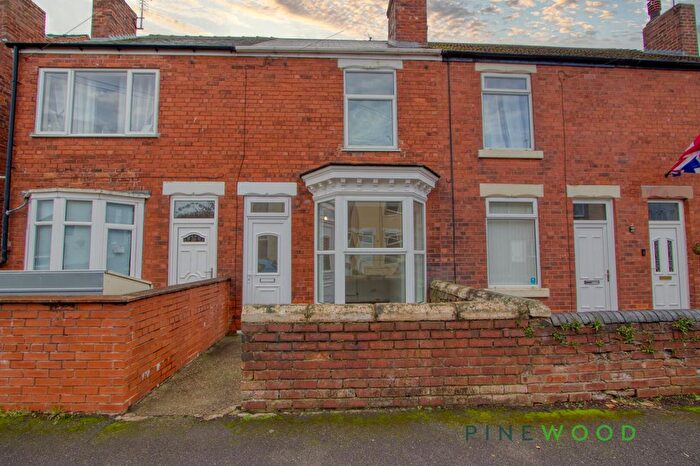
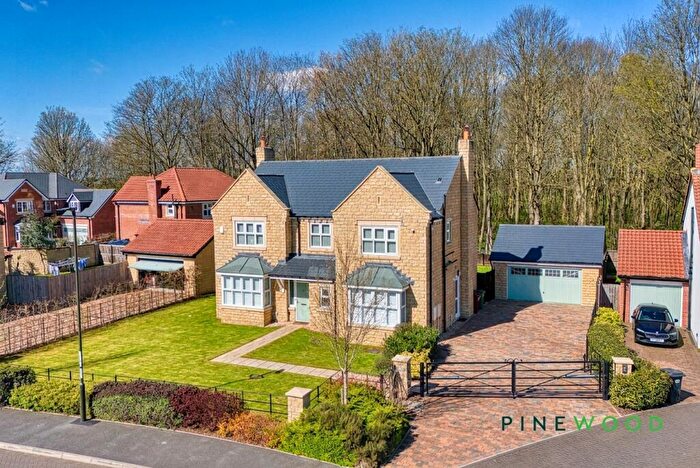
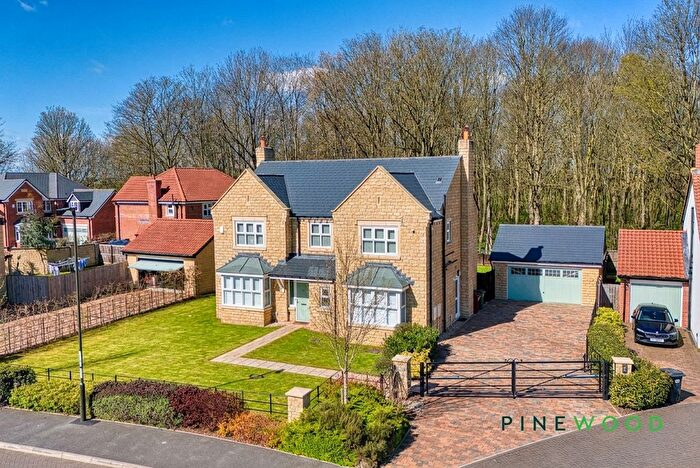

![]()
If you are looking to sell your house, let it out, or receive a property valuation, an expert can help you.
Click the button below to get started.


Roads and Postcodes in Clowne North
Navigate through our locations to find the location of your next house in Clowne North, Chesterfield for sale or to rent.
| Streets | Postcodes |
|---|---|
| Barlborough Road | S43 4QS S43 4QT S43 4QX S43 4RA S43 4RD S43 4RE S43 4RF |
| Barton Street | S43 4RS |
| Bentinck Drive | S43 4SS |
| Blackberry Court | S43 4QH |
| Boughton Lane | S43 4QF S43 4QN S43 4QR S43 4QW |
| Bramlyn Close | S43 4QP |
| Bramlyn Court | S43 4QA |
| Bricky Close | S43 4SU |
| Brook Hill | S43 4RP |
| Brook Lane | S43 4RR S43 4RY |
| Brookbank Road | S43 4RQ |
| Cavendish Drive | S43 4AR |
| Chapel Close | S43 4PB |
| Chatsworth Avenue | S43 4SR |
| Clumber Close | S43 4SP |
| Clune Street | S43 4NJ |
| Creswell Road | S43 4LR S43 4LS S43 4LX S43 4LY S43 4NA S43 4NB S43 4PN S43 4PW |
| Devonshire Way | S43 4SJ |
| Duke Street | S43 4RZ |
| East Street | S43 4NT |
| Gapsick Lane | S43 4AW |
| Gray Street | S43 4RT S43 4RU |
| Greenside Close | S43 4PX |
| Haddon Avenue | S43 4SN |
| Hardwick Close | S43 4SL |
| Harlesthorpe Avenue | S43 4AF S43 4AG |
| Hartington Court | S43 4AS |
| Hawthorn Close | S43 4SX |
| Heritage Drive | S43 4ST |
| Hickinwood Crescent | S43 4AQ |
| Hickinwood Lane | S43 4AA S43 4AD S43 4AE |
| Hutchings Crescent | S43 4QU |
| Jago Avenue | S43 4NQ |
| Jubilee Crescent | S43 4ND |
| Linnet Way | S43 4LW |
| Markland Avenue | S43 4NF |
| Markland Crescent | S43 4NG |
| Mastin Avenue | S43 4RJ |
| Monnies End | S43 4RG |
| Neale Street | S43 4RX S43 4SE |
| New Barlborough Close | S43 4QY |
| North Road | S43 4PF S43 4PG S43 4PQ |
| Park View | S43 4AN |
| Peak View | S43 4RH |
| Rhodes Cottages | S43 4LZ |
| Rose Avenue | S43 4NU |
| Rotherham Road | S43 4PS S43 4PT |
| Salvin Crescent | S43 4PJ |
| Shawlands Mews | S43 4NY |
| Slayley View | S43 4RL |
| Southgate Crescent | S43 4AL |
| Station Road | S43 4AB |
| The Bungalows | S43 4QZ |
| Thoresby Avenue | S43 4SW |
| West Lea | S43 4QJ S43 4QL |
| West Street | S43 4NW |
| Westlea View | S43 4SZ |
| Wilson Avenue | S43 4AH S43 4AJ S43 4NH |
| Woodland Grove | S43 4AT |
| Worksop Road | S43 4TB S43 4TD |
Transport near Clowne North
-
 Creswell (Derbys) Station
 -
Whitwell (Derbys) Station
-
Langwith Station
-
Kiveton Park Station
-
Kiveton Bridge Station
-
Shireoaks Station
- FAQ
- Price Paid By Year
- Property Type Price
Frequently asked questions about Clowne North
What is the average price for a property for sale in Clowne North?
The average price for a property for sale in Clowne North is £140,680. This amount is 34% lower than the average price in Chesterfield. There are 406 property listings for sale in Clowne North.
What streets have the most expensive properties for sale in Clowne North?
The streets with the most expensive properties for sale in Clowne North are Slayley View at an average of £324,000, Gapsick Lane at an average of £307,500 and Peak View at an average of £260,000.
What streets have the most affordable properties for sale in Clowne North?
The streets with the most affordable properties for sale in Clowne North are West Lea at an average of £59,537, Barton Street at an average of £74,000 and North Road at an average of £84,535.
Which train stations are available in or near Clowne North?
Some of the train stations available in or near Clowne North are Creswell (Derbys), Whitwell (Derbys) and Langwith.
Property Price Paid in Clowne North by Year
The average sold property price by year was:
| Year | Average Sold Price | Price Change |
Sold Properties
|
|---|---|---|---|
| 2026 | £118,000 | -27% |
1 Property |
| 2025 | £149,750 | 8% |
64 Properties |
| 2024 | £137,255 | 2% |
64 Properties |
| 2023 | £134,169 | 4% |
52 Properties |
| 2022 | £128,985 | -11% |
90 Properties |
| 2021 | £143,161 | 9% |
78 Properties |
| 2020 | £129,903 | 5% |
52 Properties |
| 2019 | £123,624 | -7% |
72 Properties |
| 2018 | £132,711 | 12% |
65 Properties |
| 2017 | £116,737 | -7% |
83 Properties |
| 2016 | £125,469 | 1% |
66 Properties |
| 2015 | £123,992 | 7% |
60 Properties |
| 2014 | £115,775 | 15% |
55 Properties |
| 2013 | £98,027 | -11% |
53 Properties |
| 2012 | £108,337 | 8% |
48 Properties |
| 2011 | £99,615 | -20% |
41 Properties |
| 2010 | £119,629 | -4% |
58 Properties |
| 2009 | £123,882 | 1% |
56 Properties |
| 2008 | £122,975 | 4% |
63 Properties |
| 2007 | £118,193 | 3% |
94 Properties |
| 2006 | £114,606 | -6% |
111 Properties |
| 2005 | £120,991 | 29% |
70 Properties |
| 2004 | £86,182 | 17% |
97 Properties |
| 2003 | £71,790 | 18% |
120 Properties |
| 2002 | £59,205 | 10% |
87 Properties |
| 2001 | £53,041 | 4% |
91 Properties |
| 2000 | £50,763 | 13% |
86 Properties |
| 1999 | £44,176 | 10% |
82 Properties |
| 1998 | £39,729 | -4% |
76 Properties |
| 1997 | £41,143 | 8% |
73 Properties |
| 1996 | £37,978 | 12% |
53 Properties |
| 1995 | £33,351 | - |
57 Properties |
Property Price per Property Type in Clowne North
Here you can find historic sold price data in order to help with your property search.
The average Property Paid Price for specific property types in the last three years are:
| Property Type | Average Sold Price | Sold Properties |
|---|---|---|
| Semi Detached House | £154,520.00 | 63 Semi Detached Houses |
| Detached House | £209,125.00 | 38 Detached Houses |
| Terraced House | £97,413.00 | 74 Terraced Houses |
| Flat | £95,500.00 | 6 Flats |