Houses for sale & to rent in Clowne South, Chesterfield
House Prices in Clowne South
Properties in Clowne South have an average house price of £193,722.00 and had 133 Property Transactions within the last 3 years¹.
Clowne South is an area in Chesterfield, Derbyshire with 1,512 households², where the most expensive property was sold for £436,710.00.
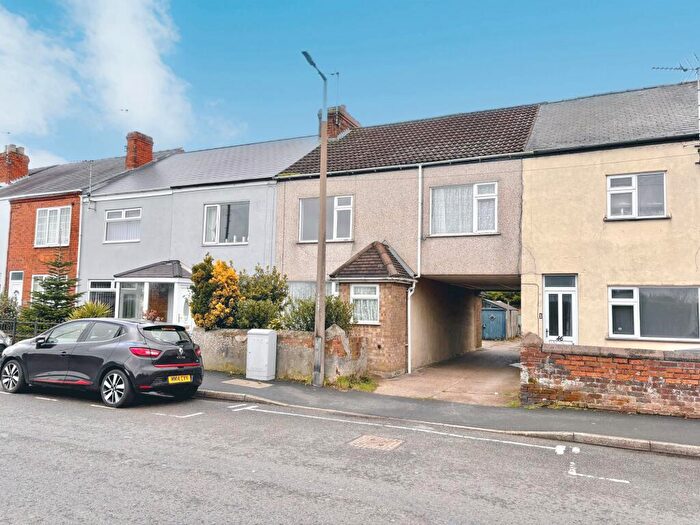
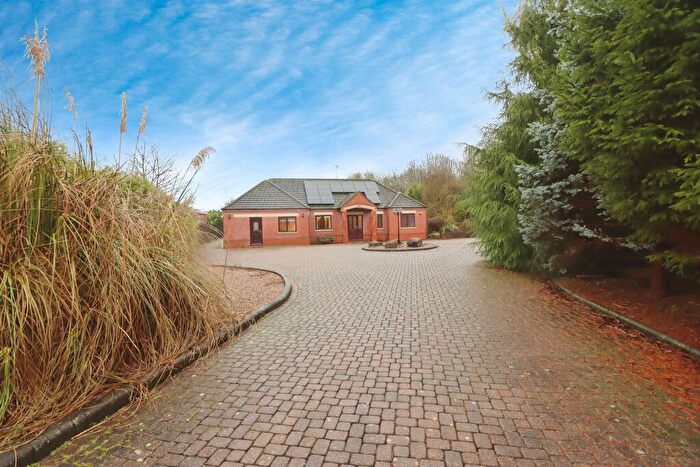
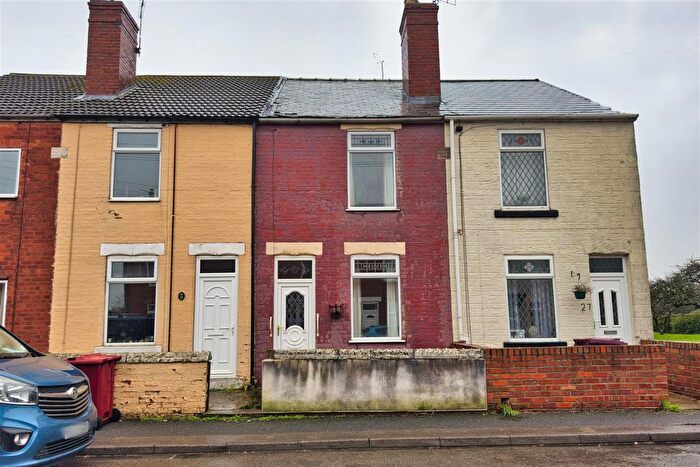
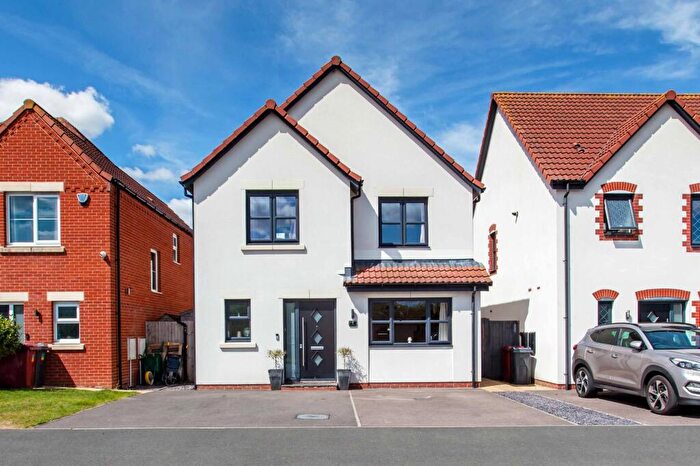
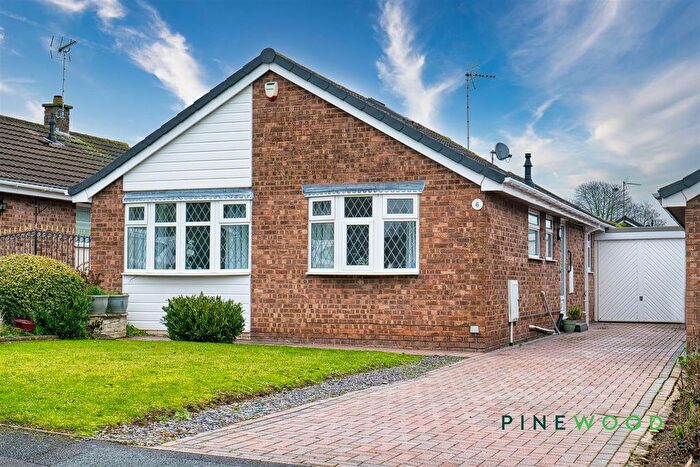
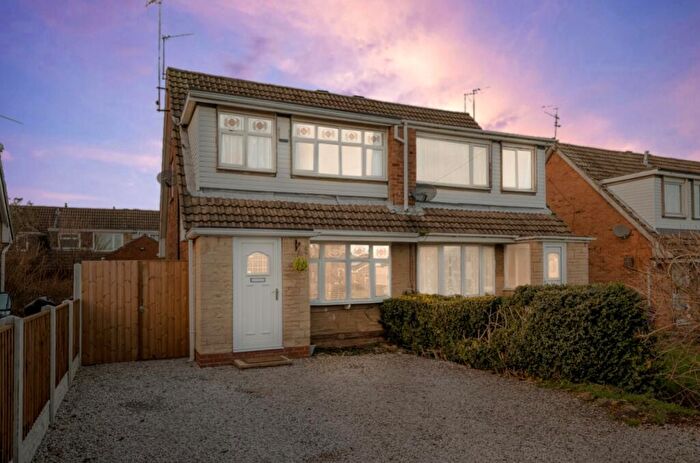
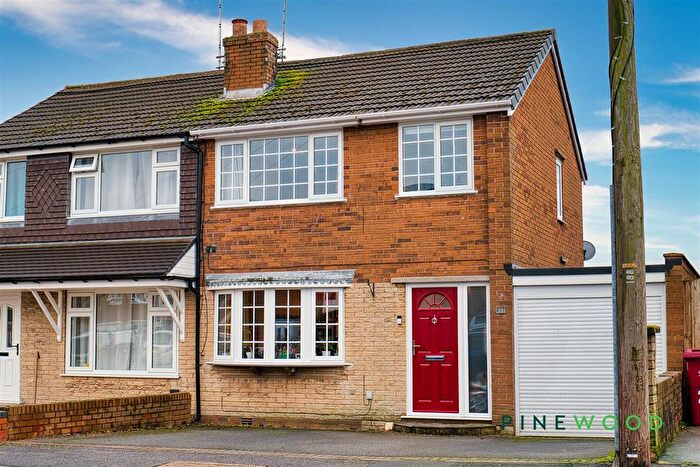
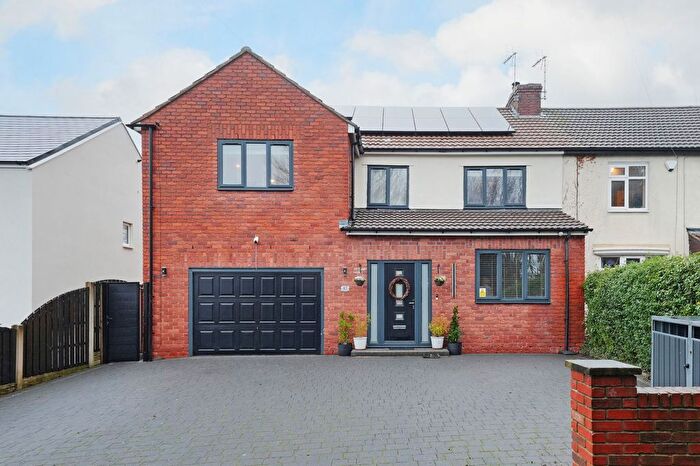
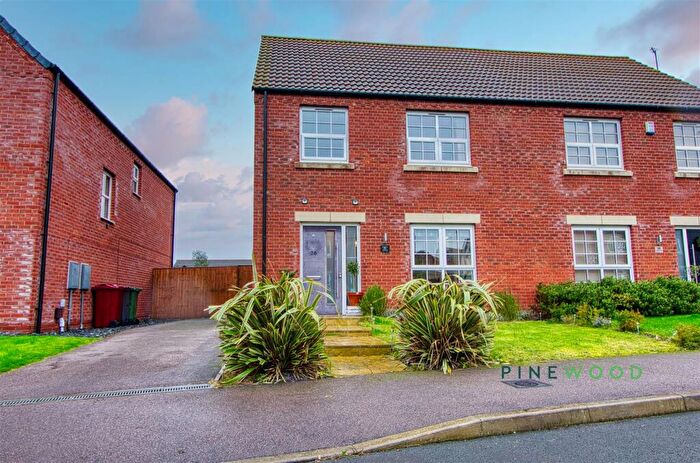
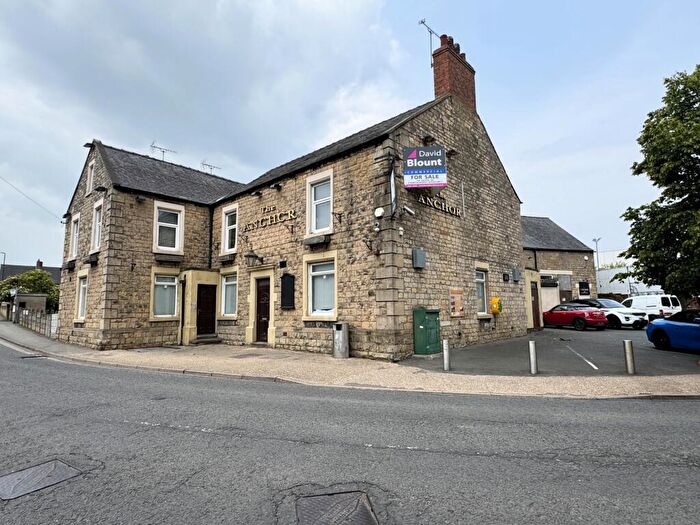
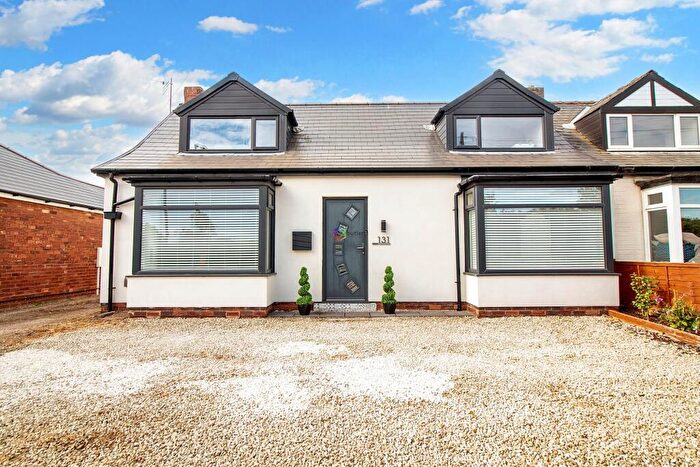
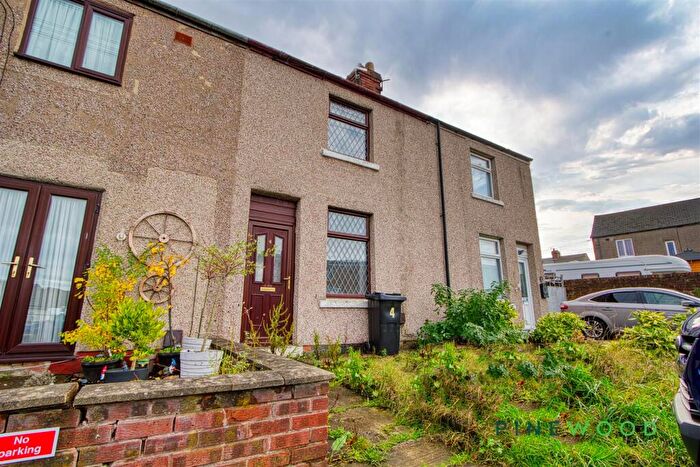
Properties for sale in Clowne South
Roads and Postcodes in Clowne South
Navigate through our locations to find the location of your next house in Clowne South, Chesterfield for sale or to rent.
| Streets | Postcodes |
|---|---|
| Ash Tree Road | S43 4UH |
| Border Close | S43 4DS |
| Boughton Lane | S43 4JZ |
| Chestnut Drive | S43 4JG |
| Church Close | S43 4DP |
| Church Lane | S43 4AZ |
| Church Street | S43 4BJ S43 4BL S43 4JR S43 4JS |
| Church View | S43 4LN |
| Cliff Hill | S43 4LE |
| College Mews | S43 4FL |
| Court View | S43 4BU |
| Craggs Drive | S43 4DD |
| Cricket View | S43 4UE |
| Croft View | S43 4FS |
| Crown Street | S43 4DL S43 4DN |
| Damsbrook Drive | S43 4DE |
| Dukeries Court | S43 4DT |
| Elmton Close | S43 4DR |
| Field View | S43 4BW |
| High Leys Road | S43 4DG |
| High Street | S43 4JQ S43 4JT S43 4JU S43 4JX |
| Hollin Hill Road | S43 4AU S43 4AX |
| Ivy Close | S43 4BF |
| John Street | S43 4LD |
| King Street | S43 4BS |
| Kings Close | S43 4BT |
| Low Road | S43 4LF S43 4LQ |
| Manor Court | S43 4DY |
| Mansfield Road | S43 4DH S43 4DJ S43 4DQ |
| Meadow View | S43 4LP |
| Mill Close | S43 4JP |
| Mill Street | S43 4JN |
| Mitchell Street | S43 4SH S43 4SQ |
| Neale Street | S43 4SD S43 4SF |
| North Road | S43 4QD |
| Northfields | S43 4BA |
| Oak Tree Road | S43 4UN |
| Offridge Close | S43 4PA |
| Pavilion Close | S43 4UG |
| Pitch Close | S43 4UF |
| Portland Street | S43 4SA S43 4SB |
| Ramper Avenue | S43 4UD |
| Rectory Road | S43 4BH S43 4FJ |
| Regent Street | S43 4LA |
| Ridgeway | S43 4BD |
| Ridgeway West | S43 4UB |
| Ringer Court | S43 4FE |
| Ringer Lane | S43 4BX S43 4BZ S43 4DA S43 4DB |
| Ringer Way | S43 4DW |
| Romeley Crescent | S43 4LB |
| Rood Lane | S43 4BP |
| Slaley Lane | S43 4LG |
| Southfields | S43 4BE |
| Southwood Drive | S43 4DX |
| Springfield Close | S43 4DF |
| St Johns Crescent | S43 4DZ S43 4EA S43 4EB |
| Sterry Close | S43 4BN |
| Sunny Brook Close | S43 4EF |
| Vicarage Walk | S43 4FG |
| Welbeck Court | S43 4DU |
| Willow Tree Drive | S43 4UP |
Transport near Clowne South
-
Creswell (Derbys) Station
-
Whitwell (Derbys) Station
-
Langwith Station
-
Kiveton Park Station
-
Kiveton Bridge Station
- FAQ
- Price Paid By Year
- Property Type Price
Frequently asked questions about Clowne South
What is the average price for a property for sale in Clowne South?
The average price for a property for sale in Clowne South is £193,722. This amount is 9% lower than the average price in Chesterfield. There are 366 property listings for sale in Clowne South.
What streets have the most expensive properties for sale in Clowne South?
The streets with the most expensive properties for sale in Clowne South are Offridge Close at an average of £320,000, Ramper Avenue at an average of £310,000 and Sterry Close at an average of £307,000.
What streets have the most affordable properties for sale in Clowne South?
The streets with the most affordable properties for sale in Clowne South are Regent Street at an average of £45,000, Boughton Lane at an average of £103,000 and Mill Street at an average of £117,250.
Which train stations are available in or near Clowne South?
Some of the train stations available in or near Clowne South are Creswell (Derbys), Whitwell (Derbys) and Langwith.
Property Price Paid in Clowne South by Year
The average sold property price by year was:
| Year | Average Sold Price | Price Change |
Sold Properties
|
|---|---|---|---|
| 2025 | £184,365 | -3% |
41 Properties |
| 2024 | £189,253 | -9% |
44 Properties |
| 2023 | £205,811 | 6% |
48 Properties |
| 2022 | £192,805 | 0,2% |
55 Properties |
| 2021 | £192,358 | 24% |
61 Properties |
| 2020 | £145,749 | -5% |
45 Properties |
| 2019 | £153,169 | -3% |
59 Properties |
| 2018 | £158,172 | 1% |
64 Properties |
| 2017 | £155,814 | 12% |
65 Properties |
| 2016 | £137,696 | -2% |
63 Properties |
| 2015 | £140,550 | -1% |
72 Properties |
| 2014 | £141,959 | 11% |
77 Properties |
| 2013 | £125,822 | -3% |
48 Properties |
| 2012 | £129,193 | 8% |
31 Properties |
| 2011 | £119,315 | 4% |
41 Properties |
| 2010 | £114,303 | -41% |
27 Properties |
| 2009 | £161,004 | 25% |
36 Properties |
| 2008 | £121,239 | -12% |
19 Properties |
| 2007 | £135,563 | 10% |
77 Properties |
| 2006 | £121,577 | -4% |
77 Properties |
| 2005 | £126,689 | 24% |
66 Properties |
| 2004 | £96,135 | 4% |
64 Properties |
| 2003 | £92,134 | 30% |
79 Properties |
| 2002 | £64,818 | 16% |
60 Properties |
| 2001 | £54,762 | -1% |
94 Properties |
| 2000 | £55,334 | 12% |
62 Properties |
| 1999 | £48,473 | -11% |
80 Properties |
| 1998 | £53,660 | 12% |
55 Properties |
| 1997 | £47,337 | 6% |
66 Properties |
| 1996 | £44,354 | 11% |
62 Properties |
| 1995 | £39,464 | - |
76 Properties |
Property Price per Property Type in Clowne South
Here you can find historic sold price data in order to help with your property search.
The average Property Paid Price for specific property types in the last three years are:
| Property Type | Average Sold Price | Sold Properties |
|---|---|---|
| Semi Detached House | £181,885.00 | 40 Semi Detached Houses |
| Detached House | £258,060.00 | 52 Detached Houses |
| Terraced House | £129,058.00 | 35 Terraced Houses |
| Flat | £92,250.00 | 6 Flats |

