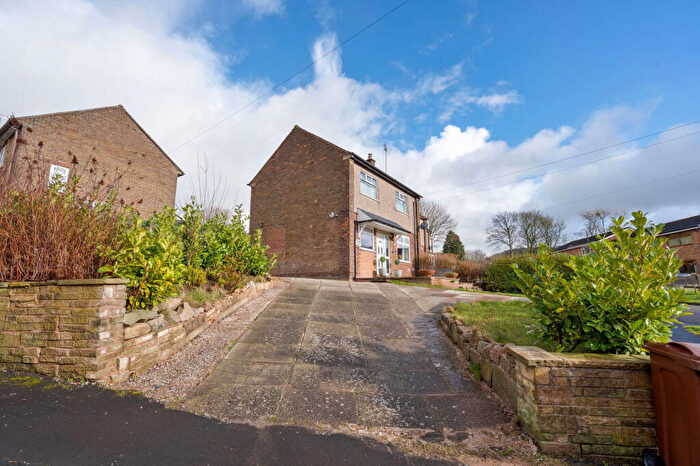
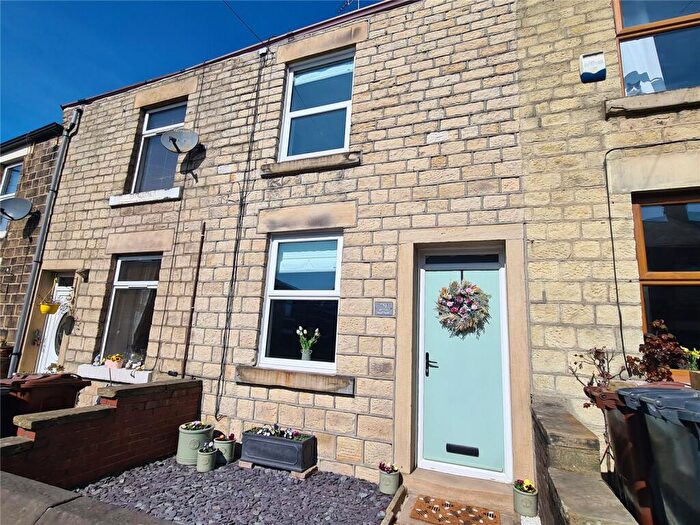
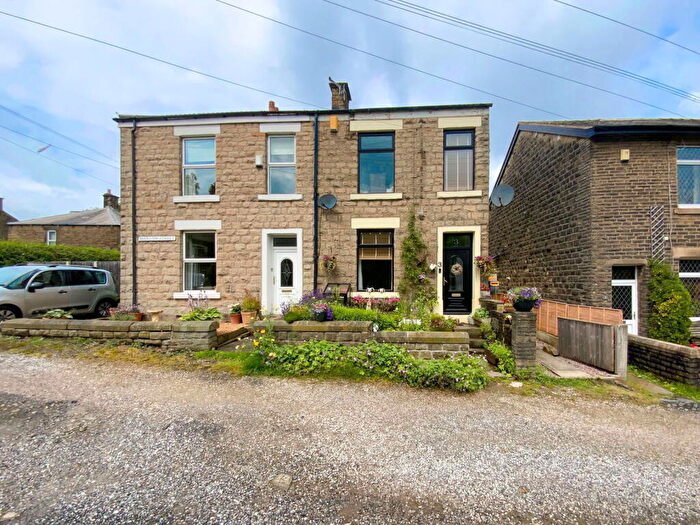
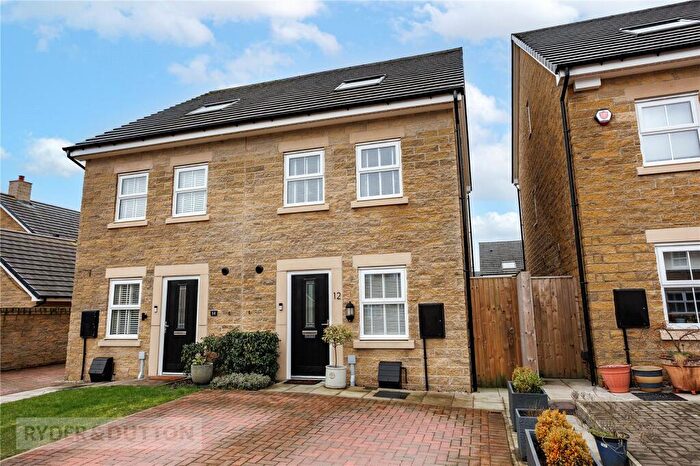
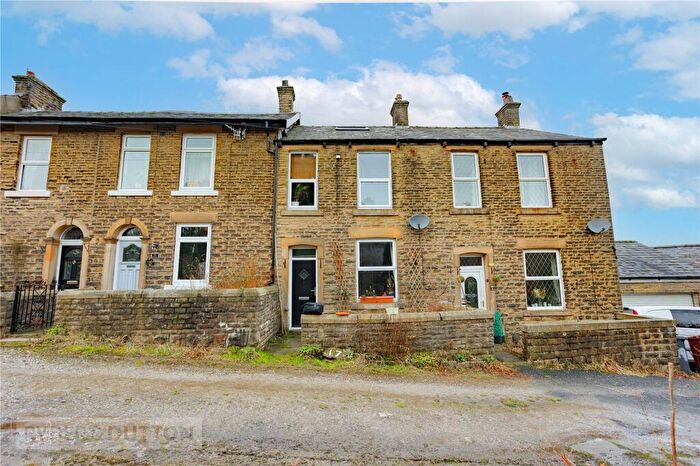
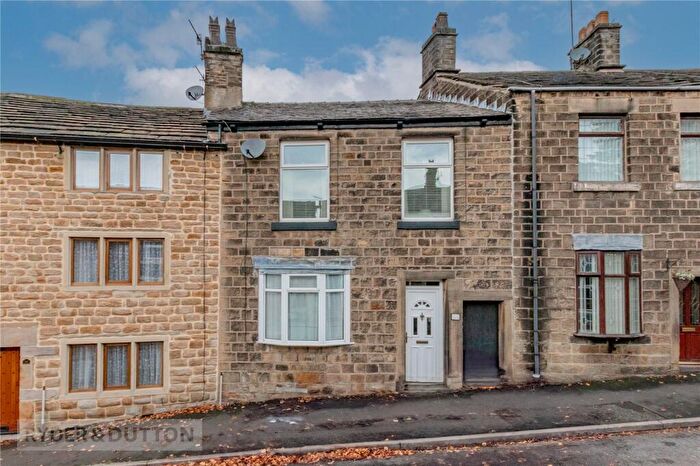
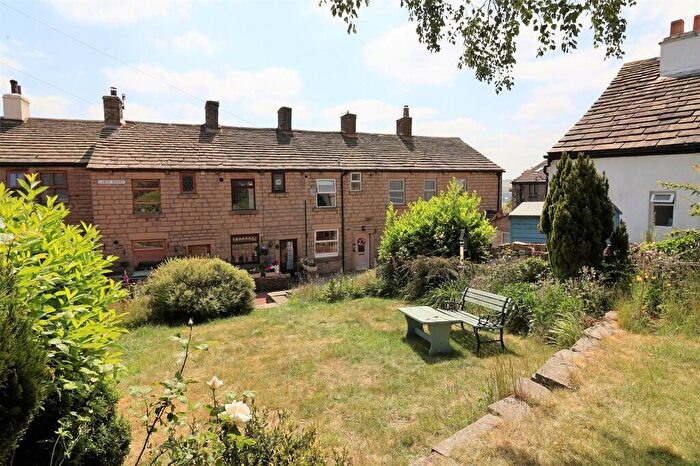
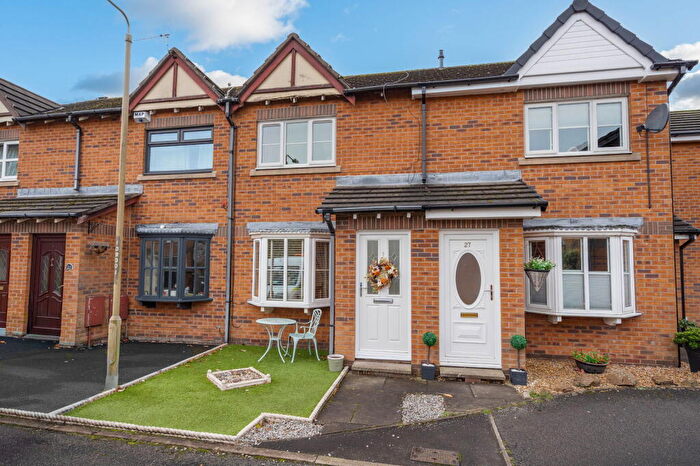
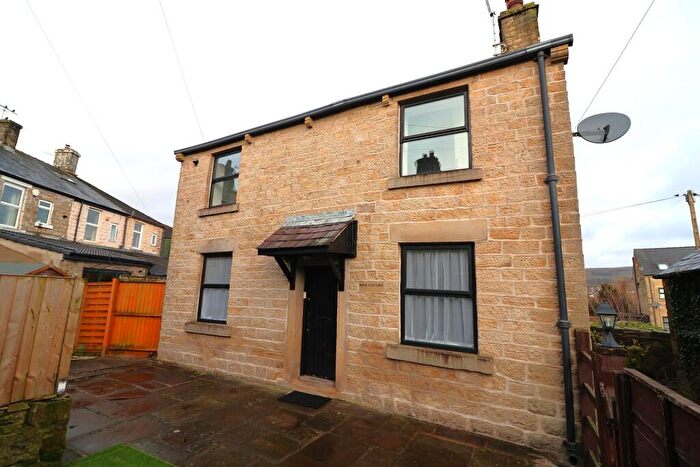
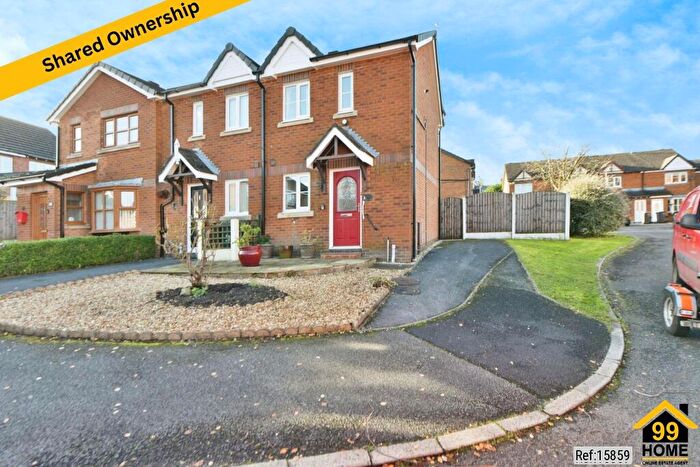
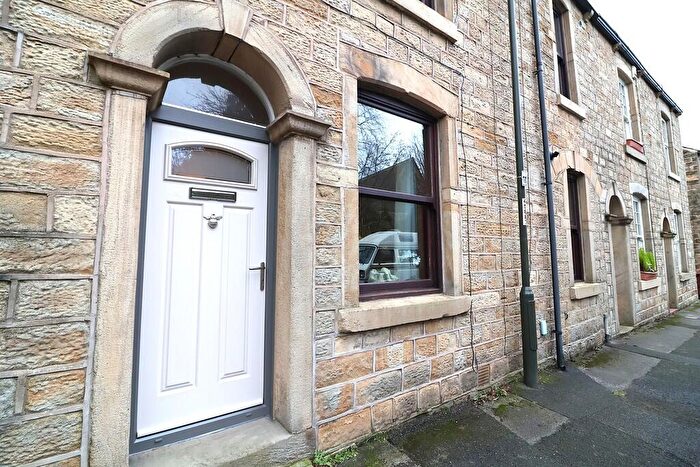
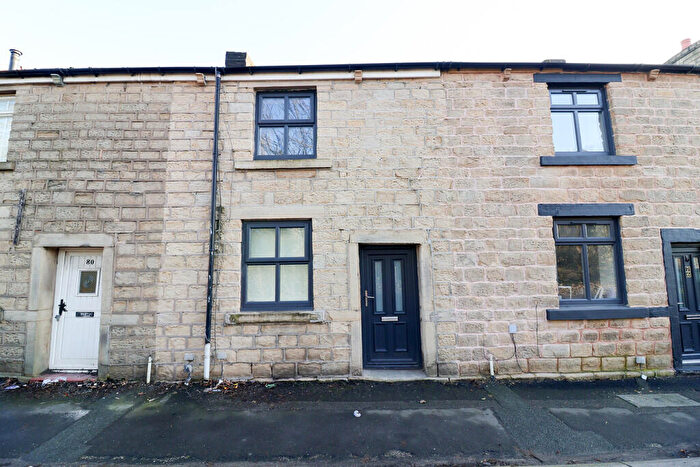
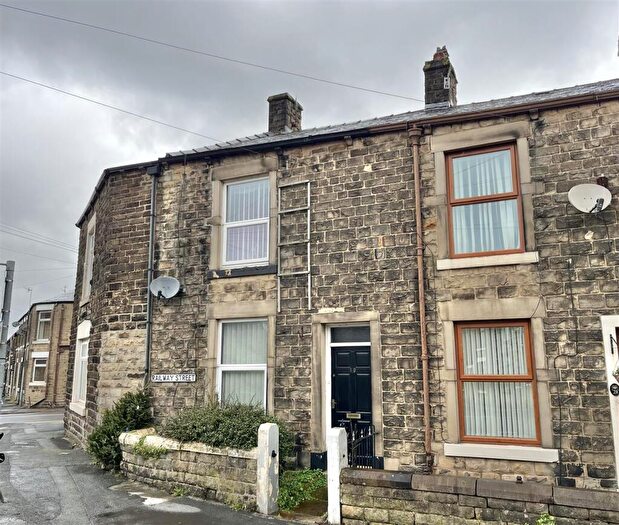
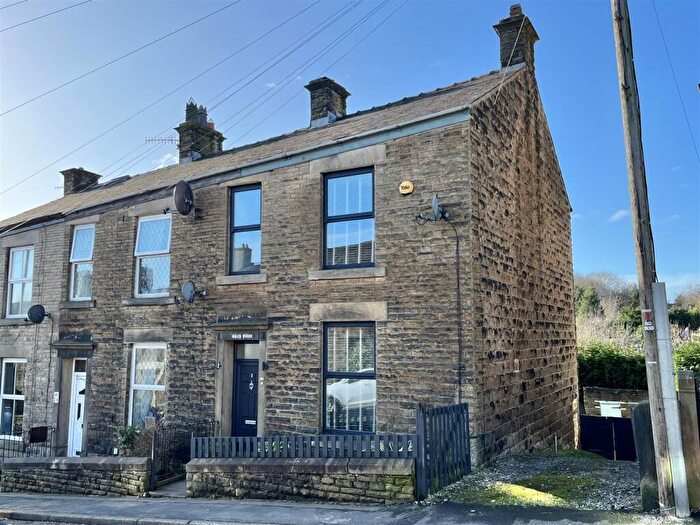
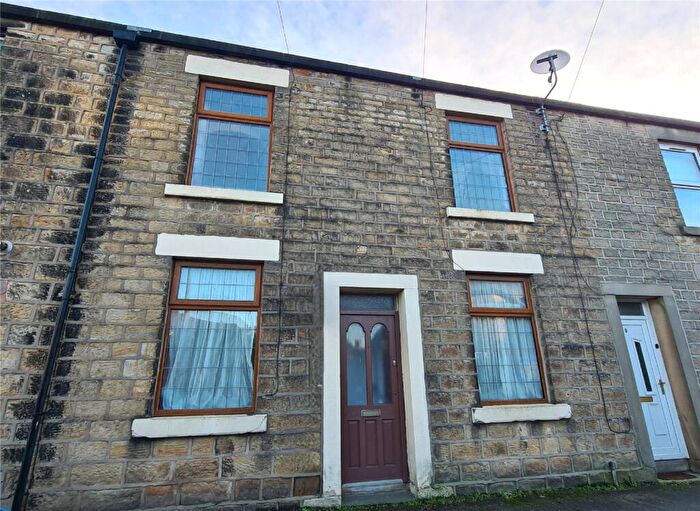
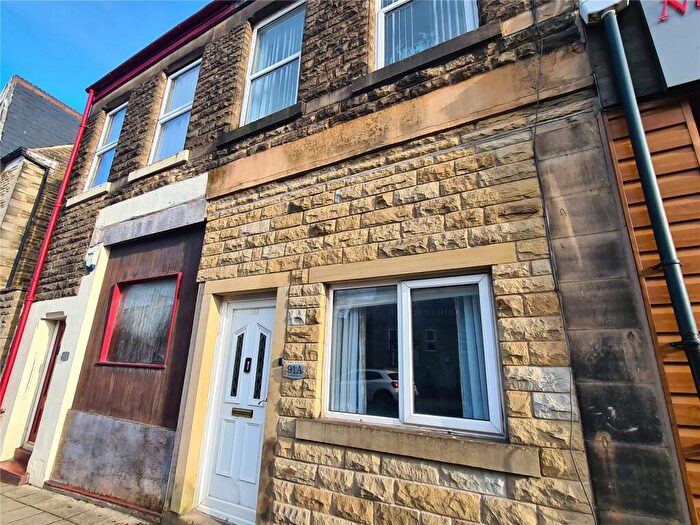
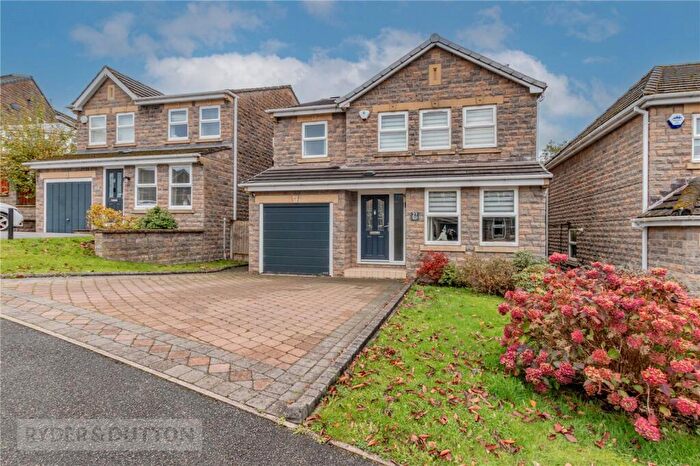
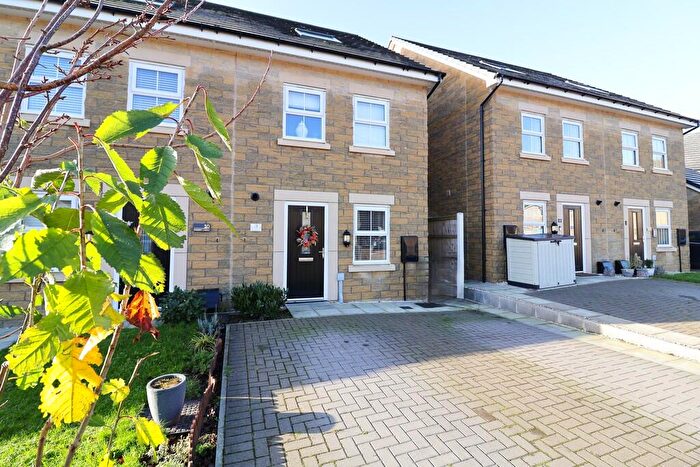
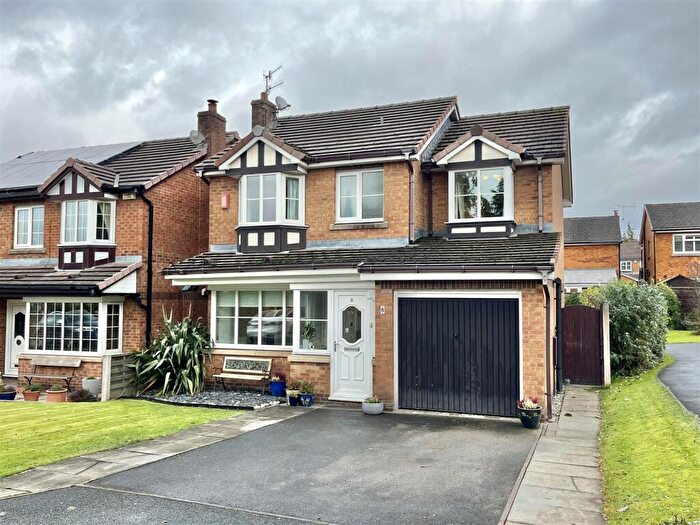
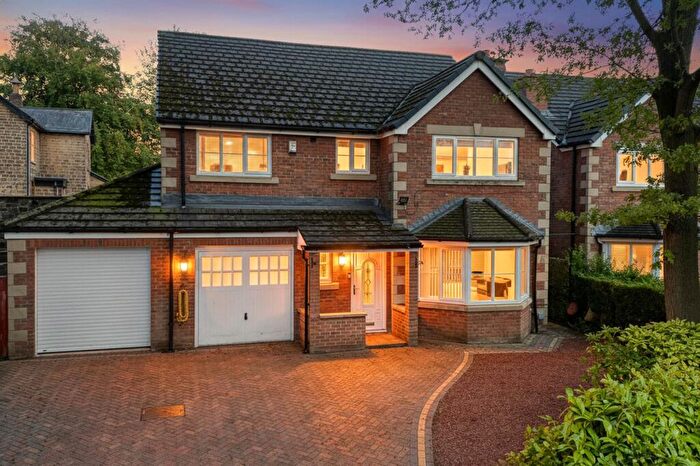
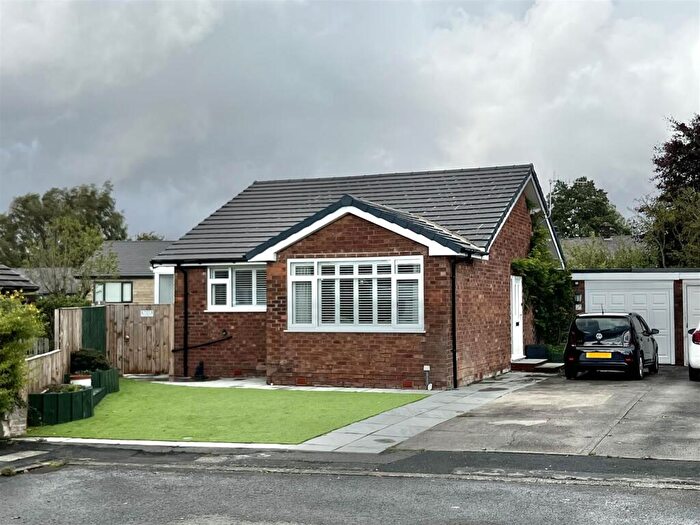
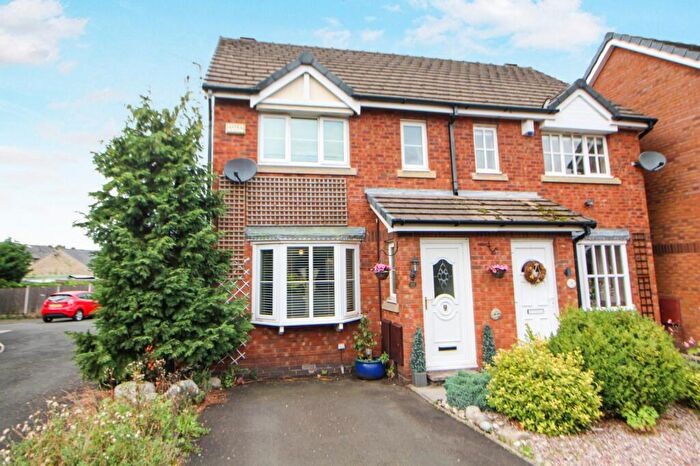
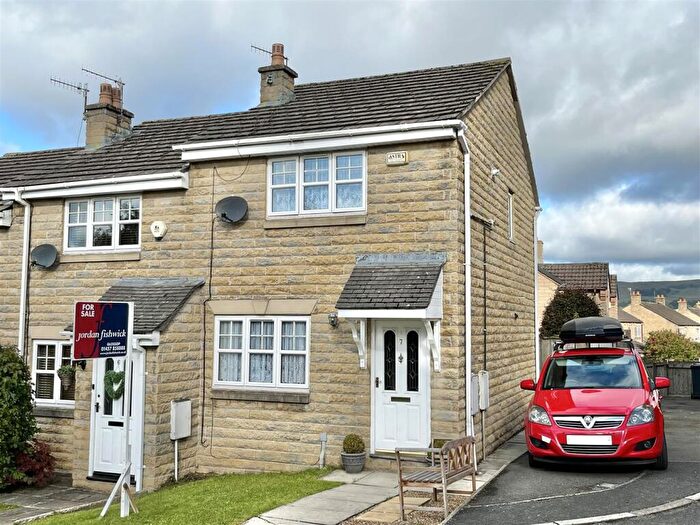
Houses for sale & to rent in Hadfield North, Glossop
House Prices in Hadfield North
Properties in Hadfield North have an average house price of £214,310.00 and had 47 Property Transactions within the last 3 years¹.
Hadfield North is an area in Glossop, Derbyshire with 794 households², where the most expensive property was sold for £460,000.00.
Properties for sale in Hadfield North
Roads and Postcodes in Hadfield North
Navigate through our locations to find the location of your next house in Hadfield North, Glossop for sale or to rent.
| Streets | Postcodes |
|---|---|
| Albert Street | SK13 1AQ SK13 1DG |
| Bank Street | SK13 1BB |
| Bank Terrace | SK13 1AZ |
| Chapel Lane | SK13 1NU SK13 1NX SK13 1PG |
| Curtis Grove | SK13 1AE |
| Etherow Industrial Estate | SK13 2NS |
| Etherow Way | SK13 1PR SK13 1PS |
| Ewart Court | SK13 1GD |
| Graphite Way | SK13 1QG SK13 1QH |
| Greenbank | SK13 1PD |
| Hadfield Cross | SK13 1NT |
| Hadfield Road | SK13 2EP |
| John Dalton Street | SK13 1PU |
| Kiln Lane | SK13 1AU |
| Mersey Bank Road | SK13 1PL SK13 1PN |
| New Bank Street | SK13 1BG |
| Old Hall Fold | SK13 1AY |
| Paradise Street | SK13 1BA |
| Park View | SK13 1FJ |
| Ridings Road | SK13 1PA |
| Salisbury Street | SK13 1NP SK13 1NN |
| School Close | SK13 1QL |
| Spring Bank | SK13 1NY SK13 1NJ |
| Spring Gardens | SK13 1NS |
| St Charles Close | SK13 1PE |
| Station Road | SK13 1AJ SK13 1BQ SK13 1AL SK13 1AN |
| Stiles Close | SK13 1PT |
| Stone Ridge | SK13 1PB |
| The Carriage Drive | SK13 1PP SK13 1PJ |
| The Paddock | SK13 1PF |
| The Rises | SK13 1NZ |
| Warhurst Fold | SK13 1AX |
| Waterside | SK13 1BR SK13 1BP |
| Wesley Street | SK13 1DH SK13 1DJ |
| Woodfield Close | SK13 1PW |
| Woolley Bridge Road | SK13 1BW SK13 1PZ SK13 2NR SK13 1PQ |
Transport near Hadfield North
- FAQ
- Price Paid By Year
- Property Type Price
Frequently asked questions about Hadfield North
What is the average price for a property for sale in Hadfield North?
The average price for a property for sale in Hadfield North is £214,310. This amount is 20% lower than the average price in Glossop. There are 883 property listings for sale in Hadfield North.
What streets have the most expensive properties for sale in Hadfield North?
The streets with the most expensive properties for sale in Hadfield North are Paradise Street at an average of £403,750, Hadfield Cross at an average of £352,000 and Woodfield Close at an average of £263,950.
What streets have the most affordable properties for sale in Hadfield North?
The streets with the most affordable properties for sale in Hadfield North are Ewart Court at an average of £133,750, Salisbury Street at an average of £135,000 and Hadfield Road at an average of £180,000.
Which train stations are available in or near Hadfield North?
Some of the train stations available in or near Hadfield North are Hadfield, Dinting and Glossop.
Property Price Paid in Hadfield North by Year
The average sold property price by year was:
| Year | Average Sold Price | Price Change |
Sold Properties
|
|---|---|---|---|
| 2025 | £243,768 | 16% |
11 Properties |
| 2024 | £203,700 | -2% |
22 Properties |
| 2023 | £207,839 | 9% |
14 Properties |
| 2022 | £188,191 | 3% |
24 Properties |
| 2021 | £182,877 | 14% |
33 Properties |
| 2020 | £157,147 | 0,1% |
20 Properties |
| 2019 | £156,966 | 5% |
28 Properties |
| 2018 | £149,883 | -3% |
27 Properties |
| 2017 | £154,876 | 18% |
22 Properties |
| 2016 | £127,205 | -5% |
36 Properties |
| 2015 | £133,589 | 19% |
20 Properties |
| 2014 | £108,722 | -18% |
27 Properties |
| 2013 | £127,882 | 13% |
17 Properties |
| 2012 | £110,870 | -2% |
12 Properties |
| 2011 | £112,852 | 2% |
17 Properties |
| 2010 | £110,125 | -23% |
18 Properties |
| 2009 | £134,995 | 6% |
12 Properties |
| 2008 | £126,570 | 1% |
15 Properties |
| 2007 | £124,762 | 13% |
31 Properties |
| 2006 | £108,416 | 5% |
40 Properties |
| 2005 | £102,473 | 12% |
37 Properties |
| 2004 | £89,909 | 11% |
44 Properties |
| 2003 | £79,769 | 28% |
26 Properties |
| 2002 | £57,696 | 1% |
35 Properties |
| 2001 | £57,197 | 26% |
53 Properties |
| 2000 | £42,554 | 6% |
33 Properties |
| 1999 | £40,096 | -6% |
25 Properties |
| 1998 | £42,645 | -5% |
21 Properties |
| 1997 | £44,765 | 11% |
26 Properties |
| 1996 | £40,010 | -16% |
26 Properties |
| 1995 | £46,573 | - |
19 Properties |
Property Price per Property Type in Hadfield North
Here you can find historic sold price data in order to help with your property search.
The average Property Paid Price for specific property types in the last three years are:
| Property Type | Average Sold Price | Sold Properties |
|---|---|---|
| Semi Detached House | £221,838.00 | 13 Semi Detached Houses |
| Detached House | £422,500.00 | 3 Detached Houses |
| Terraced House | £194,955.00 | 29 Terraced Houses |
| Flat | £133,750.00 | 2 Flats |

