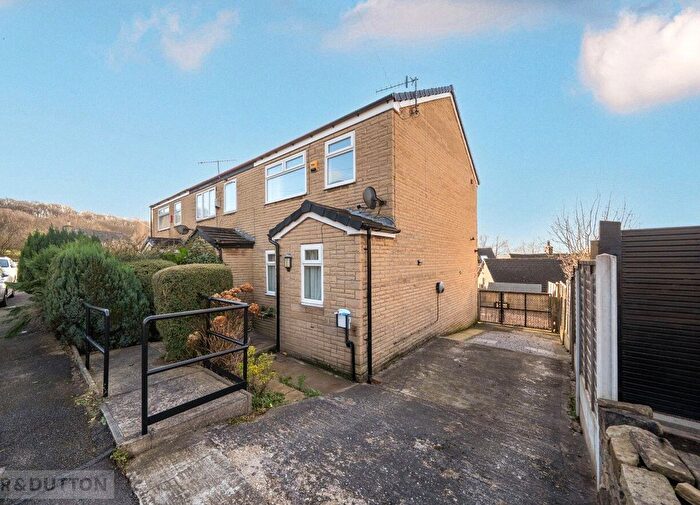
Houses for sale & to rent in Padfield, Glossop
House Prices in Padfield
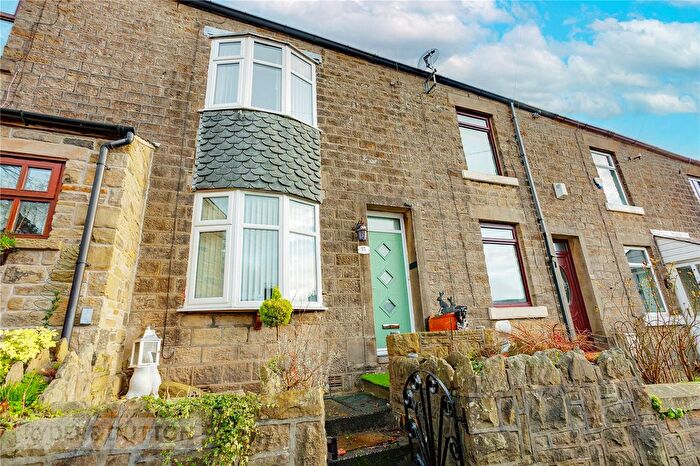
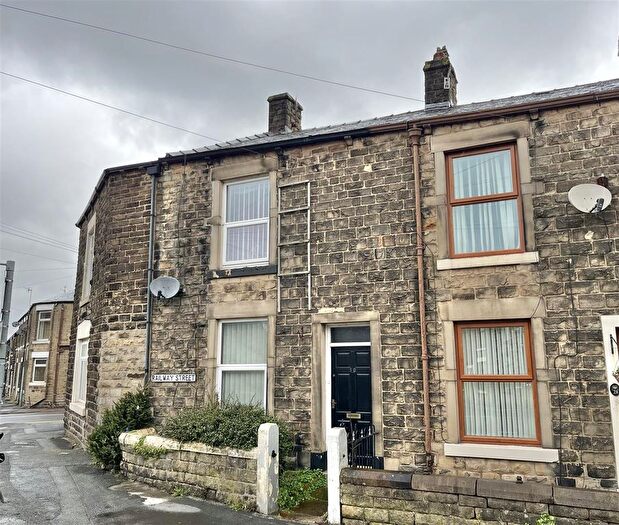
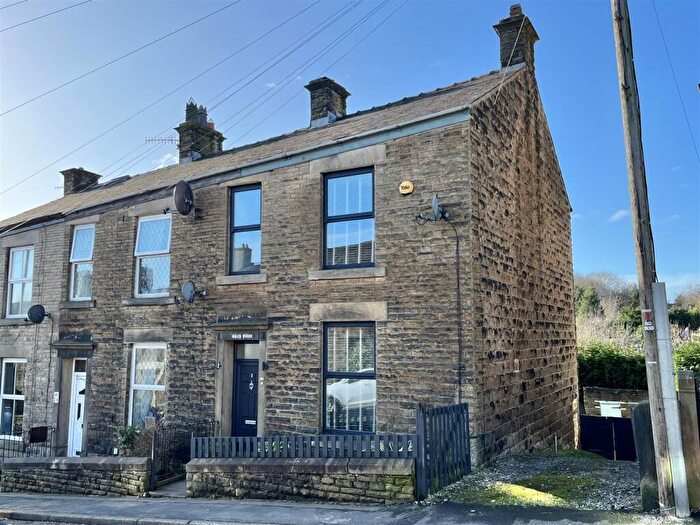
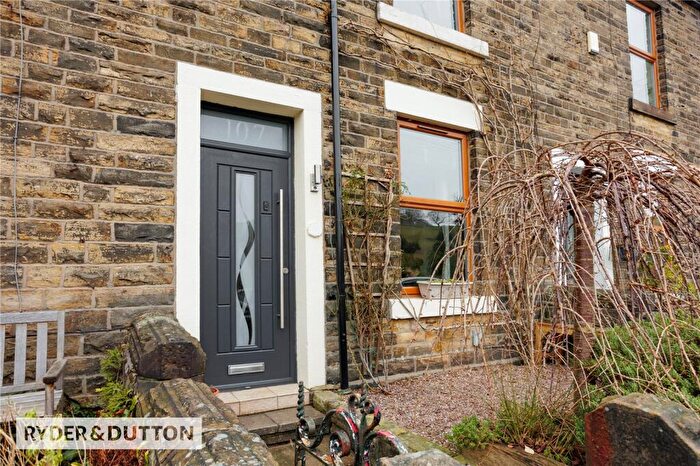
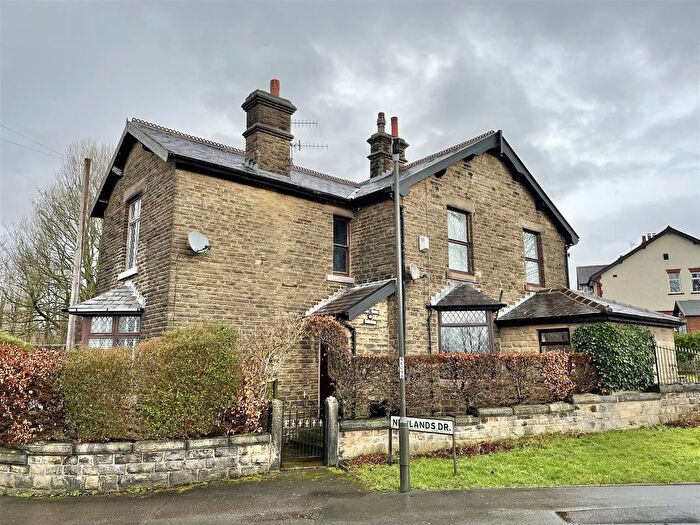
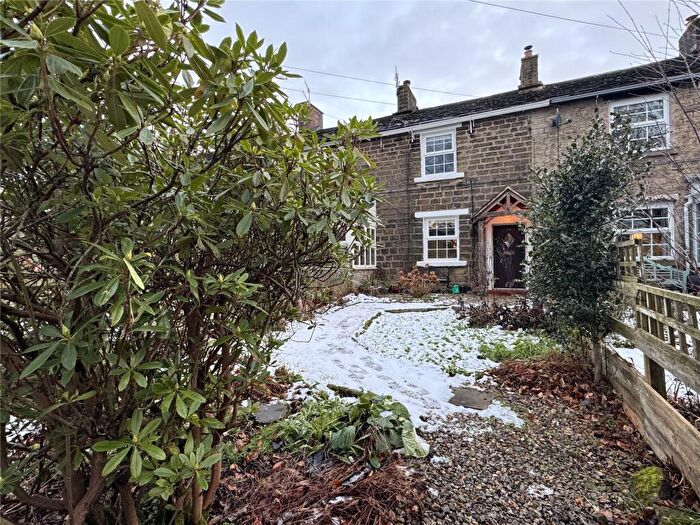
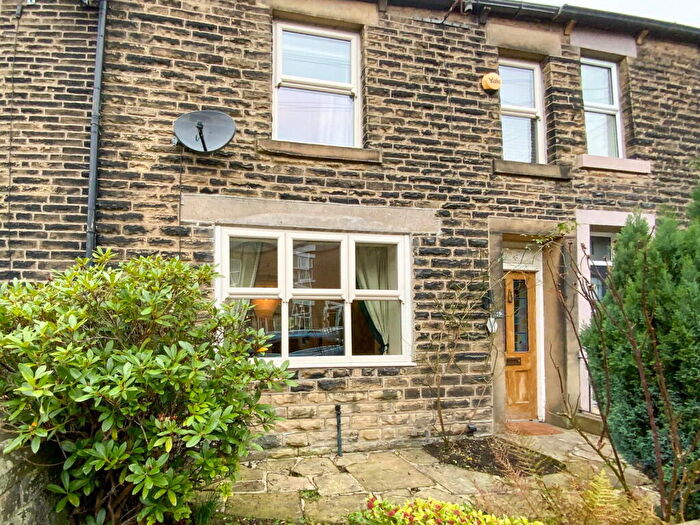
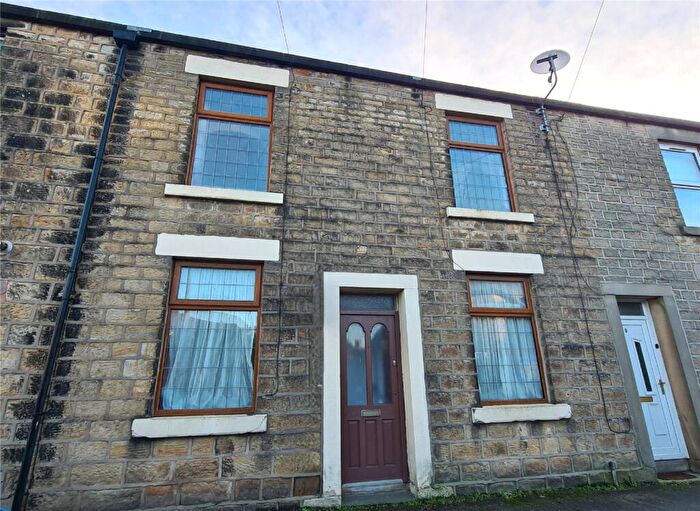
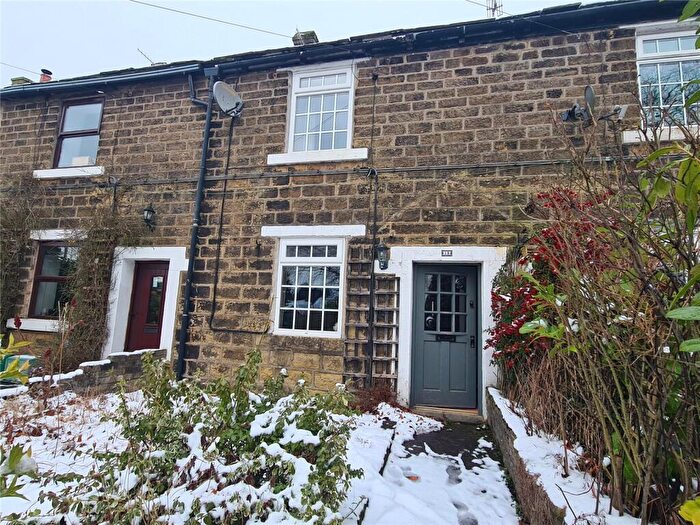
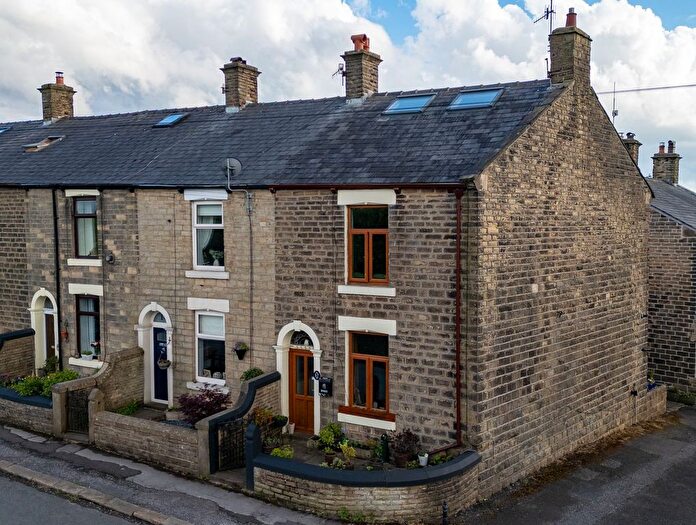
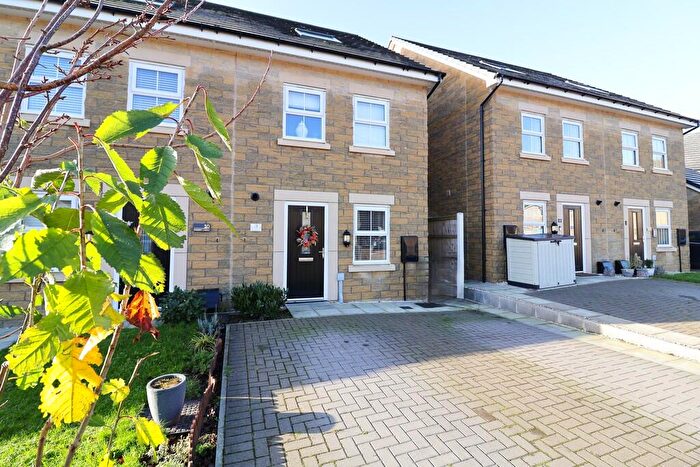
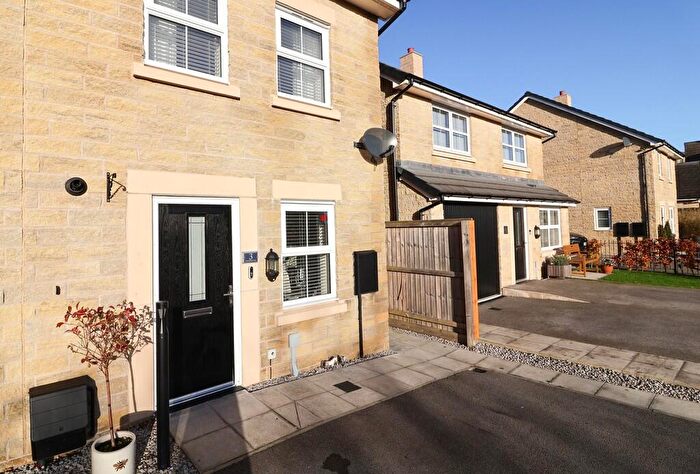
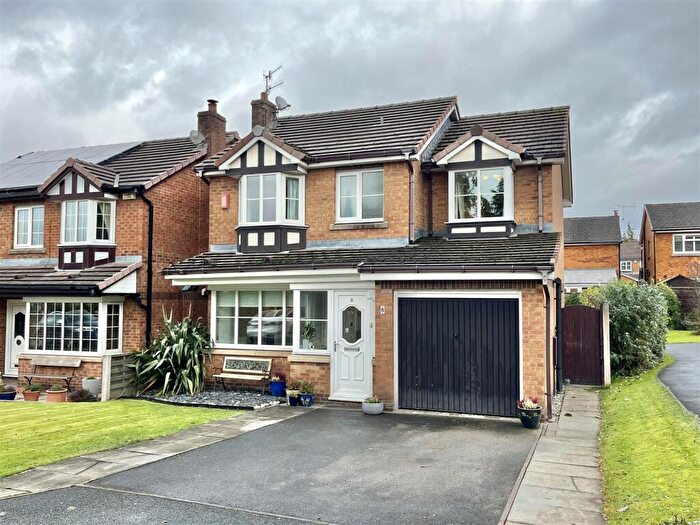
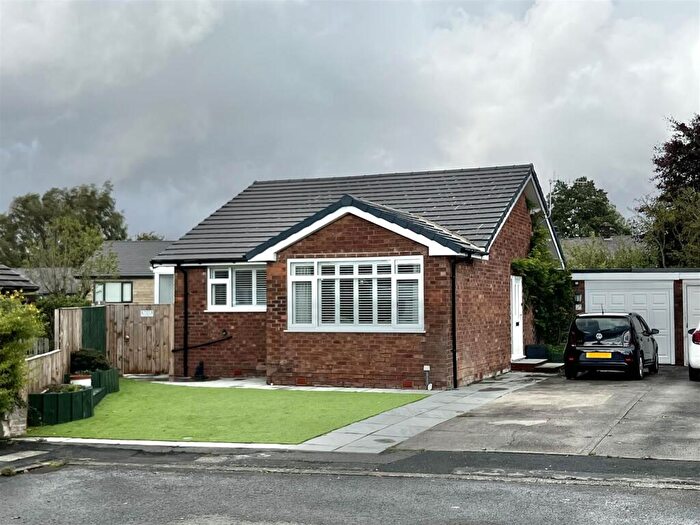
Properties in Padfield have an average house price of £244,791.00 and had 122 Property Transactions within the last 3 years¹.
Padfield is an area in Glossop, Derbyshire with 1,167 households², where the most expensive property was sold for £835,000.00.
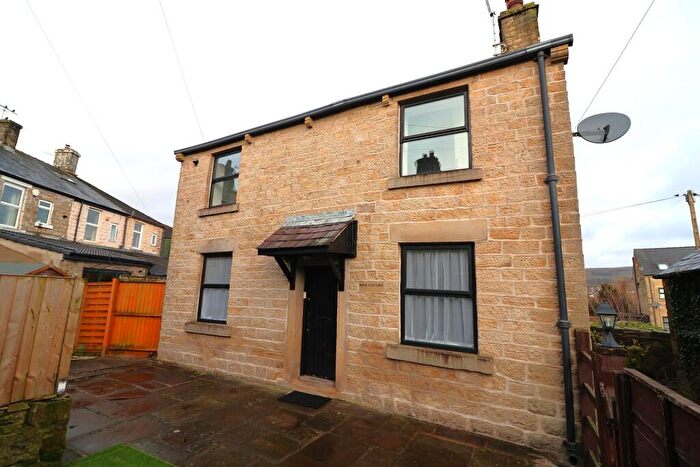
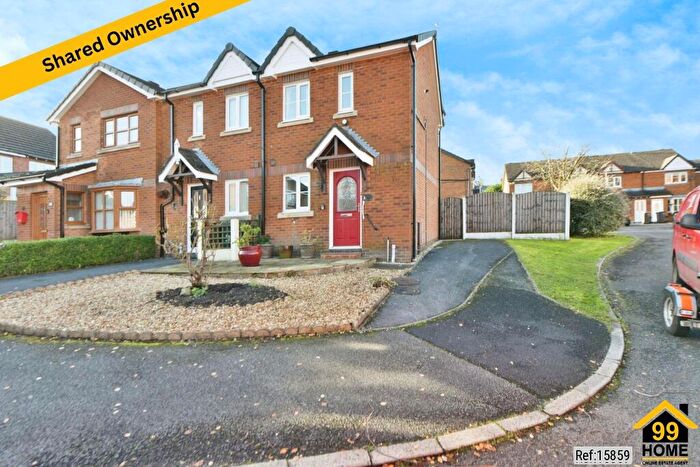
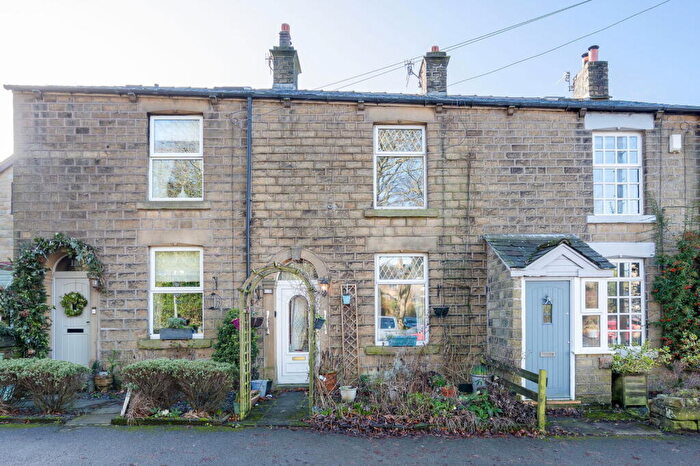
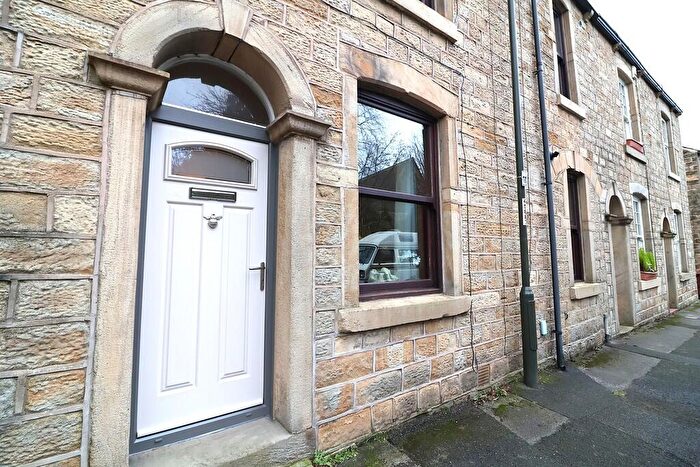
Properties for sale in Padfield
Roads and Postcodes in Padfield
Navigate through our locations to find the location of your next house in Padfield, Glossop for sale or to rent.
| Streets | Postcodes |
|---|---|
| Albert Street | SK13 1DA |
| Bank Bottom | SK13 1BX SK13 1BY |
| Barber Street | SK13 1EG |
| Blenheim Close | SK13 1QY |
| Brickfield Street | SK13 1DZ |
| Brosscroft | SK13 1HE SK13 1DS |
| Brosscroft Close | SK13 1GA |
| Chesham Close | SK13 1QX |
| Church Street | SK13 2AD SK13 2AE |
| Crowden Drive | SK13 1DN |
| Damside | SK13 1HL |
| Ehlinger Avenue | SK13 1BL |
| Evesham Avenue | SK13 1QP |
| Gawsworth Close | SK13 1QT |
| Gladstone Street | SK13 2AF |
| Hadfield Road | SK13 2AG |
| Hazelwood Close | SK13 1DT |
| Jackson Street | SK13 1EU |
| Jones Street | SK13 1BZ |
| Kingsmoor Court | SK13 2BF |
| Lambgates | SK13 1AT |
| Lambgates Lane | SK13 1AS SK13 1DR |
| Langley Court | SK13 1QR |
| Lees Row | SK13 1EN |
| Maguire Avenue | SK13 1DE |
| Malvern Rise | SK13 1QW |
| Marlow Street | SK13 2AQ |
| Masons Grove | SK13 1BH |
| Osborne Place | SK13 1DQ |
| Padfield Main Road | SK13 1ET SK13 1EZ |
| Park Road | SK13 2AH SK13 1EP |
| Peel Street | SK13 1ES |
| Pingot Lane | SK13 1AH |
| Platt Street | SK13 1DW SK13 1EJ SK13 1EY SK13 1EB |
| Post Street | SK13 1DY SK13 1EF |
| Railway Street | SK13 2AA |
| Redfern Close | SK13 1DF |
| Redgate | SK13 1EW |
| Regent Street | SK13 1EH |
| Rhodes Street | SK13 1EQ |
| Rhodes Top | SK13 1GE SK13 1GH |
| Rhodeswood Drive | SK13 1BD |
| Richmond Close | SK13 1EA |
| South Marlow Street | SK13 2AL |
| Station Road | SK13 1AA SK13 1AR SK13 1DB SK13 1DL |
| Sutton Way | SK13 1QS |
| Temple Avenue | SK13 1EE |
| Temple Street | SK13 1EL SK13 1EX |
| Torside Mews | SK13 1GB |
| Torside Way | SK13 1BN |
| Trail View | SK13 1DU |
| Vale House Drive | SK13 1BT SK13 1DD |
| Valemount | SK13 1DP |
| Victoria Avenue | SK13 1BJ |
| Wilmans Walk | SK13 1BF |
| SK13 1ER |
Transport near Padfield
- FAQ
- Price Paid By Year
- Property Type Price
Frequently asked questions about Padfield
What is the average price for a property for sale in Padfield?
The average price for a property for sale in Padfield is £244,791. This amount is 9% lower than the average price in Glossop. There are 736 property listings for sale in Padfield.
What streets have the most expensive properties for sale in Padfield?
The streets with the most expensive properties for sale in Padfield are Blenheim Close at an average of £458,000, Chesham Close at an average of £422,000 and Valemount at an average of £409,987.
What streets have the most affordable properties for sale in Padfield?
The streets with the most affordable properties for sale in Padfield are Torside Mews at an average of £120,200, Station Road at an average of £155,250 and Railway Street at an average of £177,156.
Which train stations are available in or near Padfield?
Some of the train stations available in or near Padfield are Hadfield, Dinting and Glossop.
Property Price Paid in Padfield by Year
The average sold property price by year was:
| Year | Average Sold Price | Price Change |
Sold Properties
|
|---|---|---|---|
| 2025 | £240,158 | -13% |
41 Properties |
| 2024 | £270,382 | 17% |
39 Properties |
| 2023 | £225,551 | -6% |
42 Properties |
| 2022 | £238,234 | 15% |
44 Properties |
| 2021 | £202,396 | 9% |
72 Properties |
| 2020 | £183,975 | 4% |
52 Properties |
| 2019 | £177,056 | 14% |
40 Properties |
| 2018 | £153,003 | -3% |
51 Properties |
| 2017 | £157,404 | -7% |
55 Properties |
| 2016 | £168,099 | 12% |
57 Properties |
| 2015 | £147,230 | 7% |
60 Properties |
| 2014 | £136,537 | 13% |
61 Properties |
| 2013 | £119,044 | -7% |
46 Properties |
| 2012 | £127,493 | -10% |
33 Properties |
| 2011 | £139,770 | 12% |
29 Properties |
| 2010 | £123,207 | 1% |
33 Properties |
| 2009 | £122,294 | -24% |
19 Properties |
| 2008 | £151,251 | 5% |
43 Properties |
| 2007 | £143,268 | 16% |
71 Properties |
| 2006 | £120,893 | 4% |
107 Properties |
| 2005 | £116,452 | 2% |
65 Properties |
| 2004 | £114,206 | 4% |
94 Properties |
| 2003 | £109,129 | 11% |
88 Properties |
| 2002 | £96,655 | 24% |
107 Properties |
| 2001 | £73,011 | 15% |
78 Properties |
| 2000 | £62,068 | 6% |
85 Properties |
| 1999 | £58,514 | 5% |
108 Properties |
| 1998 | £55,732 | 7% |
94 Properties |
| 1997 | £52,061 | -6% |
80 Properties |
| 1996 | £55,204 | -9% |
60 Properties |
| 1995 | £59,963 | - |
64 Properties |
Property Price per Property Type in Padfield
Here you can find historic sold price data in order to help with your property search.
The average Property Paid Price for specific property types in the last three years are:
| Property Type | Average Sold Price | Sold Properties |
|---|---|---|
| Semi Detached House | £251,740.00 | 27 Semi Detached Houses |
| Detached House | £419,830.00 | 18 Detached Houses |
| Terraced House | £211,353.00 | 64 Terraced Houses |
| Flat | £152,615.00 | 13 Flats |

