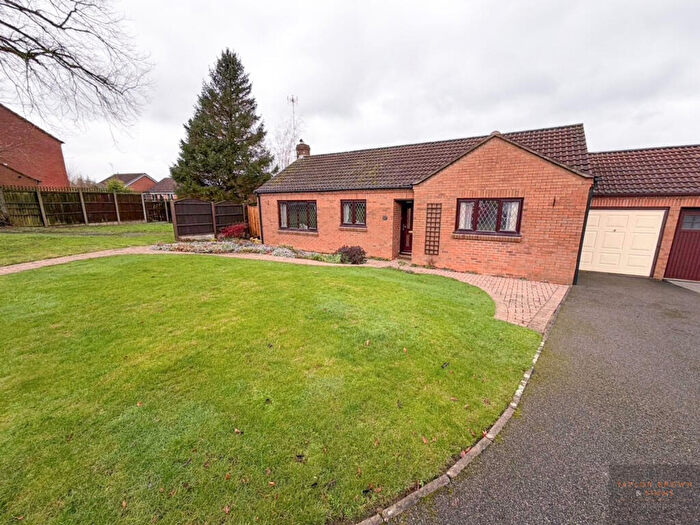
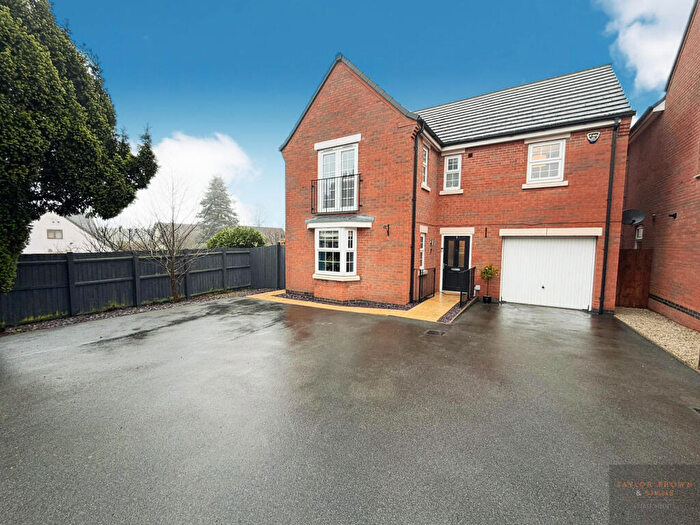
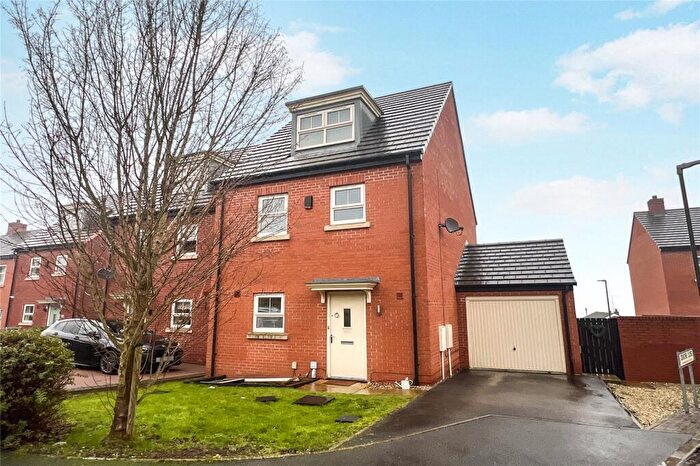
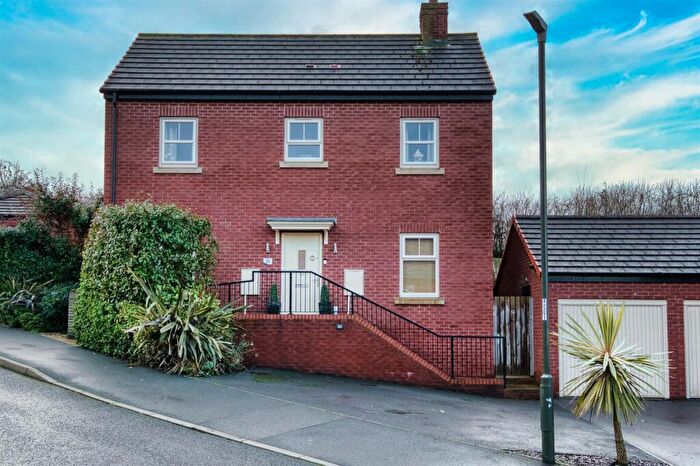
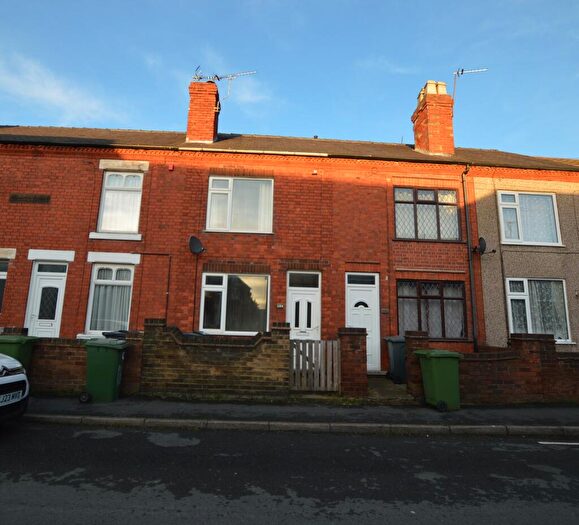
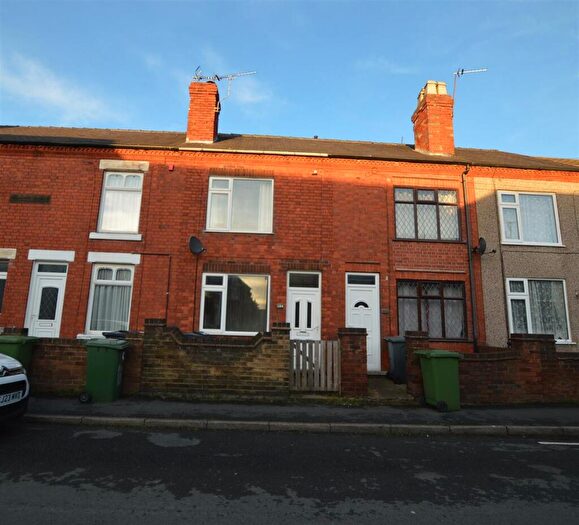
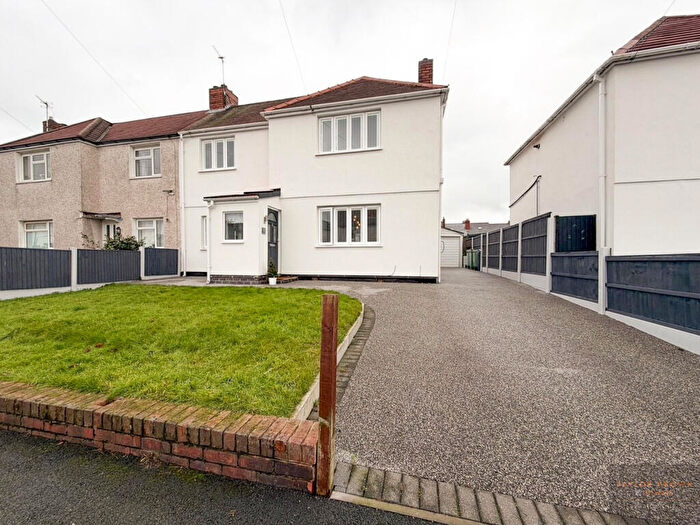
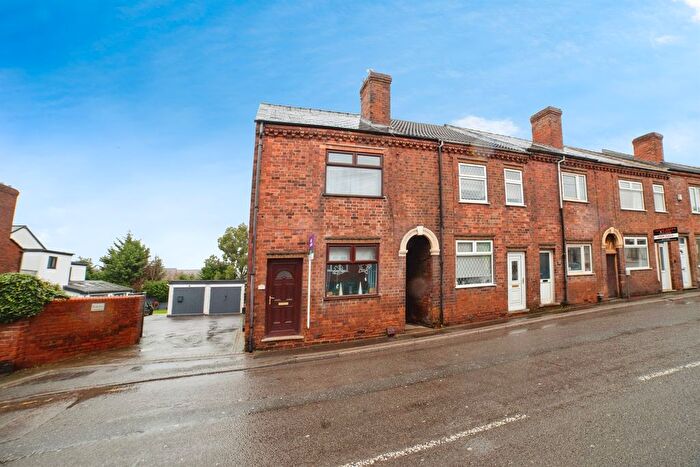
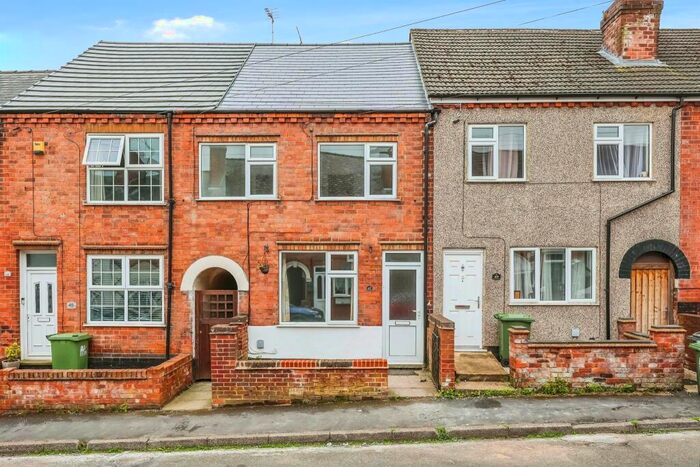
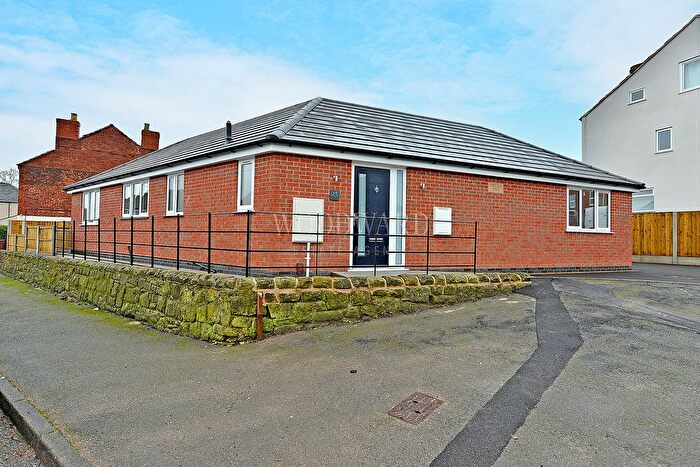
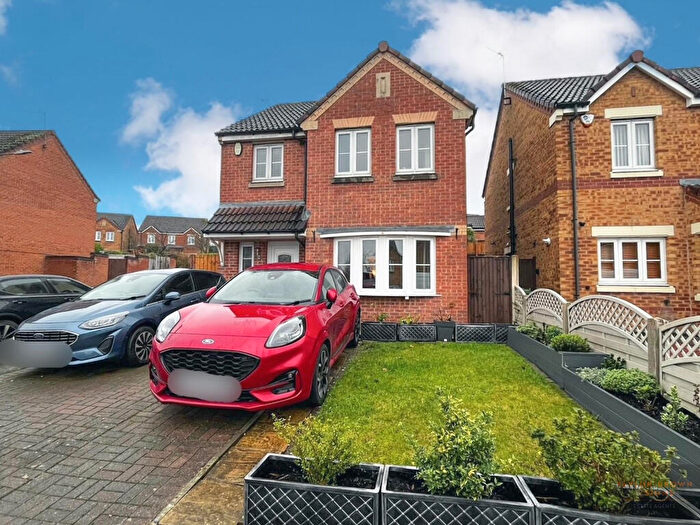
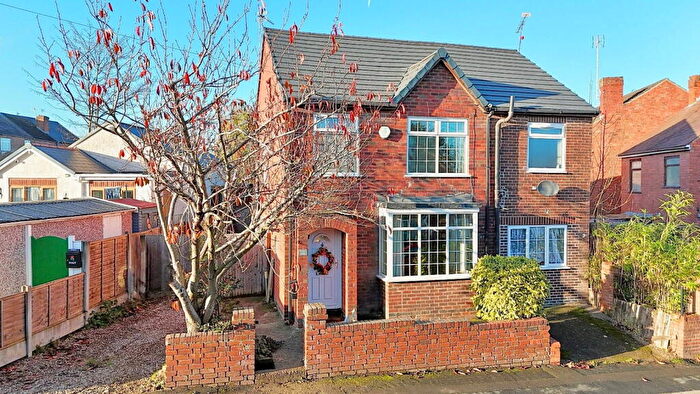
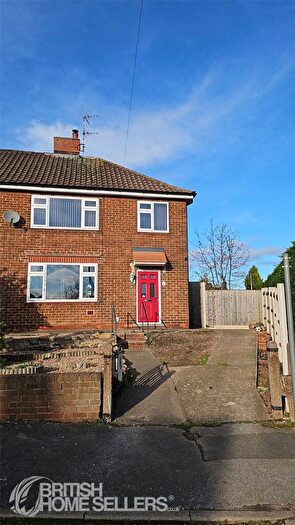
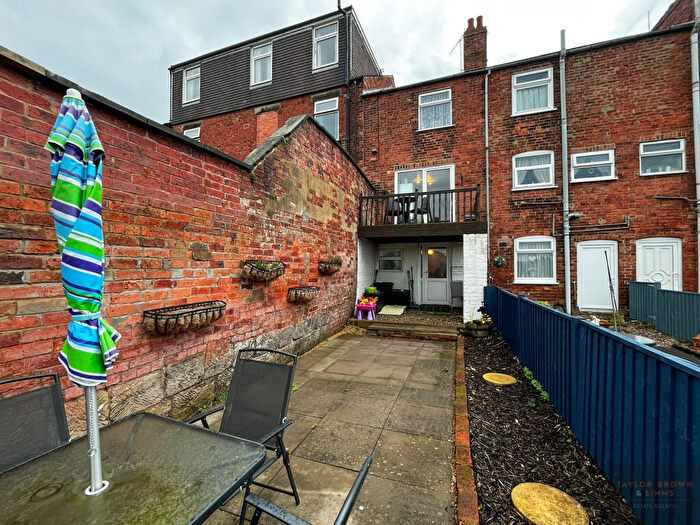
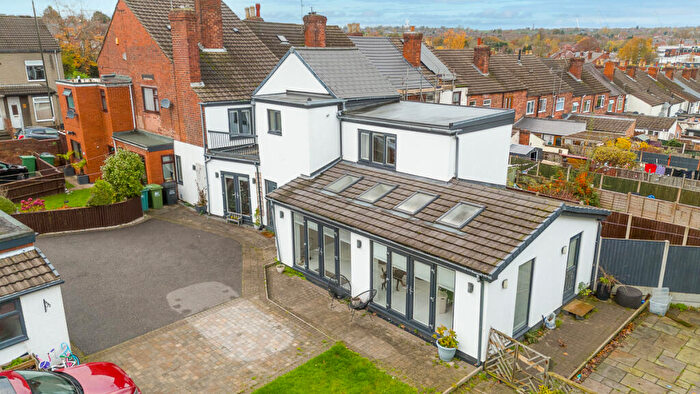
Houses for sale & to rent in Heanor And Loscoe, Heanor
House Prices in Heanor And Loscoe
Properties in Heanor And Loscoe have an average house price of £189,788.00 and had 213 Property Transactions within the last 3 years¹.
Heanor And Loscoe is an area in Heanor, Derbyshire with 2,120 households², where the most expensive property was sold for £475,000.00.
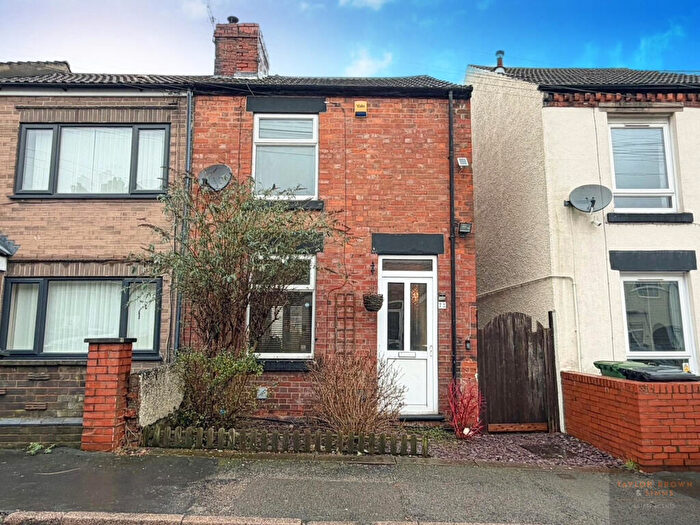
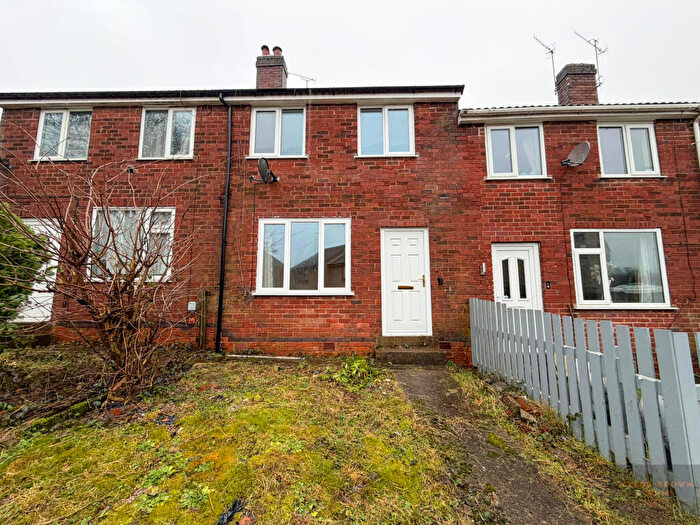
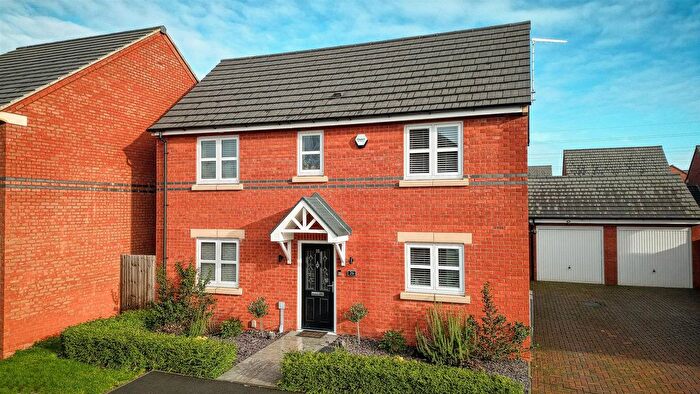
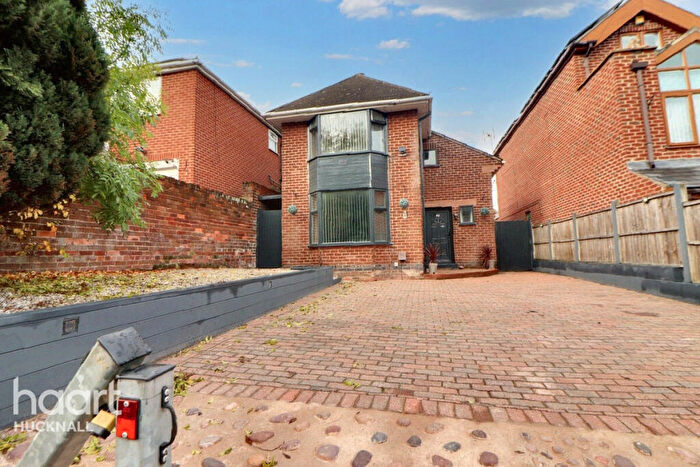
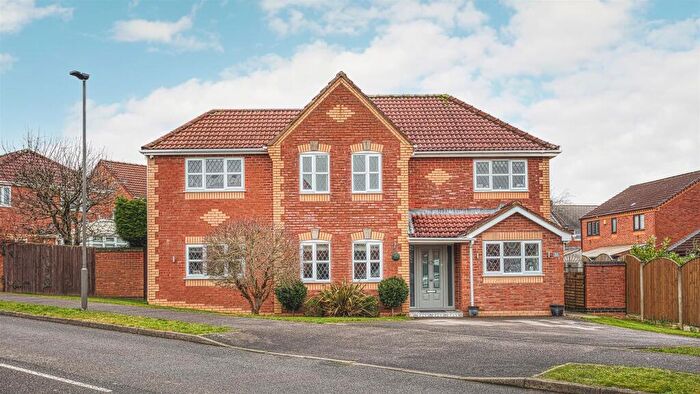
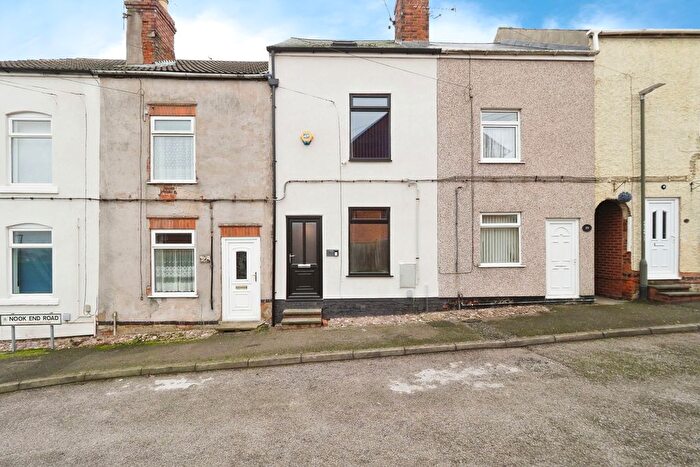
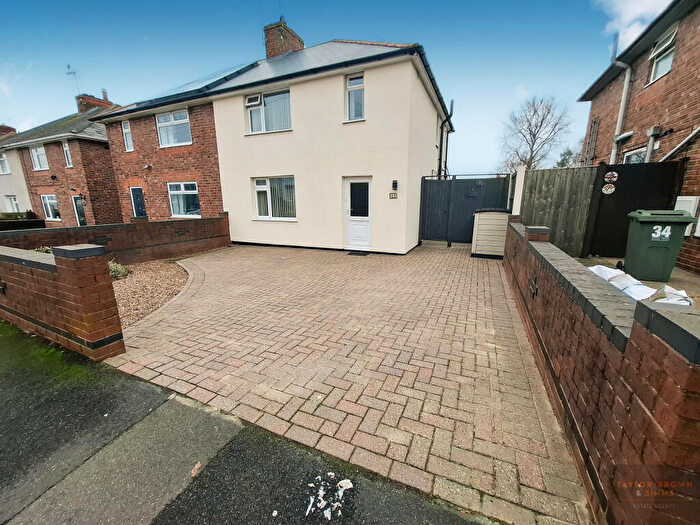
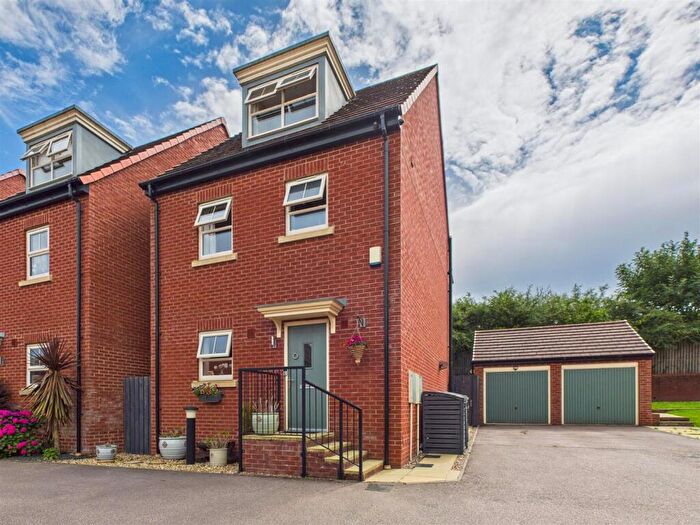
Properties for sale in Heanor And Loscoe
Roads and Postcodes in Heanor And Loscoe
Navigate through our locations to find the location of your next house in Heanor And Loscoe, Heanor for sale or to rent.
| Streets | Postcodes |
|---|---|
| Allandale Road | DE75 7FH |
| Bailey Close | DE75 7SQ |
| Belfield Court | DE75 7LB |
| Berle Avenue | DE75 7PS |
| Birchwood | DE75 7NN |
| Brook Street | DE75 7LP |
| Burns Street | DE75 7FY |
| Burton Street | DE75 7PJ |
| Calladine Close | DE75 7EW |
| Carlyle Gardens | DE75 7WN |
| Carlyle Place | DE75 7GJ |
| Carlyle Street | DE75 7FZ |
| Church View | DE75 7RT |
| Clarke Avenue | DE75 7GA |
| Clayton Grove | DE75 7LT |
| Douglas Avenue | DE75 7FQ |
| Douglas Gardens | DE75 7NW |
| Draycott Close | DE75 7LW |
| Egreaves Avenue | DE75 7RS |
| Fall Road | DE75 7PQ |
| Flamstead Avenue | DE75 7RN DE75 7RP |
| Fletcher Street | DE75 7PE DE75 7PG |
| Ford Avenue | DE75 7LR |
| Furnace Lane | DE75 7LD |
| Gladstone Avenue | DE75 7PU DE75 7SL |
| Gladstone Street | DE75 7PW DE75 7PX |
| Grandfield Street | DE75 7LS |
| Grange Gardens | DE75 7AE |
| Gregg Avenue | DE75 7QA |
| Groome Avenue | DE75 7RR |
| Heanor Road | DE75 7JT |
| High Street | DE75 7LE DE75 7LF DE75 7LG DE75 7EZ |
| Highfield Close | DE75 7LA |
| Holmes Street | DE75 7FS |
| Hunt Avenue | DE75 7QB |
| Joan Avenue | DE75 7PL |
| Kirkman Road | DE75 7LH |
| Lake Avenue | DE75 7LJ |
| Lake Gardens | DE75 7JN |
| Leniscar Avenue | DE75 7RQ |
| Longbridge Lane | DE75 7GH |
| Loscoe Denby Lane | DE75 7RW DE75 7RX |
| Loscoe Grange | DE75 7JY DE75 7JZ |
| Loscoe Road | DE75 7FF DE75 7FG |
| Lower Gladstone Street | DE75 7PT |
| Midland Road | DE75 7PN |
| Milward Road | DE75 7FR DE75 7JW DE75 7JX |
| Newlands Drive | DE75 7PR |
| Northern Road | DE75 7FP DE75 7WA |
| Old School Court-denby Lane | DE75 7SH |
| Purchase Avenue | DE75 7GB |
| Queens Avenue | DE75 7EU |
| Sheldon Road | DE75 7LL |
| Sir John Warren Way | DE75 7PD |
| Sough Wood Close | DE75 7WJ |
| Springfield Avenue | DE75 7LN |
| Tantum Avenue | DE75 7LU |
| Taylor Lane | DE75 7AB DE75 7TA |
| The Gardens | DE75 7ND |
| The Hamlet | DE75 7UU |
| The Nook | DE75 7LQ |
| Tudor Falls | DE75 7TE |
| Watkinson Street | DE75 7FX |
| Wellington Street | DE75 7FW |
| Whysall Street | DE75 7PY |
| Wilson Avenue | DE75 7RU |
| Windsor Close | DE75 7TD |
| Wood End Road | DE75 7PP |
| Zouche Close | DE75 7WL |
| DE75 7WR |
Transport near Heanor And Loscoe
- FAQ
- Price Paid By Year
- Property Type Price
Frequently asked questions about Heanor And Loscoe
What is the average price for a property for sale in Heanor And Loscoe?
The average price for a property for sale in Heanor And Loscoe is £189,788. This amount is 5% lower than the average price in Heanor. There are 683 property listings for sale in Heanor And Loscoe.
What streets have the most expensive properties for sale in Heanor And Loscoe?
The streets with the most expensive properties for sale in Heanor And Loscoe are Ford Avenue at an average of £389,333, Grange Gardens at an average of £317,500 and Sough Wood Close at an average of £315,000.
What streets have the most affordable properties for sale in Heanor And Loscoe?
The streets with the most affordable properties for sale in Heanor And Loscoe are Holmes Street at an average of £115,916, Loscoe Road at an average of £116,318 and Joan Avenue at an average of £129,700.
Which train stations are available in or near Heanor And Loscoe?
Some of the train stations available in or near Heanor And Loscoe are Langley Mill, Ilkeston and Belper.
Property Price Paid in Heanor And Loscoe by Year
The average sold property price by year was:
| Year | Average Sold Price | Price Change |
Sold Properties
|
|---|---|---|---|
| 2025 | £193,021 | 3% |
67 Properties |
| 2024 | £187,091 | -1% |
57 Properties |
| 2023 | £189,082 | 3% |
89 Properties |
| 2022 | £183,531 | 2% |
129 Properties |
| 2021 | £180,531 | 12% |
113 Properties |
| 2020 | £158,419 | 5% |
87 Properties |
| 2019 | £150,243 | 11% |
110 Properties |
| 2018 | £133,329 | 3% |
77 Properties |
| 2017 | £129,114 | -2% |
94 Properties |
| 2016 | £132,176 | -1% |
99 Properties |
| 2015 | £133,258 | 14% |
120 Properties |
| 2014 | £113,943 | 9% |
83 Properties |
| 2013 | £103,650 | 3% |
76 Properties |
| 2012 | £100,737 | -10% |
49 Properties |
| 2011 | £110,550 | 5% |
57 Properties |
| 2010 | £104,969 | -11% |
58 Properties |
| 2009 | £116,061 | -13% |
48 Properties |
| 2008 | £131,162 | 9% |
66 Properties |
| 2007 | £119,530 | 4% |
93 Properties |
| 2006 | £114,873 | 5% |
96 Properties |
| 2005 | £109,688 | 15% |
96 Properties |
| 2004 | £93,728 | 19% |
96 Properties |
| 2003 | £76,310 | 23% |
111 Properties |
| 2002 | £58,443 | 17% |
121 Properties |
| 2001 | £48,668 | 8% |
90 Properties |
| 2000 | £44,781 | 4% |
110 Properties |
| 1999 | £42,872 | 15% |
84 Properties |
| 1998 | £36,585 | -3% |
88 Properties |
| 1997 | £37,706 | 4% |
76 Properties |
| 1996 | £36,281 | 5% |
77 Properties |
| 1995 | £34,529 | - |
81 Properties |
Property Price per Property Type in Heanor And Loscoe
Here you can find historic sold price data in order to help with your property search.
The average Property Paid Price for specific property types in the last three years are:
| Property Type | Average Sold Price | Sold Properties |
|---|---|---|
| Semi Detached House | £174,704.00 | 80 Semi Detached Houses |
| Detached House | £255,823.00 | 64 Detached Houses |
| Terraced House | £146,028.00 | 69 Terraced Houses |

