
Houses for sale in Heanor, Derbyshire
House Prices in Heanor
Properties in Heanor have an average house price of £199k and had 788 Property Transactions within the last 3 years.¹
Heanor is an area in Derbyshire with 8,278 households², where the most expensive property was sold for £1.14M.
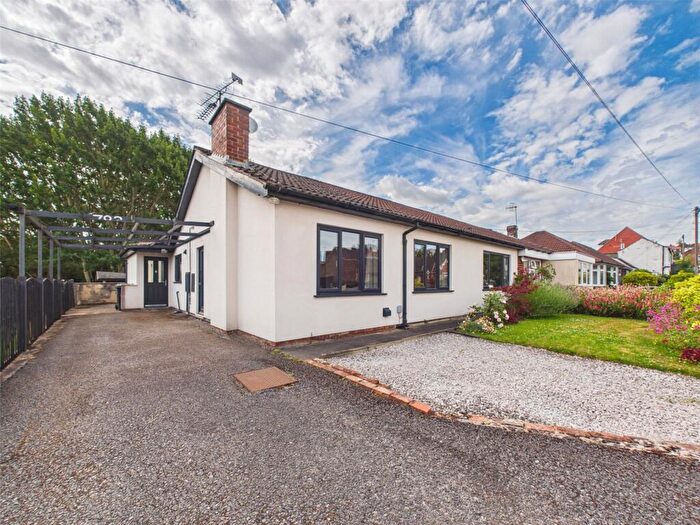
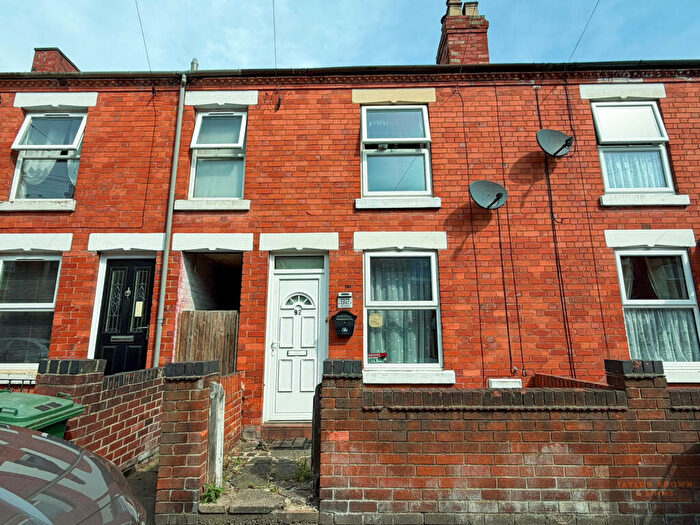
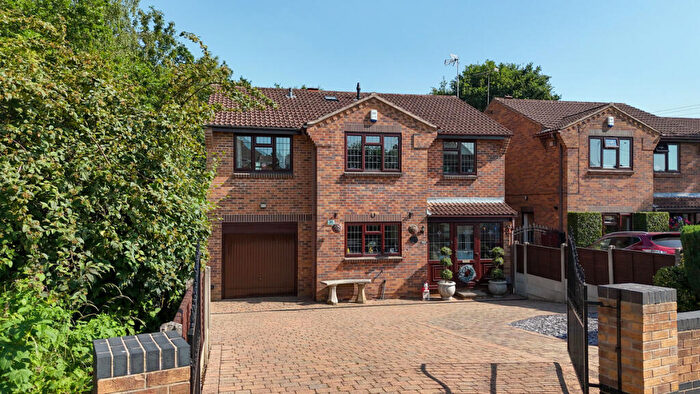
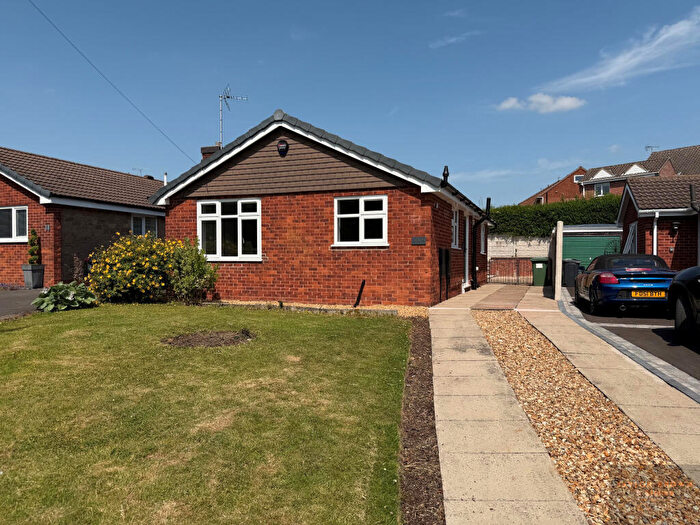
Properties for sale in Heanor
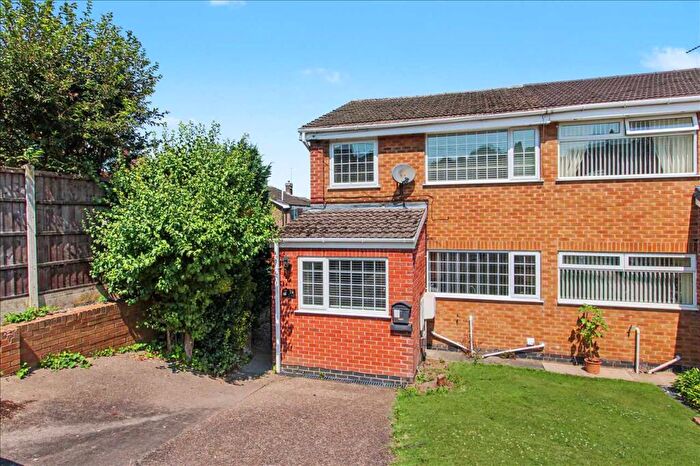

![]()
If you are looking to sell your house, let it out, or receive a property valuation, an expert can help you.
Click the button below to get started.
Neighbourhoods in Heanor
Navigate through our locations to find the location of your next house in Heanor, Derbyshire for sale or to rent.
Property price trends in Heanor
According to the latest Land Registry data, the average home in Heanor sold for £167,571 in 2026. That figure comes from a substantial record of 10,360 sales logged over the past 31 years.
Prices have fallen back over the last three years. Compared with 2023, when the typical sale came in around £184,678, that's a fall of roughly 9.3%.
Looking back five years, average prices are down about 9% since 2021, a drop of around £16,585 in cash terms.
Zoom out to the past decade for the fuller picture. Back in 2016, homes here averaged £134,914, so the typical sold price has climbed about 24.2% since then, roughly 2.2% a year. Stretch the view to fifteen years and that annual pace holds at about 2.2%.
Frequently asked questions about Heanor
What is the average price for a property for sale in Heanor?
The average price for a property for sale in Heanor is £199,252. This amount is 21% lower than the average price in Derbyshire. There are 2,236 property listings for sale in Heanor.
What locations have the most expensive properties for sale in Heanor?
The locations with the most expensive properties for sale in Heanor are Shipley Park, Horsley And Horsley Woodhouse at an average of £297,234 and Heanor East at an average of £201,924.
What locations have the most affordable properties for sale in Heanor?
The locations with the most affordable properties for sale in Heanor are Heanor West at an average of £183,831 and Heanor And Loscoe at an average of £188,809.
Which train stations are available in or near Heanor?
Some of the train stations available in or near Heanor are Langley Mill, Ilkeston and Belper.
Property Price Paid in Heanor by Year
The average sold property price by year was:
| Year | Average Sold Price | Price Change |
Sold Properties
|
|---|---|---|---|
| 2026 | £167,571 | -23% |
7 Properties |
| 2025 | £206,096 | -1% |
288 Properties |
| 2024 | £208,109 | 11% |
232 Properties |
| 2023 | £184,678 | -4% |
261 Properties |
| 2022 | £191,340 | 4% |
366 Properties |
| 2021 | £184,156 | 14% |
364 Properties |
| 2020 | £158,908 | 3% |
284 Properties |
| 2019 | £154,182 | 6% |
359 Properties |
| 2018 | £145,299 | 2% |
326 Properties |
| 2017 | £142,454 | 5% |
354 Properties |
Property Price per Property Type in Heanor
Here you can find historic sold price data in order to help with your property search.
The average Property Paid Price for specific property types in the last three years are:
| Property Type | Average Sold Price | Sold Properties |
|---|---|---|
| Flat | £106,540.00 | 5 Flats |
| Semi Detached House | £182,479.00 | 272 Semi Detached Houses |
| Detached House | £285,935.00 | 234 Detached Houses |
| Terraced House | £144,169.00 | 277 Terraced Houses |
Transport in Heanor
Please see below transportation links in this area:
