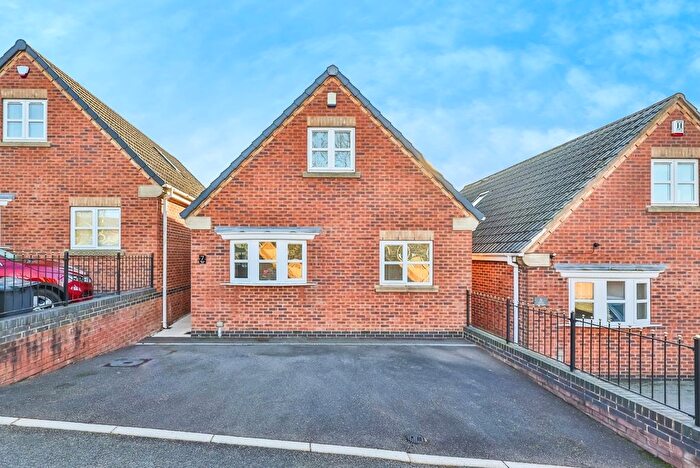
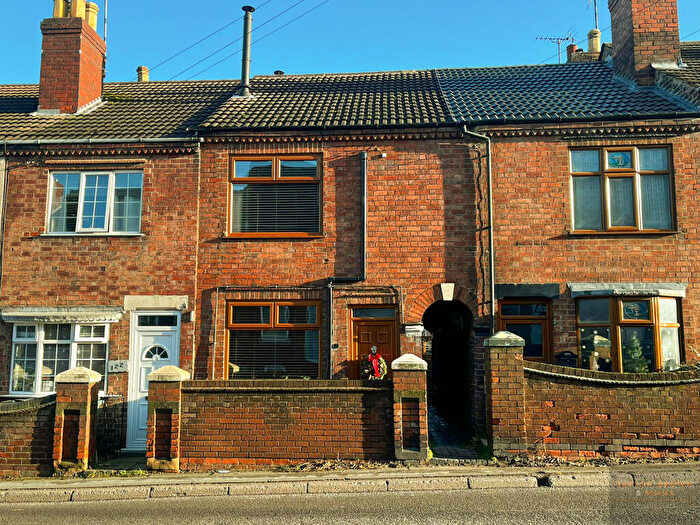
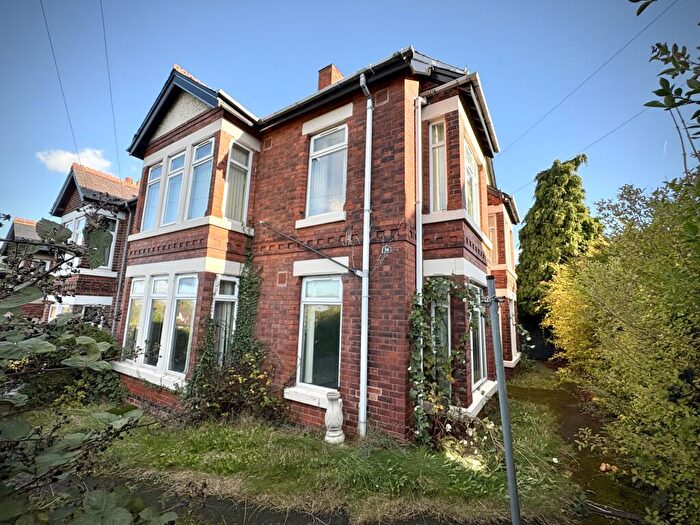
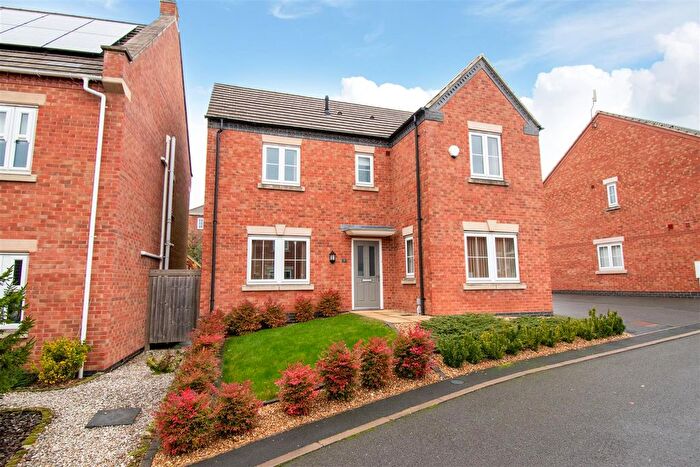
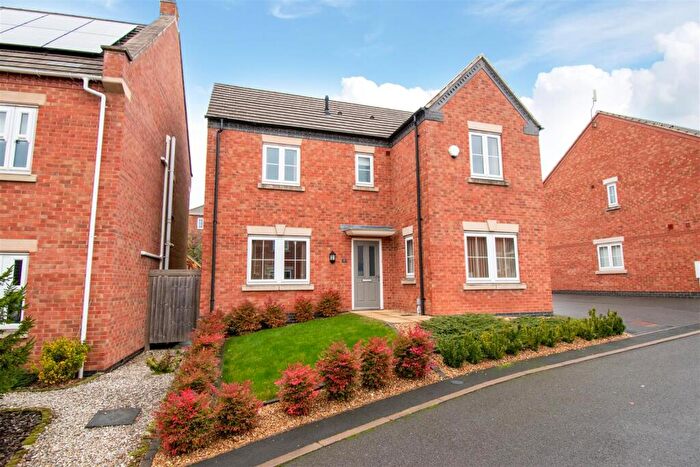
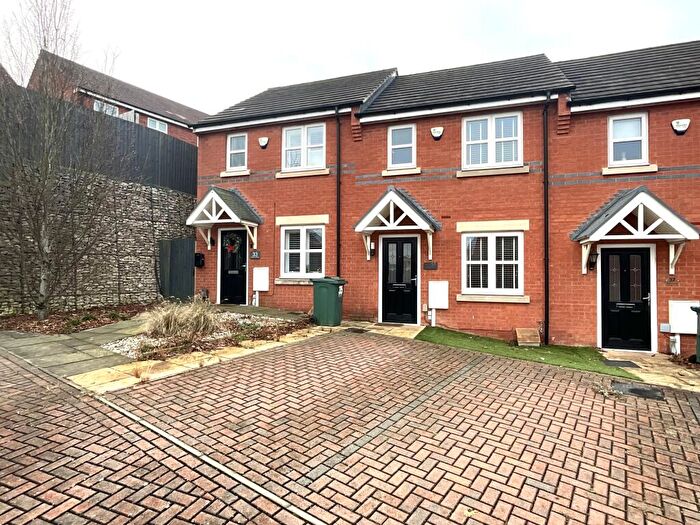
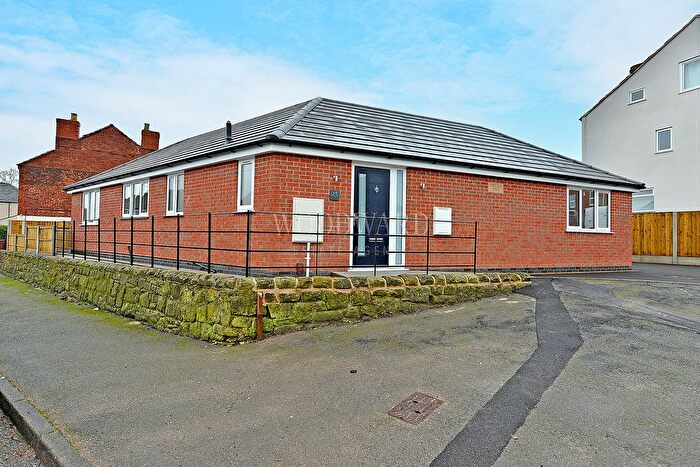
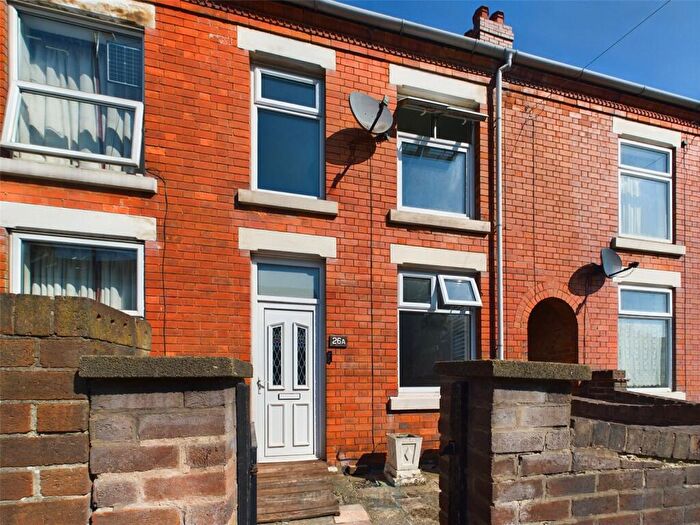
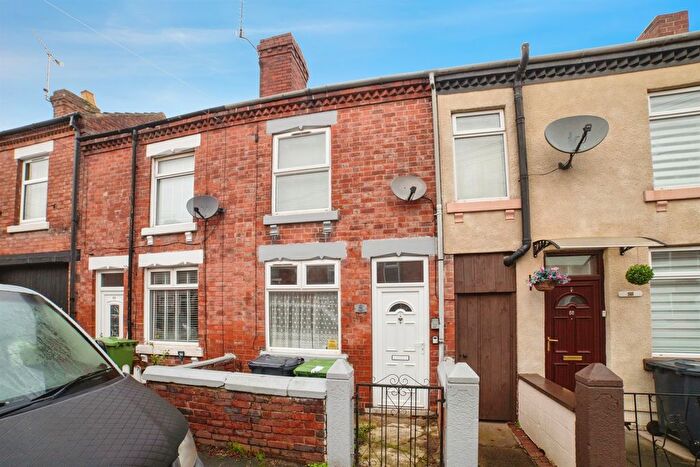
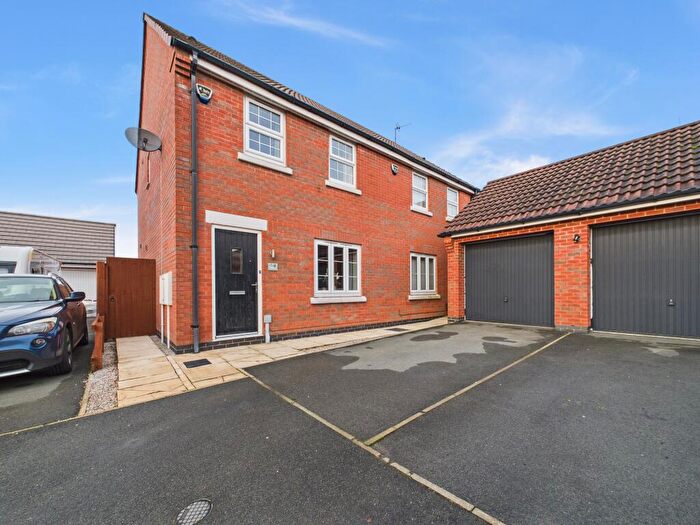
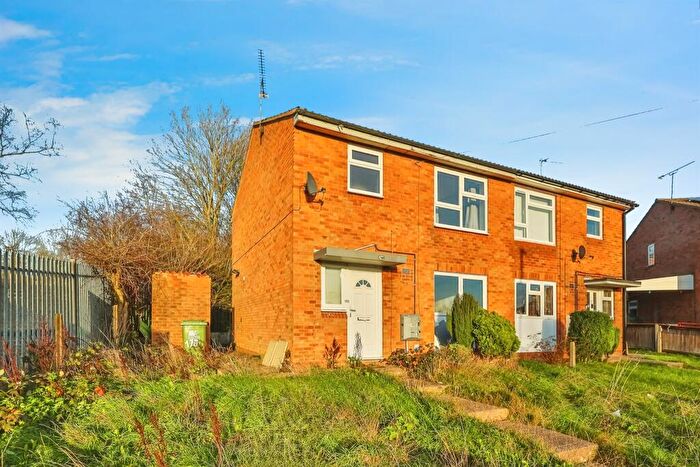
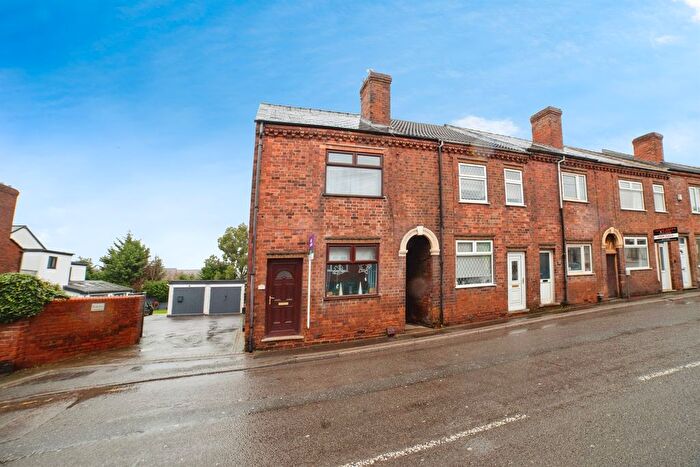
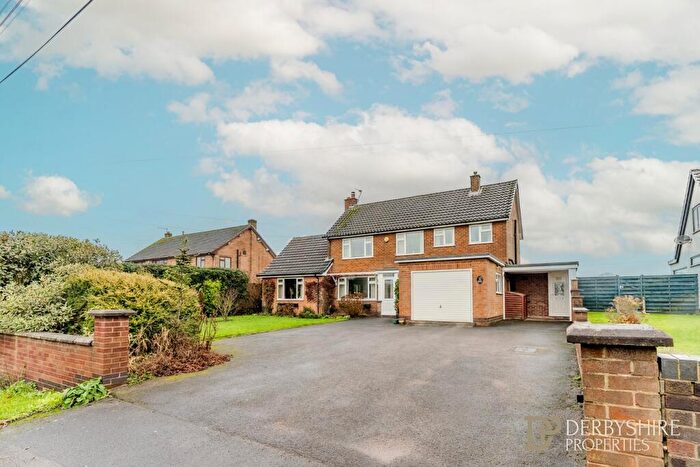
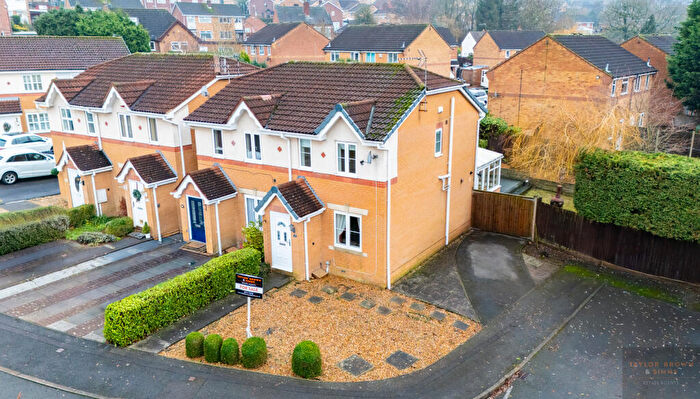
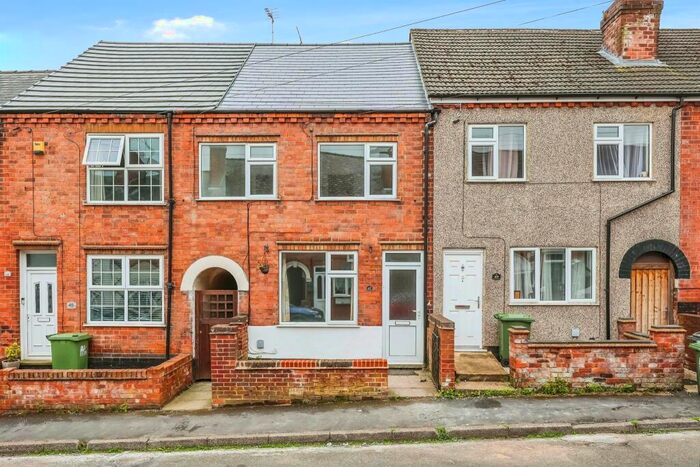
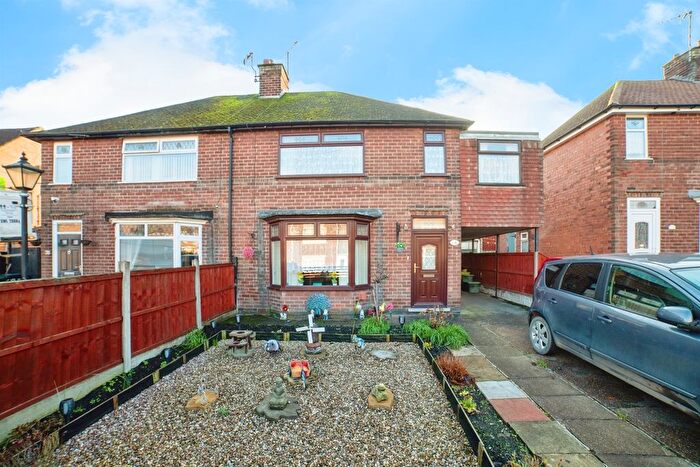
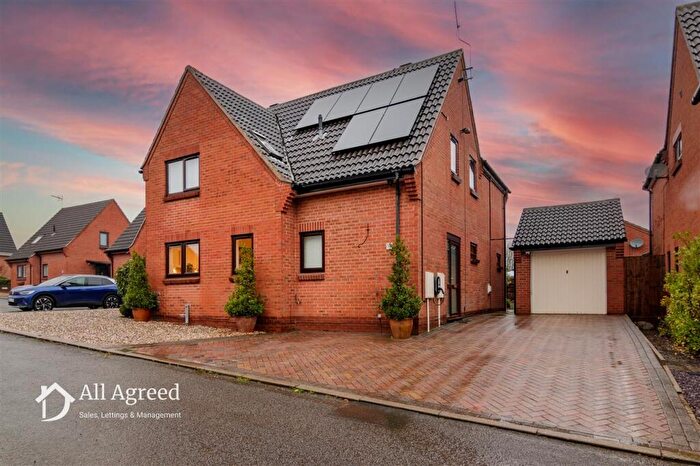
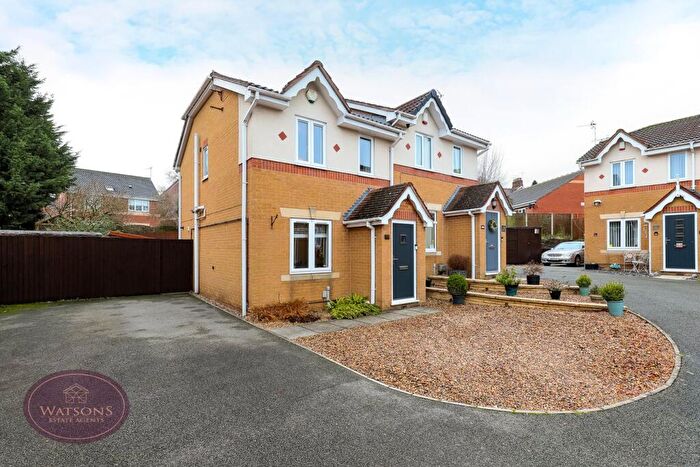
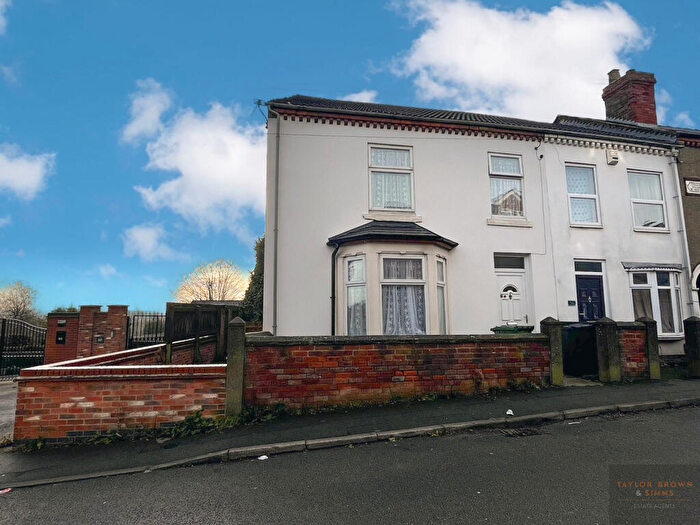
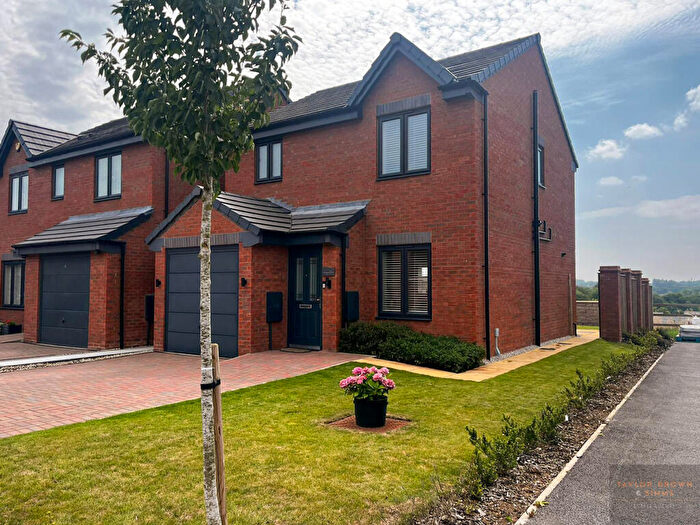
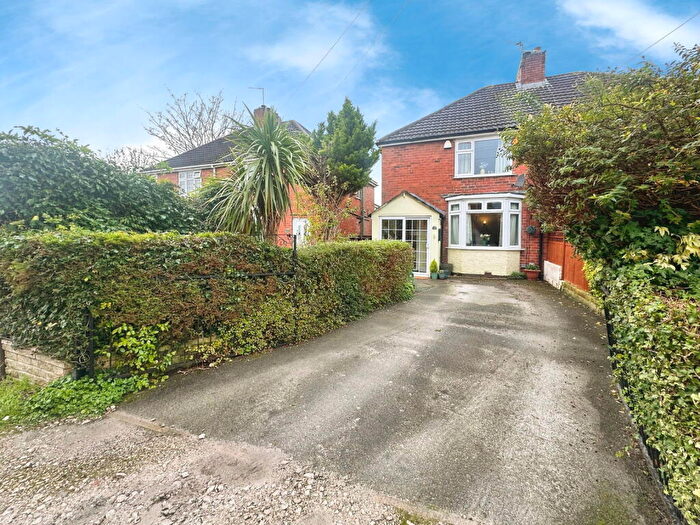
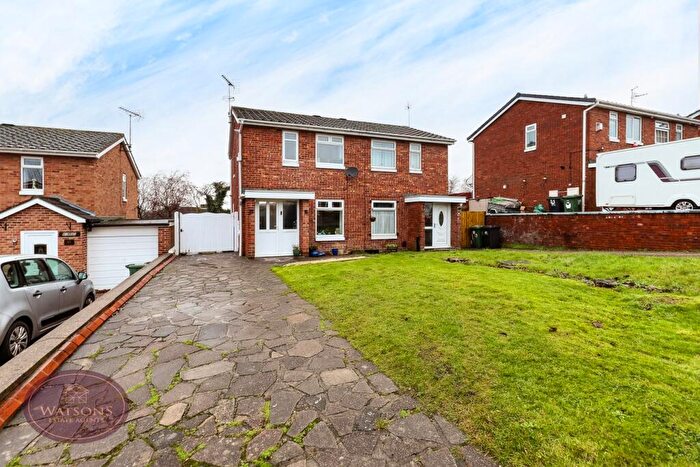
Houses for sale & to rent in Shipley Park, Horsley And Horsley Woodhouse, Heanor
House Prices in Shipley Park, Horsley And Horsley Woodhouse
Properties in Shipley Park, Horsley And Horsley Woodhouse have an average house price of £307,081.00 and had 77 Property Transactions within the last 3 years¹.
Shipley Park, Horsley And Horsley Woodhouse is an area in Heanor, Derbyshire with 634 households², where the most expensive property was sold for £737,500.00.
Properties for sale in Shipley Park, Horsley And Horsley Woodhouse
Roads and Postcodes in Shipley Park, Horsley And Horsley Woodhouse
Navigate through our locations to find the location of your next house in Shipley Park, Horsley And Horsley Woodhouse, Heanor for sale or to rent.
| Streets | Postcodes |
|---|---|
| Adams Close | DE75 7SW |
| Balmoral Close | DE75 7SN |
| Banksburn Close | DE75 7XB |
| Barnes Croft | DE75 7SY |
| Bell Lane | DE75 7JP |
| Buckingham Drive | DE75 7TY |
| Chatsworth Way | DE75 7TJ |
| Delves Road | DE75 7SJ |
| Delves Road Gate Industrial Estate | DE75 7SG |
| Haddon Close | DE75 7TG |
| Hardy Barn | DE75 7JA DE75 7LY |
| Hassock Lane | DE75 7JD |
| Hassock Lane North | DE75 7JB |
| Hassock Lane South | DE75 7JE |
| Heanor Gate | DE75 7QZ |
| Heanor Gate Industrial Estate | DE75 7RJ |
| Heanor Gate Road | DE75 7RG |
| Heanor Road | DE75 7QP DE75 7QY |
| Highgrove Close | DE75 7SF |
| Kedleston Drive | DE75 7TP |
| Kensington Avenue | DE75 7SE |
| Kirkley Drive | DE75 7UR DE75 7RA |
| Lakeside Business Centre | DE75 7JQ |
| Long Lane | DE75 7JF |
| Lower Maples | DE75 7JU |
| Peatburn Avenue | DE75 7RL |
| Pit Lane | DE75 7JL |
| Platts Avenue | DE75 7XD |
| Poynter Close | DE75 7XE |
| Sandringham Drive | DE75 7TZ |
| School Woods Close | DE75 7JS |
| Shipley Park Gardens | DE75 7DZ |
| Sinclair Close | DE75 7SP |
| Slack Lane | DE75 7GX |
| The Field | DE75 7JH DE75 7JJ DE75 7JG |
| The Maples | DE75 7JR |
| Thorpes Road Gate Industrial Estate | DE75 7GY |
| Thorpes Road Industrial Estate | DE75 7EE |
| Twyford Close | DE75 7RZ |
Transport near Shipley Park, Horsley And Horsley Woodhouse
-
Langley Mill Station
-
Ilkeston Station
-
Belper Station
-
Duffield Station
-
Ambergate Station
-
Alfreton Station
-
Bulwell Station
-
Spondon Station
-
Hucknall Station
-
Newstead Station
- FAQ
- Price Paid By Year
- Property Type Price
Frequently asked questions about Shipley Park, Horsley And Horsley Woodhouse
What is the average price for a property for sale in Shipley Park, Horsley And Horsley Woodhouse?
The average price for a property for sale in Shipley Park, Horsley And Horsley Woodhouse is £307,081. This amount is 57% higher than the average price in Heanor. There are 2,022 property listings for sale in Shipley Park, Horsley And Horsley Woodhouse.
What streets have the most expensive properties for sale in Shipley Park, Horsley And Horsley Woodhouse?
The streets with the most expensive properties for sale in Shipley Park, Horsley And Horsley Woodhouse are The Field at an average of £480,800, Hassock Lane North at an average of £347,464 and Sandringham Drive at an average of £327,600.
What streets have the most affordable properties for sale in Shipley Park, Horsley And Horsley Woodhouse?
The streets with the most affordable properties for sale in Shipley Park, Horsley And Horsley Woodhouse are Banksburn Close at an average of £225,000, Peatburn Avenue at an average of £256,750 and Shipley Park Gardens at an average of £259,718.
Which train stations are available in or near Shipley Park, Horsley And Horsley Woodhouse?
Some of the train stations available in or near Shipley Park, Horsley And Horsley Woodhouse are Langley Mill, Ilkeston and Belper.
Property Price Paid in Shipley Park, Horsley And Horsley Woodhouse by Year
The average sold property price by year was:
| Year | Average Sold Price | Price Change |
Sold Properties
|
|---|---|---|---|
| 2025 | £305,203 | -6% |
26 Properties |
| 2024 | £324,500 | 21% |
18 Properties |
| 2023 | £257,519 | -27% |
13 Properties |
| 2022 | £326,062 | 12% |
20 Properties |
| 2021 | £285,364 | 8% |
35 Properties |
| 2020 | £261,806 | 6% |
24 Properties |
| 2019 | £246,863 | 10% |
40 Properties |
| 2018 | £221,258 | -3% |
25 Properties |
| 2017 | £227,626 | 5% |
19 Properties |
| 2016 | £216,813 | 3% |
19 Properties |
| 2015 | £209,460 | -18% |
27 Properties |
| 2014 | £247,241 | 25% |
24 Properties |
| 2013 | £184,987 | 12% |
20 Properties |
| 2012 | £163,707 | -9% |
19 Properties |
| 2011 | £178,756 | -7% |
23 Properties |
| 2010 | £191,764 | -8% |
17 Properties |
| 2009 | £206,274 | 12% |
20 Properties |
| 2008 | £182,339 | -5% |
19 Properties |
| 2007 | £190,663 | -7% |
33 Properties |
| 2006 | £204,137 | -11% |
48 Properties |
| 2005 | £227,418 | 20% |
19 Properties |
| 2004 | £181,060 | 17% |
51 Properties |
| 2003 | £149,445 | 18% |
54 Properties |
| 2002 | £121,858 | 16% |
69 Properties |
| 2001 | £102,407 | 17% |
61 Properties |
| 2000 | £85,102 | 11% |
53 Properties |
| 1999 | £75,627 | 2% |
53 Properties |
| 1998 | £74,176 | -13% |
49 Properties |
| 1997 | £83,677 | 18% |
33 Properties |
| 1996 | £68,490 | 13% |
22 Properties |
| 1995 | £59,444 | - |
9 Properties |
Property Price per Property Type in Shipley Park, Horsley And Horsley Woodhouse
Here you can find historic sold price data in order to help with your property search.
The average Property Paid Price for specific property types in the last three years are:
| Property Type | Average Sold Price | Sold Properties |
|---|---|---|
| Semi Detached House | £260,561.00 | 17 Semi Detached Houses |
| Detached House | £322,968.00 | 55 Detached Houses |
| Terraced House | £290,500.00 | 5 Terraced Houses |

