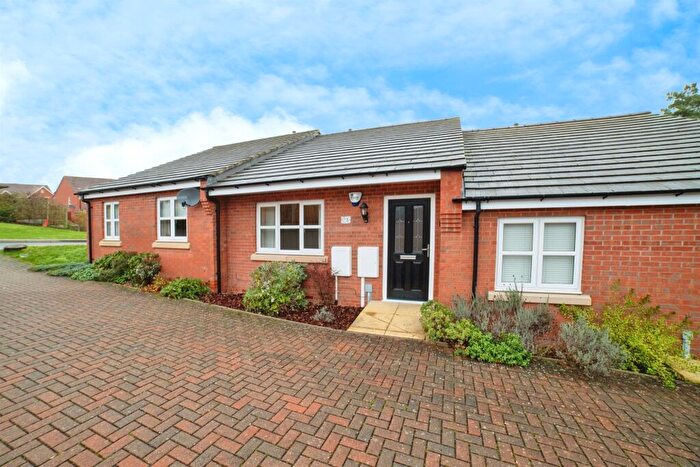
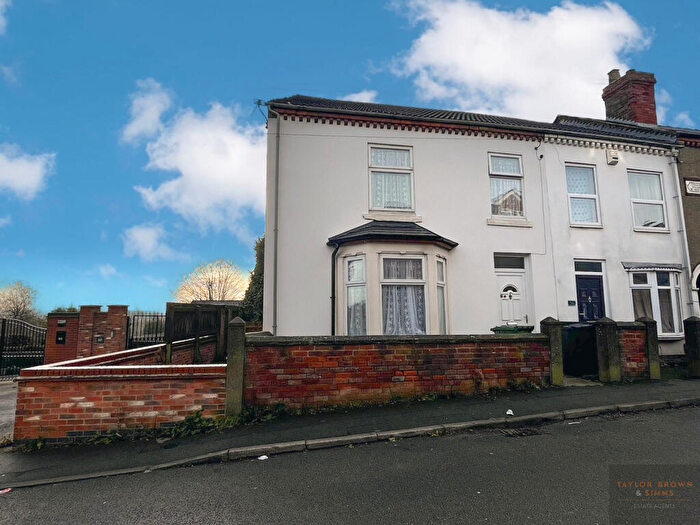
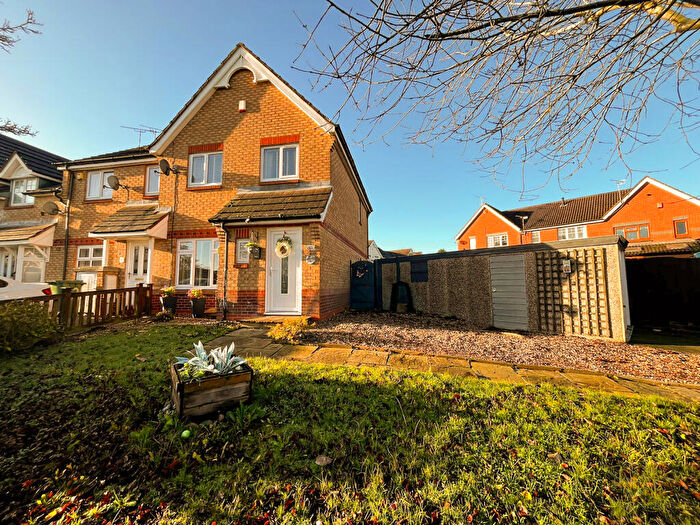
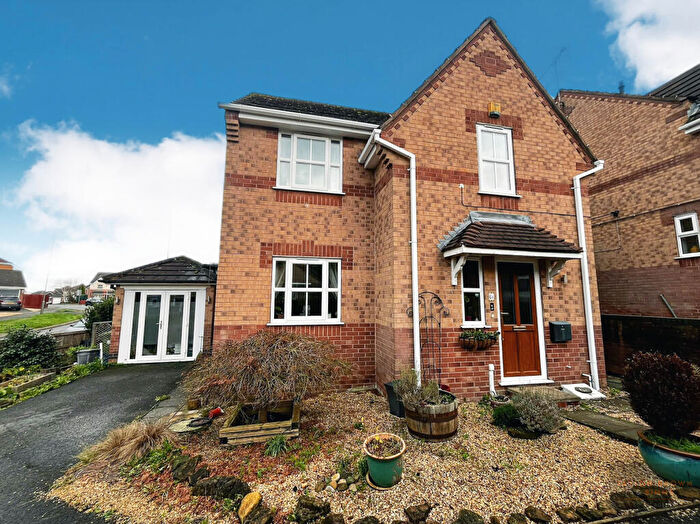
Houses for sale & to rent in Heanor East, Heanor
House Prices in Heanor East
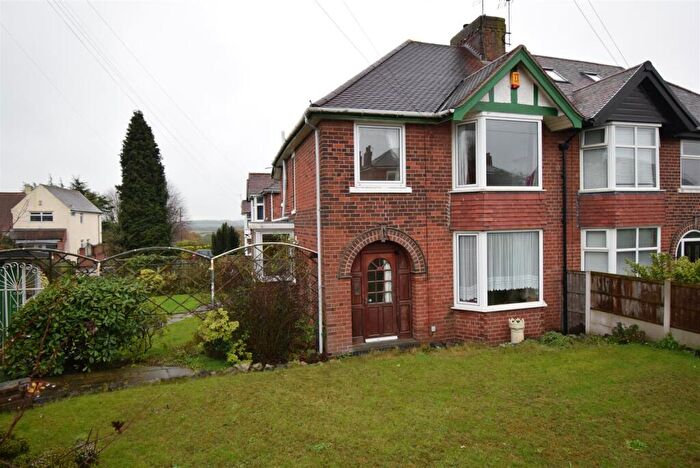
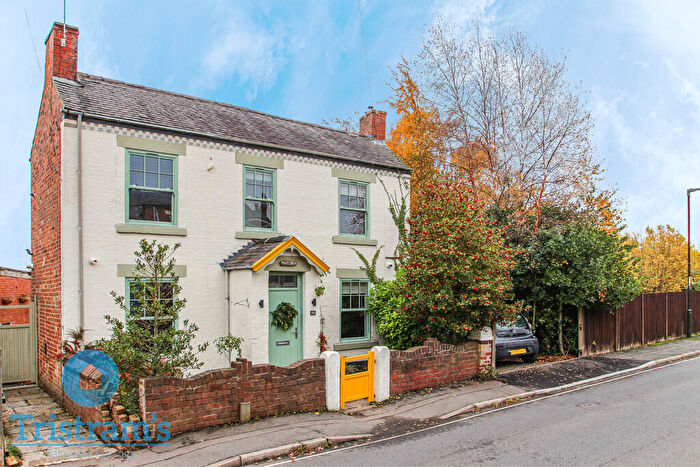
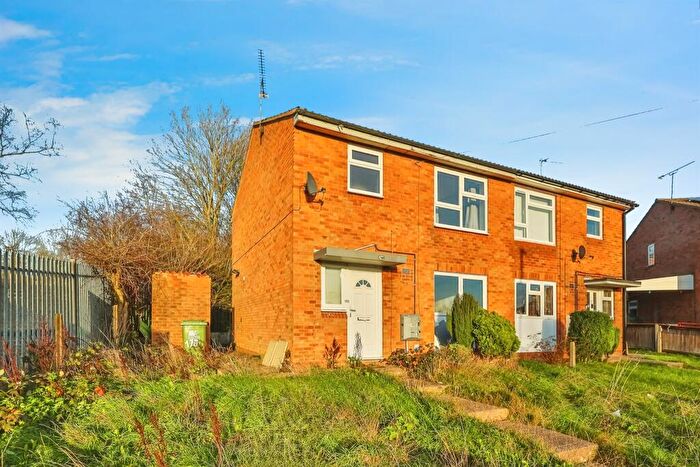
Properties in Heanor East have an average house price of £197,828.00 and had 212 Property Transactions within the last 3 years¹.
Heanor East is an area in Heanor, Derbyshire with 2,501 households², where the most expensive property was sold for £760,000.00.
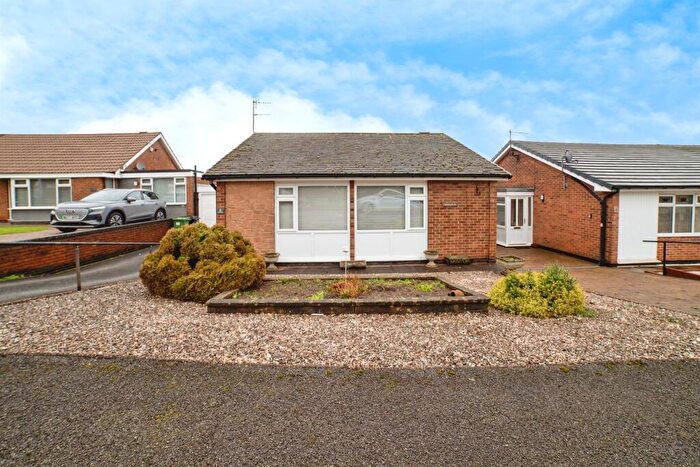
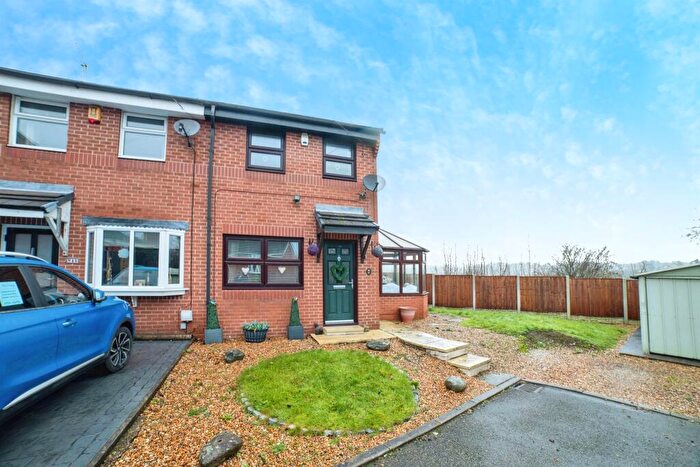
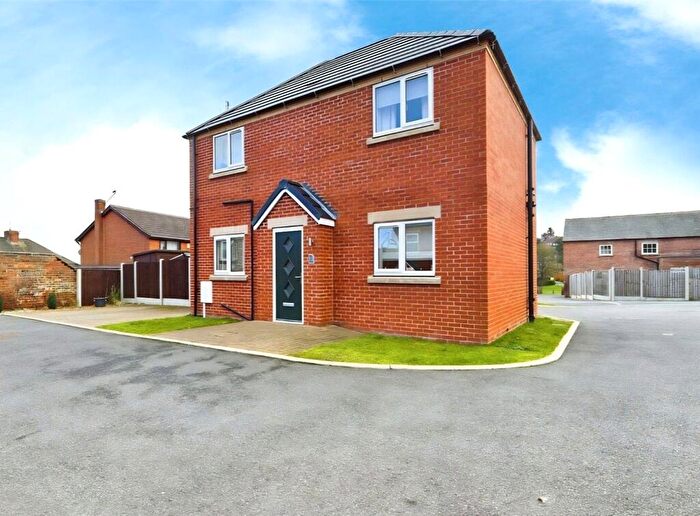
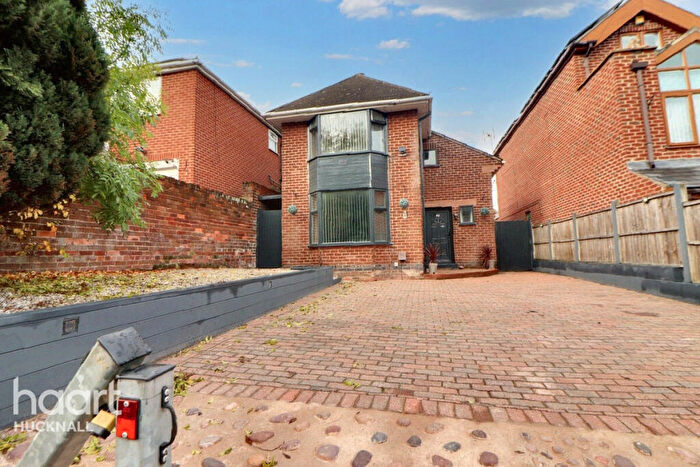
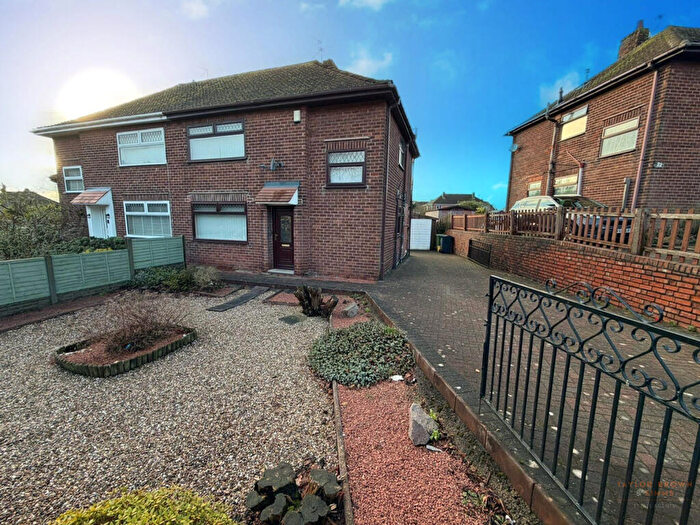
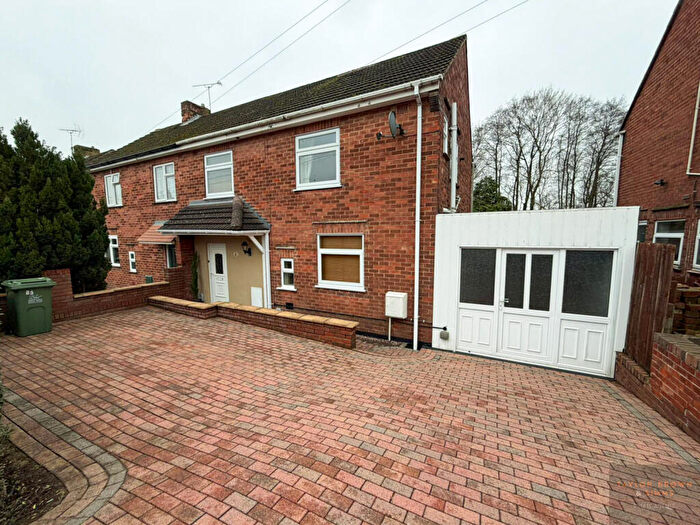
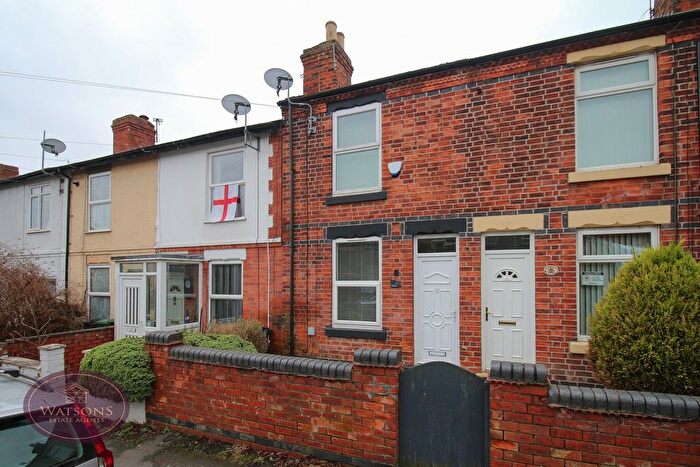
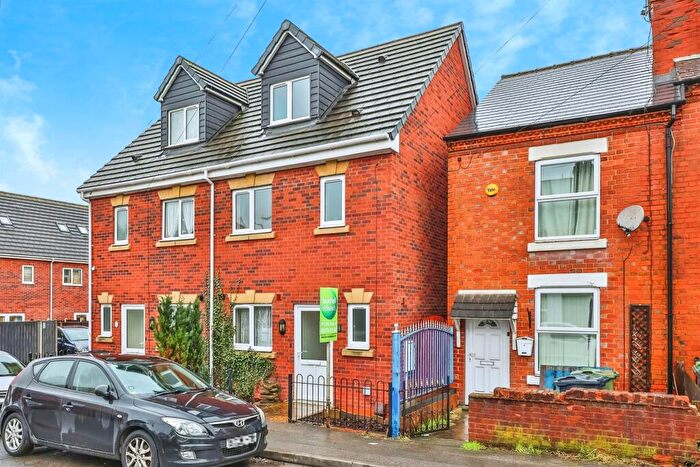
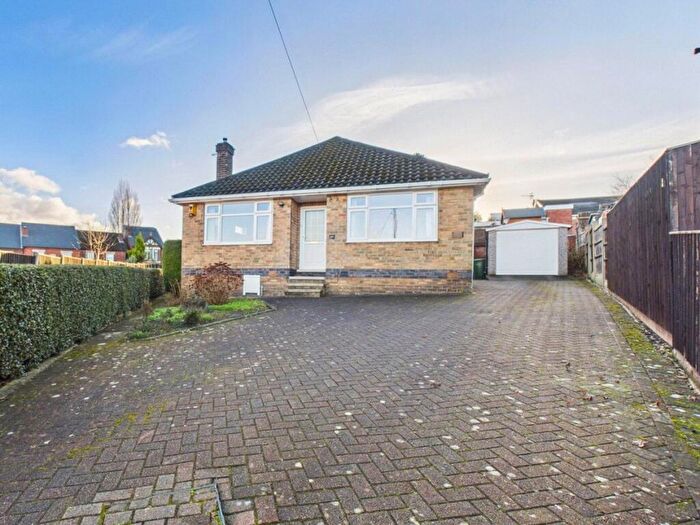
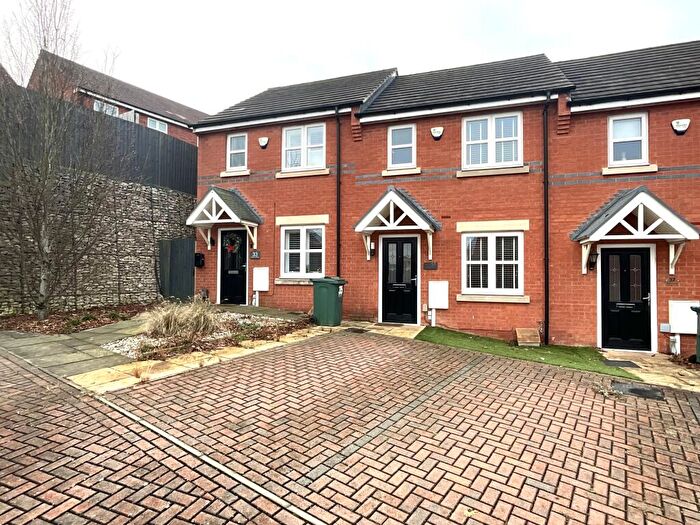
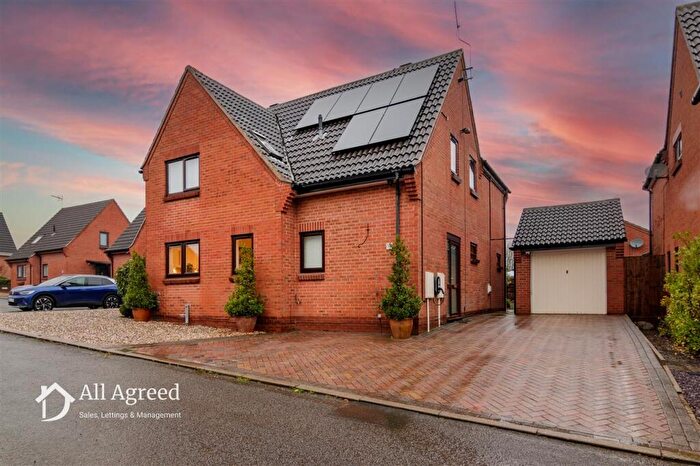
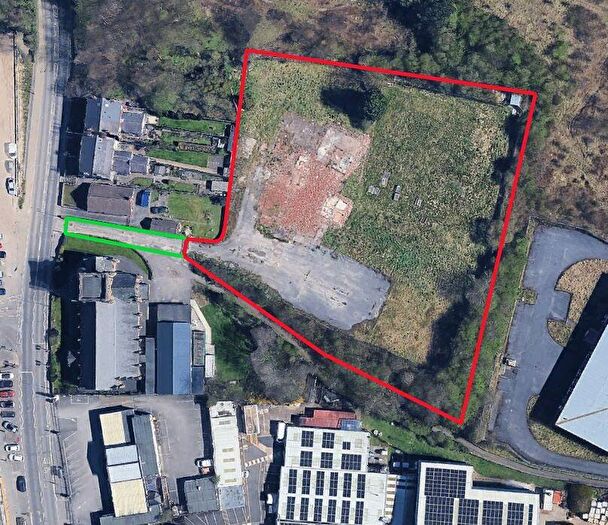
Properties for sale in Heanor East
Roads and Postcodes in Heanor East
Navigate through our locations to find the location of your next house in Heanor East, Heanor for sale or to rent.
| Streets | Postcodes |
|---|---|
| Aldreds Lane | DE75 7HG |
| Ashforth Avenue | DE75 7NH |
| Astcote Close | DE75 7TH |
| Avis Avenue | DE75 7DD |
| Avocet Close | DE75 7UA |
| Baker Avenue | DE75 7DL |
| Bestwick Avenue | DE75 7HH |
| Birchfield Park | DE75 7UP |
| Bluebell Way | DE75 7RF DE75 7RH |
| Breach Road | DE75 7HQ DE75 7NJ DE75 7NL |
| Brockhall Rise | DE75 7TL |
| Brookfield Way | DE75 7NU DE75 7NX |
| Buxton Avenue | DE75 7BX DE75 7BY DE75 7UN |
| Buxton Green | DE75 7UL |
| Carrock Avenue | DE75 7PF |
| Castle Court | DE75 7HU |
| Cemetery Way | DE75 7FB |
| Chapel Street | DE75 7NA |
| Claramount Road | DE75 7HS |
| Coppice Court | DE75 7DY |
| Coppice Drive | DE75 7BW |
| Coppice Mews | DE75 7DU |
| Corfield Avenue | DE75 7DF |
| East Street | DE75 7NE |
| Ellabank Road | DE75 7HF |
| Elmsfield Avenue | DE75 7BD |
| England Crescent | DE75 7BE |
| Frederic Avenue | DE75 7DG |
| Gillott Street | DE75 7LZ |
| Hands Road | DE75 7HD |
| Hartside Way | DE75 7UG |
| Heather Court | DE75 7NQ |
| Heyford Court | DE75 7TN |
| High Ridge | DE75 7FU |
| Holbrook Street | DE75 7BA |
| Holmesfield Drive | DE75 7BT DE75 7XT |
| Huftons Court | DE75 7DQ |
| Huftons Drive | DE75 7BH |
| Ilkeston Road | DE75 7BP DE75 7DT DE75 7LX DE75 7AG DE75 7DR DE75 7EA |
| Jasmine Court | DE75 7RY |
| Julie Avenue | DE75 7HW |
| Kew Crescent | DE75 7HR |
| Kirkstone Avenue | DE75 7UJ |
| Laceyfields Road | DE75 7HJ DE75 7HL |
| Langley Farm Close | DE75 7WE |
| Lavender Gardens | DE75 7NP |
| Lee Lane | DE75 7HN |
| Leonard Cheshire Close | DE75 7PB |
| Lockton Avenue | DE75 7EQ DE75 7ES |
| Lower Claramount Road | DE75 7HE |
| Malik Way | DE75 7DW |
| Mansfield Road | DE75 7BG |
| Meadow Gardens | DE75 7PH |
| Mill Road | DE75 7NB |
| Millbank | DE75 7BQ |
| Mundys Drive | DE75 7BR |
| Newham Close | DE75 7TW |
| Oaklands Avenue | DE75 7BB |
| Old Coppice Side | DE75 7DH DE75 7DJ |
| Oliver Close | DE75 7HY |
| Owers Avenue | DE75 7DE |
| Potters Hill View | DE75 7WF |
| Prospect Road | DE75 7NF |
| Ridgeway | DE75 7BU |
| Roper Avenue | DE75 7BZ DE75 7DA DE75 7DB |
| Rosewood Crescent | DE75 7HX |
| Smeeton Street | DE75 7HP |
| Sunningdale Avenue | DE75 7BS |
| The Ropewalk | DE75 7BL |
| Thistlegreen Close | DE75 7HZ |
| Thorpe Hill Drive | DE75 7DN |
| Upton Close | DE75 7TT |
| Vicarage Gardens | DE75 7HA |
| Western Drive | DE75 7DP |
| Westfield Avenue | DE75 7BN |
| Weston Street | DE75 7NG |
| Woodbridge Close | DE75 7UQ |
Transport near Heanor East
-
Langley Mill Station
-
Ilkeston Station
-
Belper Station
-
Duffield Station
-
Bulwell Station
-
Alfreton Station
-
Hucknall Station
-
Newstead Station
-
Ambergate Station
-
Spondon Station
- FAQ
- Price Paid By Year
- Property Type Price
Frequently asked questions about Heanor East
What is the average price for a property for sale in Heanor East?
The average price for a property for sale in Heanor East is £197,828. This amount is 0.6% lower than the average price in Heanor. There are 937 property listings for sale in Heanor East.
What streets have the most expensive properties for sale in Heanor East?
The streets with the most expensive properties for sale in Heanor East are Cemetery Way at an average of £710,000, Lockton Avenue at an average of £475,000 and Old Coppice Side at an average of £327,777.
What streets have the most affordable properties for sale in Heanor East?
The streets with the most affordable properties for sale in Heanor East are Mill Road at an average of £125,777, Prospect Road at an average of £130,166 and Ellabank Road at an average of £134,620.
Which train stations are available in or near Heanor East?
Some of the train stations available in or near Heanor East are Langley Mill, Ilkeston and Belper.
Property Price Paid in Heanor East by Year
The average sold property price by year was:
| Year | Average Sold Price | Price Change |
Sold Properties
|
|---|---|---|---|
| 2025 | £199,723 | 1% |
76 Properties |
| 2024 | £198,263 | 1% |
63 Properties |
| 2023 | £195,479 | 4% |
73 Properties |
| 2022 | £187,284 | 10% |
86 Properties |
| 2021 | £168,391 | 17% |
105 Properties |
| 2020 | £139,628 | -1% |
88 Properties |
| 2019 | £140,648 | - |
113 Properties |
| 2018 | £140,629 | 7% |
96 Properties |
| 2017 | £130,785 | 4% |
99 Properties |
| 2016 | £125,108 | 3% |
107 Properties |
| 2015 | £121,899 | 7% |
109 Properties |
| 2014 | £113,260 | -2% |
107 Properties |
| 2013 | £115,779 | 1% |
99 Properties |
| 2012 | £115,151 | -1% |
58 Properties |
| 2011 | £115,862 | 1% |
56 Properties |
| 2010 | £114,568 | 8% |
65 Properties |
| 2009 | £105,922 | -5% |
59 Properties |
| 2008 | £110,712 | -7% |
67 Properties |
| 2007 | £118,529 | 1% |
127 Properties |
| 2006 | £116,857 | 10% |
135 Properties |
| 2005 | £104,829 | 0,1% |
117 Properties |
| 2004 | £104,770 | 13% |
136 Properties |
| 2003 | £91,442 | 25% |
154 Properties |
| 2002 | £68,563 | 10% |
206 Properties |
| 2001 | £61,566 | 13% |
188 Properties |
| 2000 | £53,455 | 6% |
166 Properties |
| 1999 | £50,376 | 8% |
183 Properties |
| 1998 | £46,509 | 12% |
110 Properties |
| 1997 | £40,735 | 2% |
83 Properties |
| 1996 | £39,899 | 7% |
80 Properties |
| 1995 | £36,956 | - |
70 Properties |
Property Price per Property Type in Heanor East
Here you can find historic sold price data in order to help with your property search.
The average Property Paid Price for specific property types in the last three years are:
| Property Type | Average Sold Price | Sold Properties |
|---|---|---|
| Semi Detached House | £179,268.00 | 97 Semi Detached Houses |
| Detached House | £312,021.00 | 47 Detached Houses |
| Terraced House | £146,350.00 | 67 Terraced Houses |
| Flat | £80,000.00 | 1 Flat |

