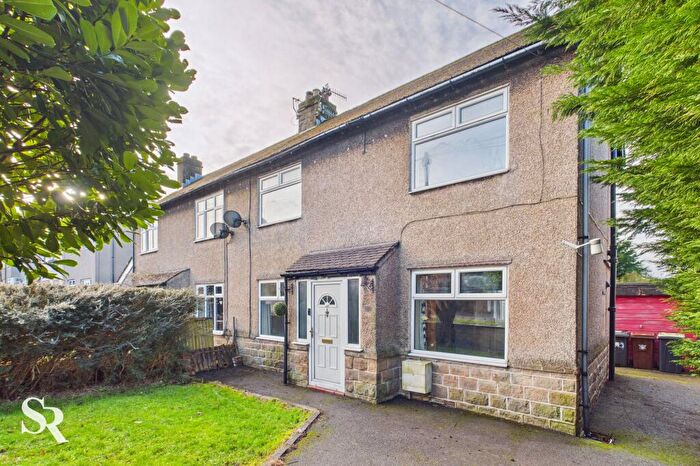
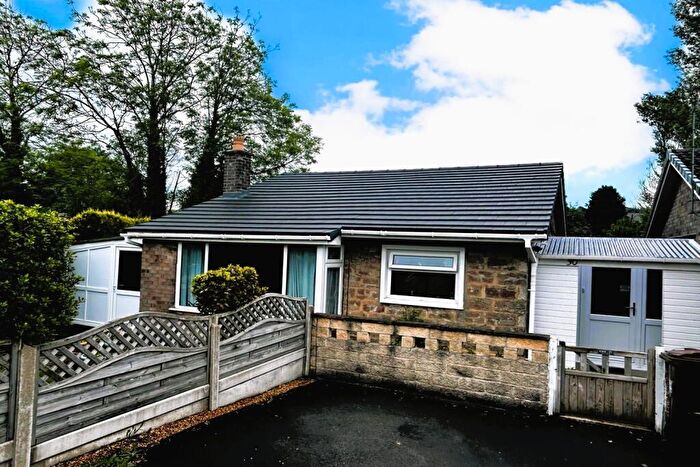
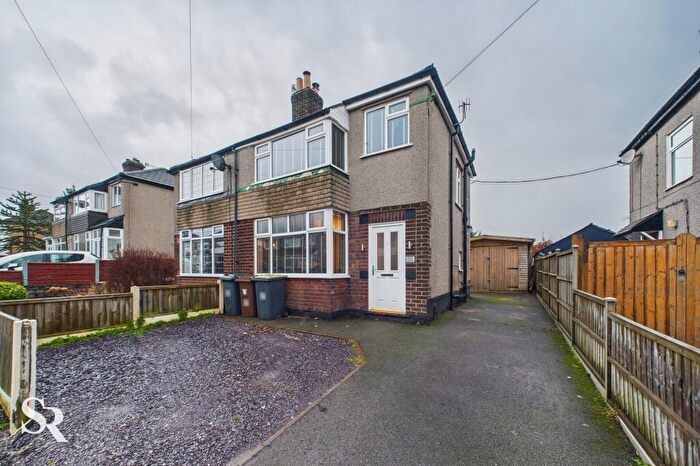
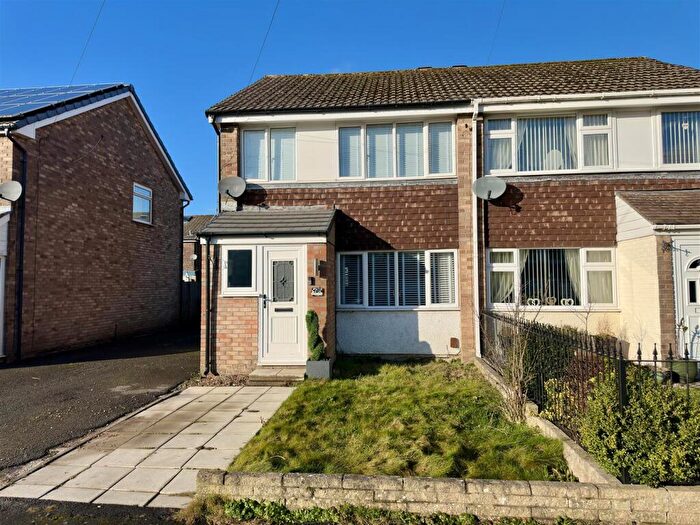
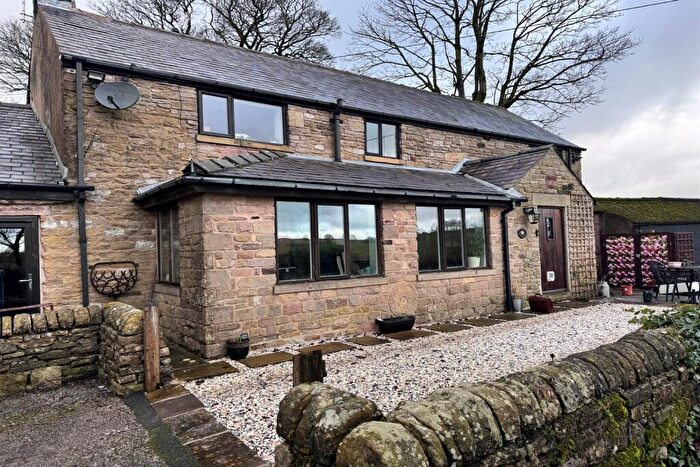
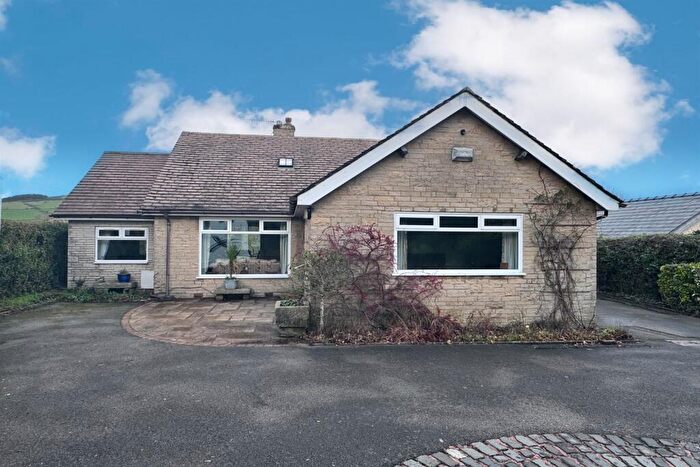
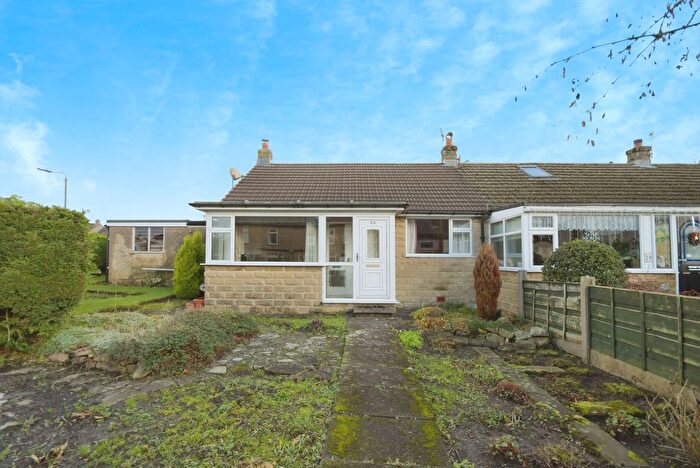
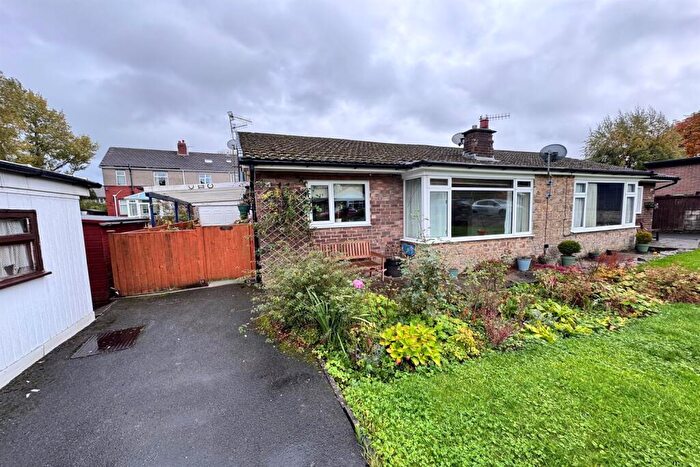
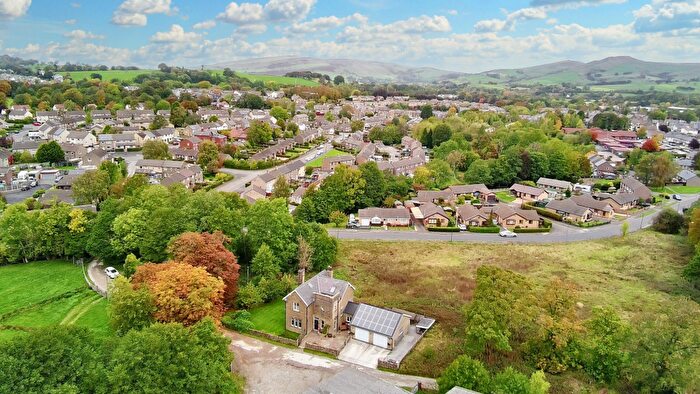
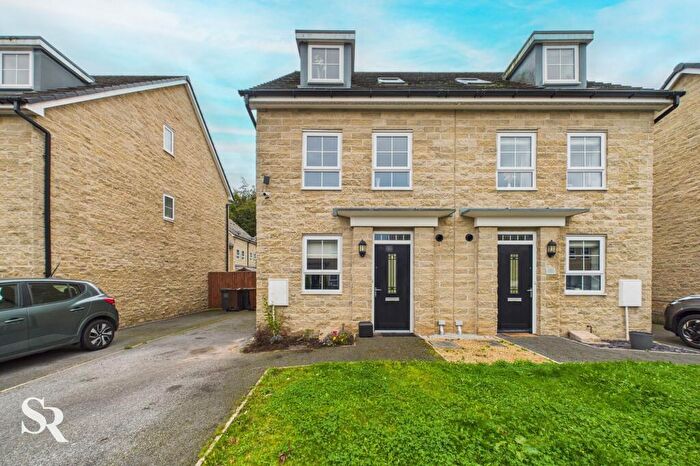
Houses for sale & to rent in Chapel East, High Peak
House Prices in Chapel East
Properties in Chapel East have an average house price of £250,816.00 and had 69 Property Transactions within the last 3 years¹.
Chapel East is an area in High Peak, Derbyshire with 925 households², where the most expensive property was sold for £746,000.00.
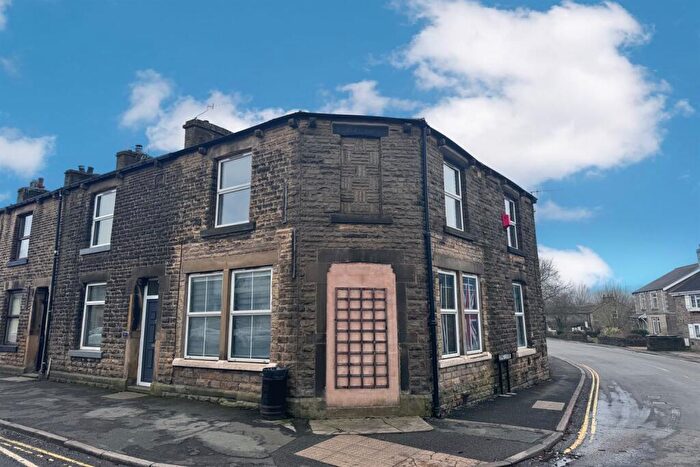
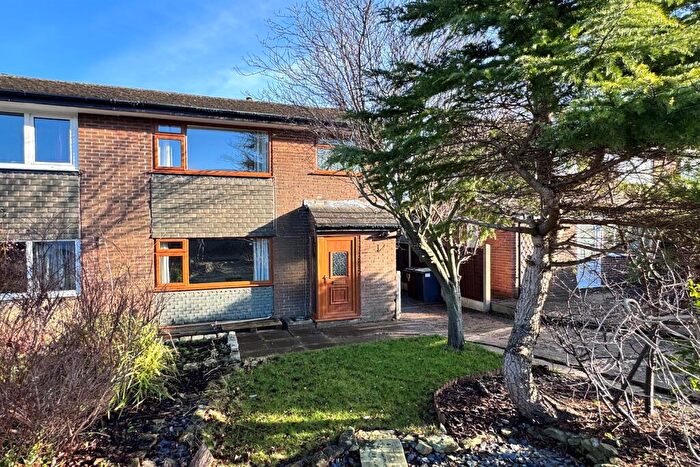
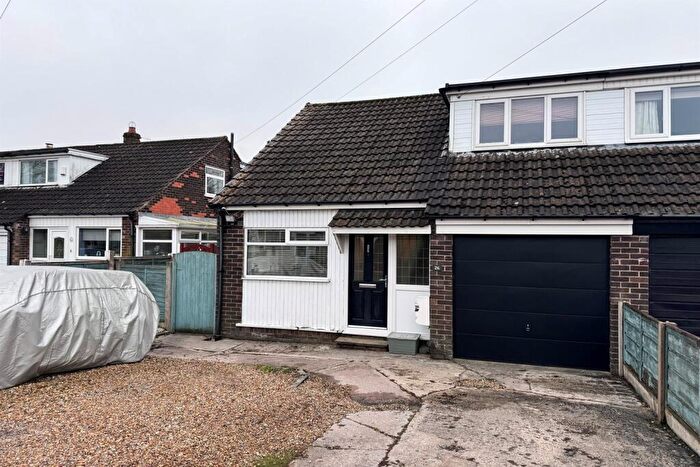
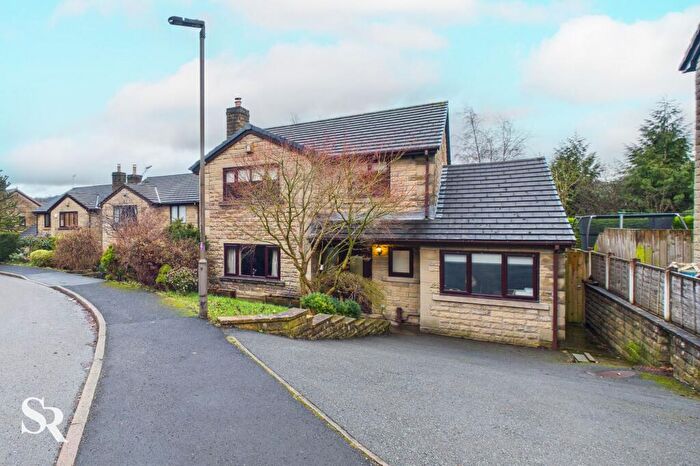
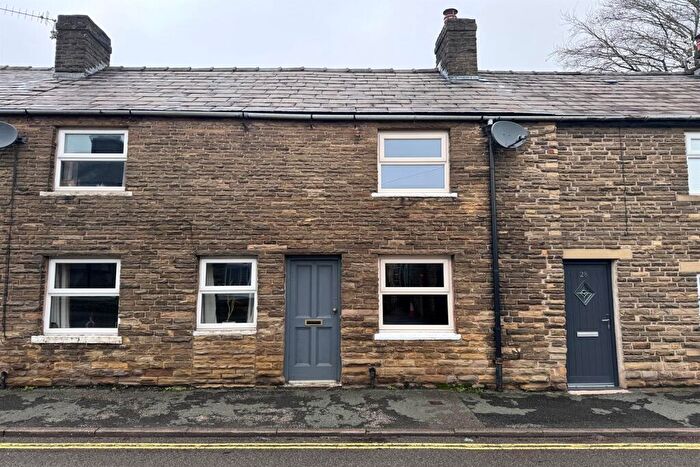
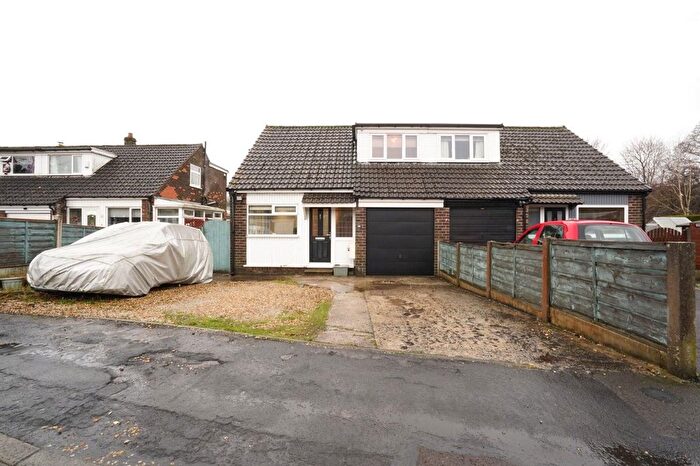
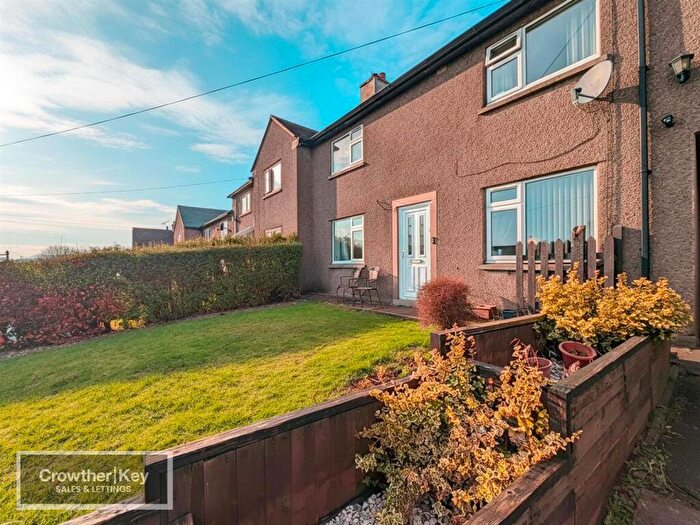
Properties for sale in Chapel East
Roads and Postcodes in Chapel East
Navigate through our locations to find the location of your next house in Chapel East, High Peak for sale or to rent.
| Streets | Postcodes |
|---|---|
| Anchor Avenue | SK23 0PB |
| Anchor Fold | SK23 0PD |
| Ashbourne Lane | SK23 0PA SK23 9UG |
| Ashfield Road | SK23 0PS |
| Bagshaw | SK23 0QU |
| Barlow Road | SK23 0NH |
| Beresford Avenue | SK23 0PZ |
| Beresford Road | SK23 0NY |
| Blackbrook | SK23 0PU |
| Bowden Hey Road | SK23 0QZ |
| Bowden Lane | SK23 0JQ SK23 0QP SK23 0JX SK23 0QF SK23 0QG |
| Brook Fold | SK23 0BB |
| Brooklands Avenue | SK23 0PR |
| Brooklands Road | SK23 0PW |
| Burdekin Close | SK23 0QA |
| Burnside Avenue | SK23 0BA |
| Buxton Road | SK23 0PJ SK23 0PT |
| Eastbrook Close | SK23 0NN |
| Eldon Close | SK23 0PX |
| Fern Bank | SK23 0JJ |
| Foresters Way | SK23 0RB |
| Frith Knoll Road | SK23 0PG |
| Hayfield Road | SK23 0HJ SK23 0JF |
| Hayfield Road East | SK23 0JG SK23 0NX |
| Heyworth Road | SK23 0NJ |
| Homestead Way | SK23 0DA |
| Johnson Way | SK23 0QB |
| Long Lane | SK23 9UR |
| Longson Road | SK23 0NS |
| Lower Eaves View | SK23 0PL |
| Market Street | SK23 0HZ SK23 0JD SK23 0NT |
| Moss View Road | SK23 0NP |
| Netherfield Road | SK23 0PN |
| Old School Yard | SK23 0JE |
| Peaslows Lane | SK23 0QX |
| Quentin Road | SK23 0JU SK23 0NG |
| Sandyway Head | SK23 0PP |
| Sheffield Road | SK23 0PE SK23 0PH SK23 0PQ SK23 0RA SK23 0RD |
| Smithbrook Close | SK23 0QD |
| South Head Drive | SK23 0HU |
| The Crescent | SK23 0JL |
| Thornell Close | SK23 0NR |
| Warmbrook Road | SK23 0NL SK23 0NW |
| Whaley Bridge | SK23 7ET SK23 7FS SK23 7WH |
| Wilshaw Close | SK23 0NZ |
| SK23 0QR SK23 0QS SK23 0QT SK23 9UA SK22 9AH SK22 9AP SK22 9AQ SK22 9AR SK23 0HW SK23 0WA |
Transport near Chapel East
- FAQ
- Price Paid By Year
- Property Type Price
Frequently asked questions about Chapel East
What is the average price for a property for sale in Chapel East?
The average price for a property for sale in Chapel East is £250,816. This amount is 17% lower than the average price in High Peak. There are 782 property listings for sale in Chapel East.
What streets have the most expensive properties for sale in Chapel East?
The streets with the most expensive properties for sale in Chapel East are Bagshaw at an average of £540,000, Thornell Close at an average of £494,000 and South Head Drive at an average of £375,000.
What streets have the most affordable properties for sale in Chapel East?
The streets with the most affordable properties for sale in Chapel East are Brook Fold at an average of £122,500, Hayfield Road East at an average of £134,000 and Market Street at an average of £173,333.
Which train stations are available in or near Chapel East?
Some of the train stations available in or near Chapel East are Chapel-En-Le-Frith, Dove Holes and Chinley.
Property Price Paid in Chapel East by Year
The average sold property price by year was:
| Year | Average Sold Price | Price Change |
Sold Properties
|
|---|---|---|---|
| 2025 | £241,363 | -4% |
26 Properties |
| 2024 | £251,758 | -6% |
29 Properties |
| 2023 | £266,419 | 0,1% |
14 Properties |
| 2022 | £266,207 | 4% |
28 Properties |
| 2021 | £254,340 | 20% |
50 Properties |
| 2020 | £202,735 | 11% |
39 Properties |
| 2019 | £181,443 | -3% |
36 Properties |
| 2018 | £186,363 | -7% |
40 Properties |
| 2017 | £198,571 | 8% |
49 Properties |
| 2016 | £181,838 | -15% |
61 Properties |
| 2015 | £209,323 | 25% |
25 Properties |
| 2014 | £157,216 | -3% |
43 Properties |
| 2013 | £161,865 | -5% |
40 Properties |
| 2012 | £170,111 | -17% |
17 Properties |
| 2011 | £199,116 | 24% |
30 Properties |
| 2010 | £151,908 | -1% |
25 Properties |
| 2009 | £153,550 | -7% |
20 Properties |
| 2008 | £164,993 | -6% |
22 Properties |
| 2007 | £175,031 | 2% |
48 Properties |
| 2006 | £171,119 | 7% |
38 Properties |
| 2005 | £159,443 | 6% |
31 Properties |
| 2004 | £150,144 | 24% |
65 Properties |
| 2003 | £114,500 | 3% |
62 Properties |
| 2002 | £111,236 | 15% |
92 Properties |
| 2001 | £94,842 | 10% |
88 Properties |
| 2000 | £85,632 | 17% |
67 Properties |
| 1999 | £70,820 | -13% |
56 Properties |
| 1998 | £80,218 | 30% |
37 Properties |
| 1997 | £56,475 | 21% |
36 Properties |
| 1996 | £44,659 | -36% |
36 Properties |
| 1995 | £60,656 | - |
21 Properties |
Property Price per Property Type in Chapel East
Here you can find historic sold price data in order to help with your property search.
The average Property Paid Price for specific property types in the last three years are:
| Property Type | Average Sold Price | Sold Properties |
|---|---|---|
| Semi Detached House | £244,480.00 | 25 Semi Detached Houses |
| Detached House | £358,710.00 | 16 Detached Houses |
| Terraced House | £210,999.00 | 23 Terraced Houses |
| Flat | £120,390.00 | 5 Flats |

