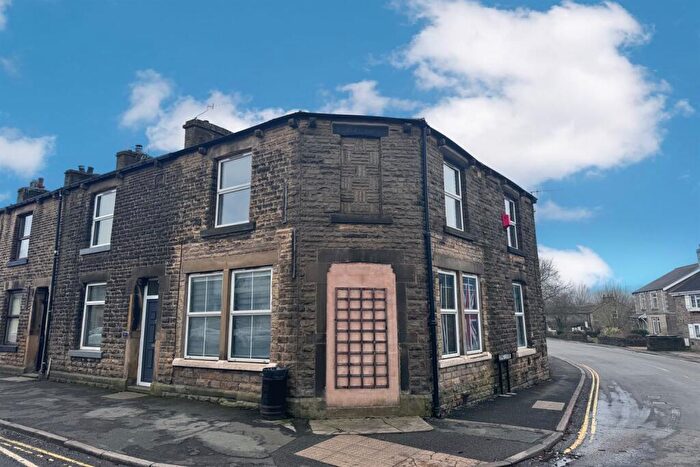
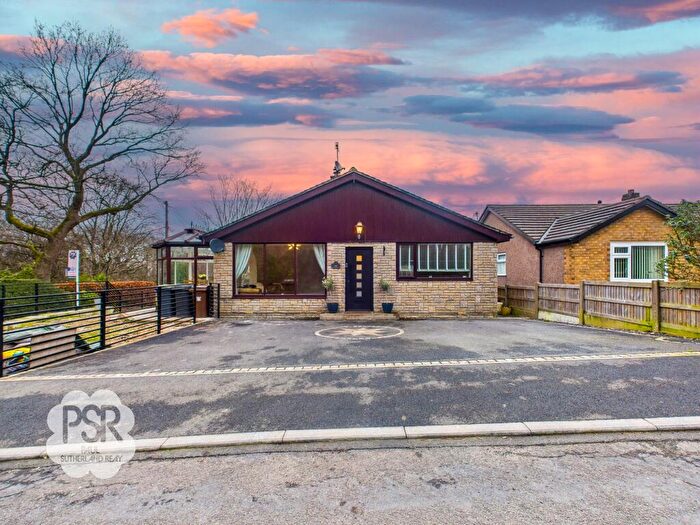
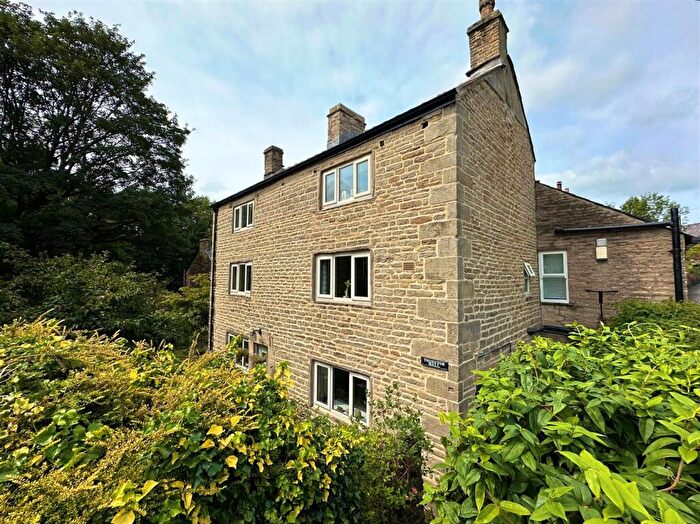
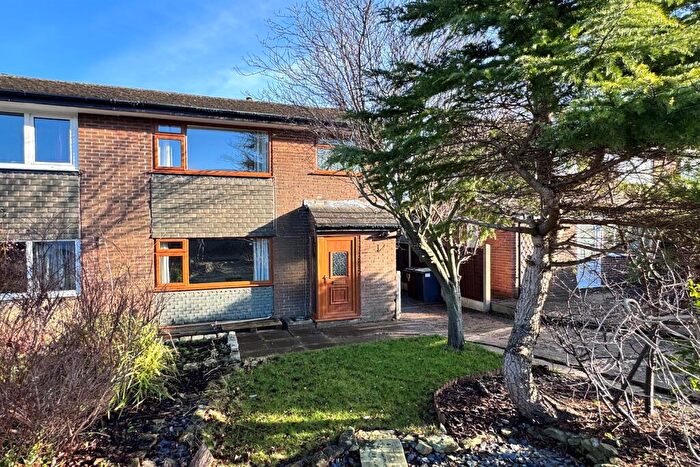
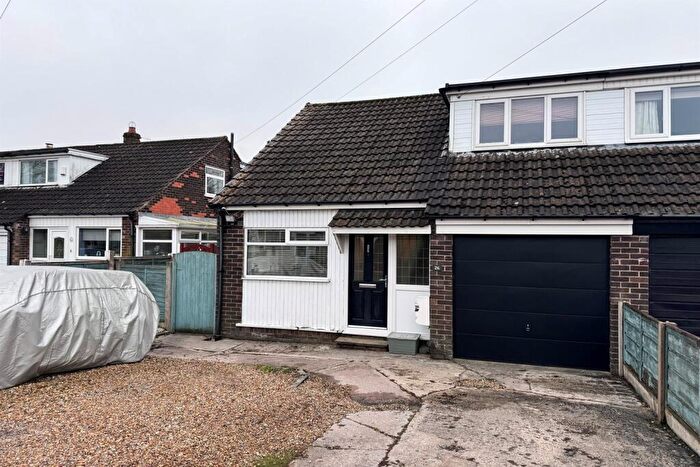
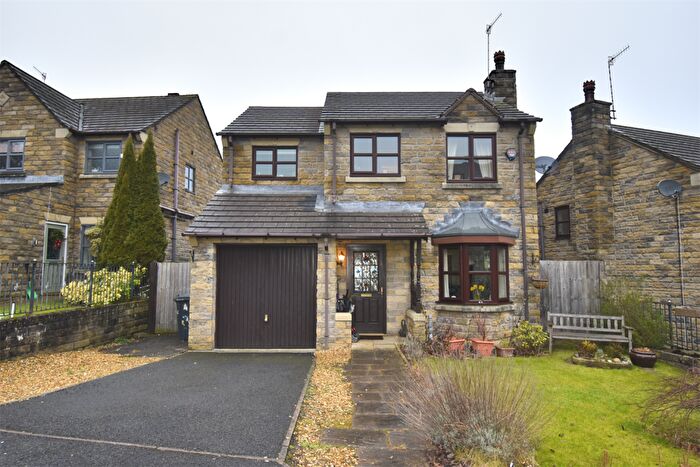
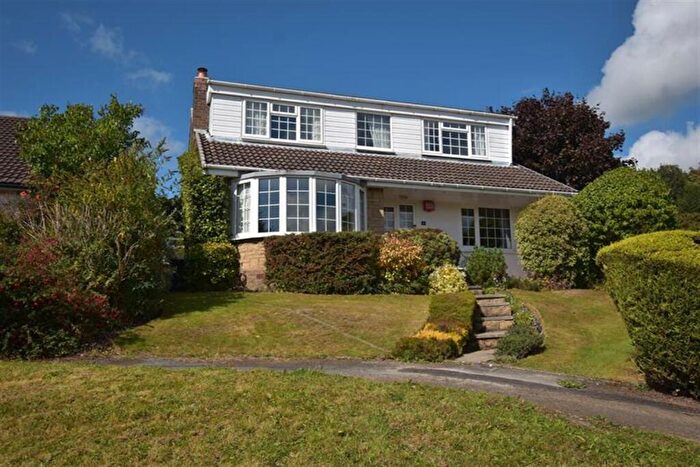
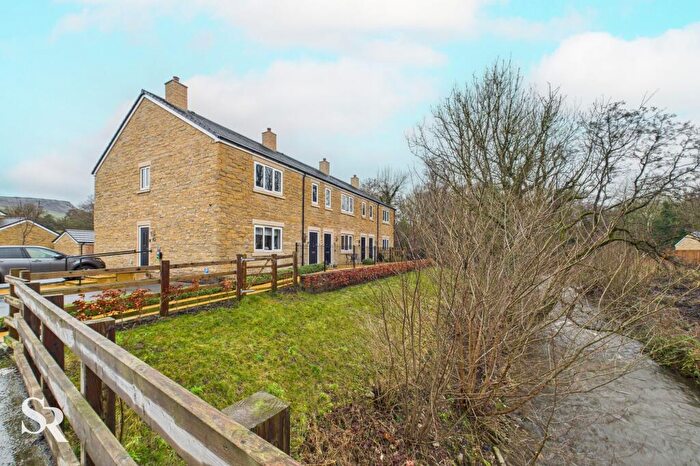
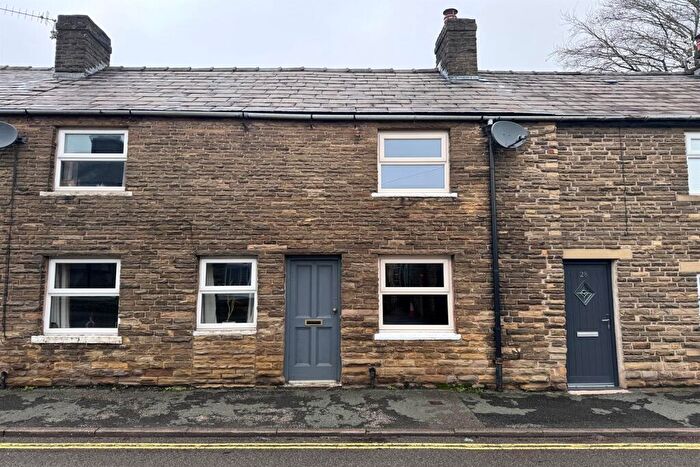
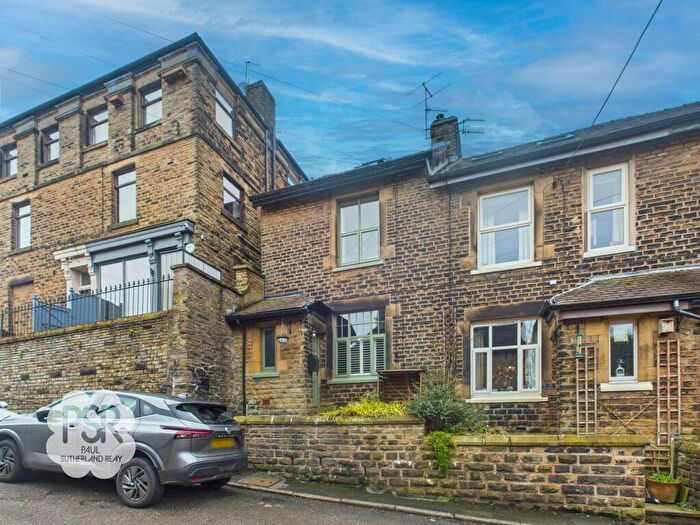
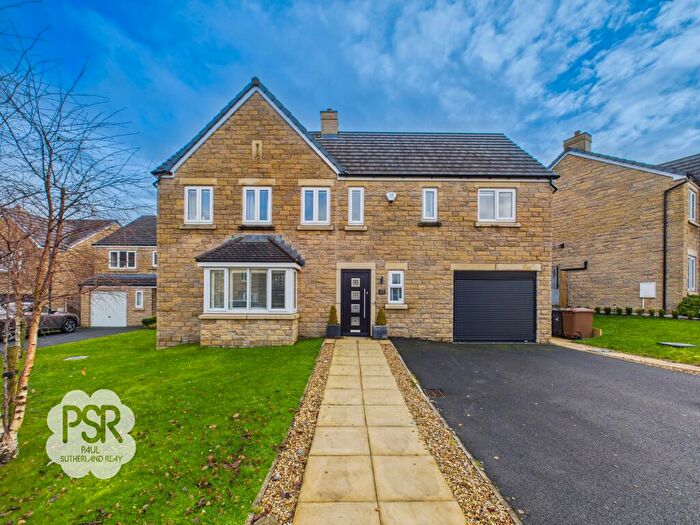
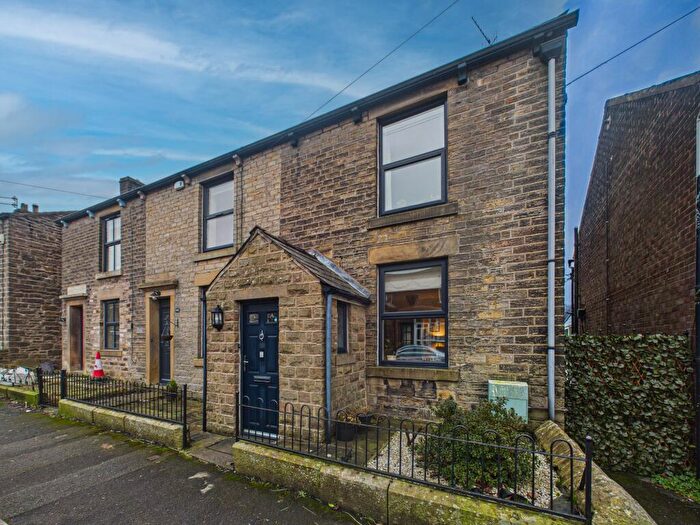
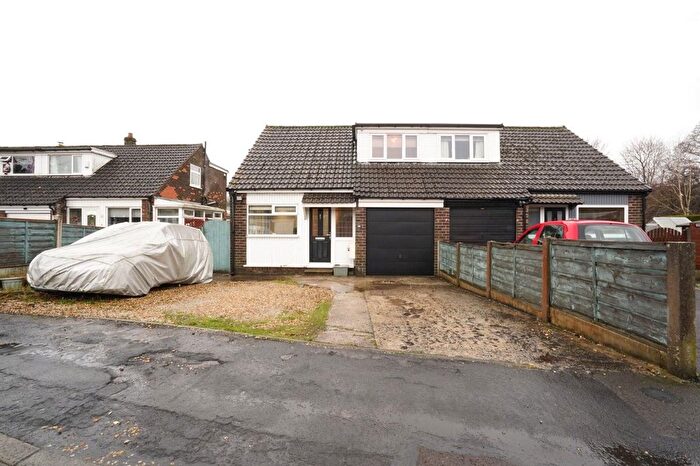
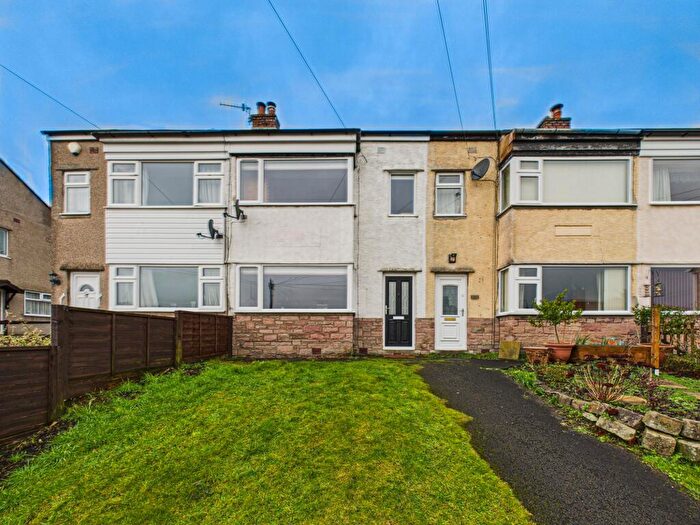
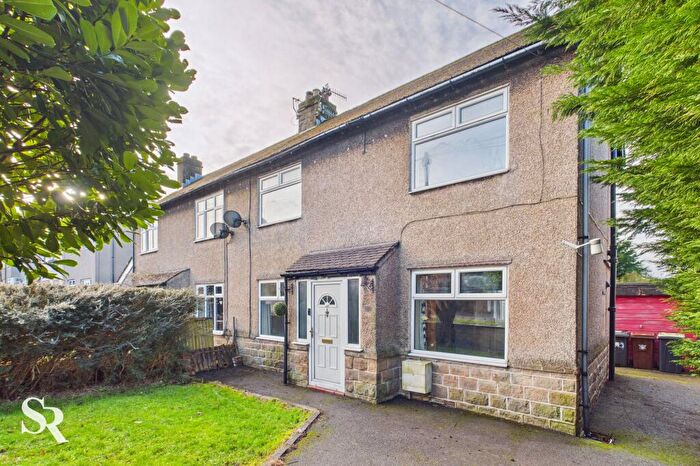
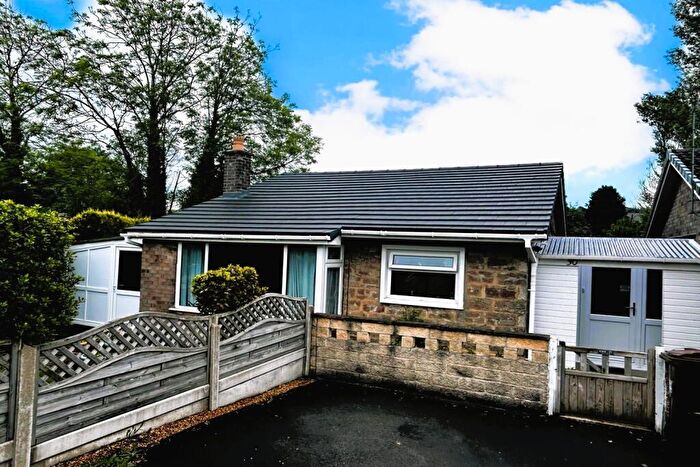
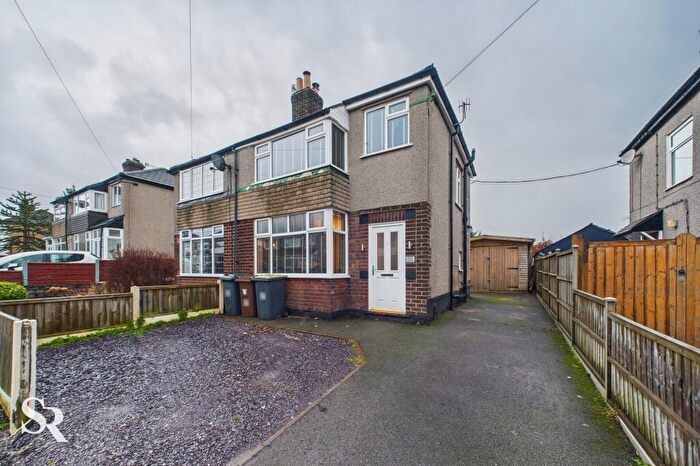
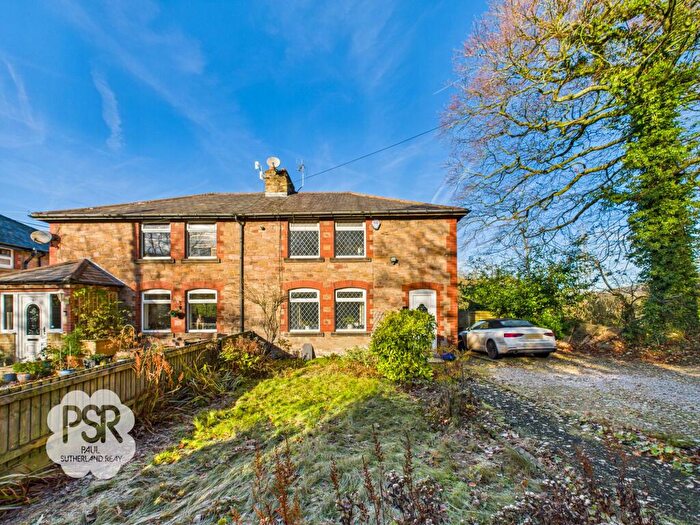
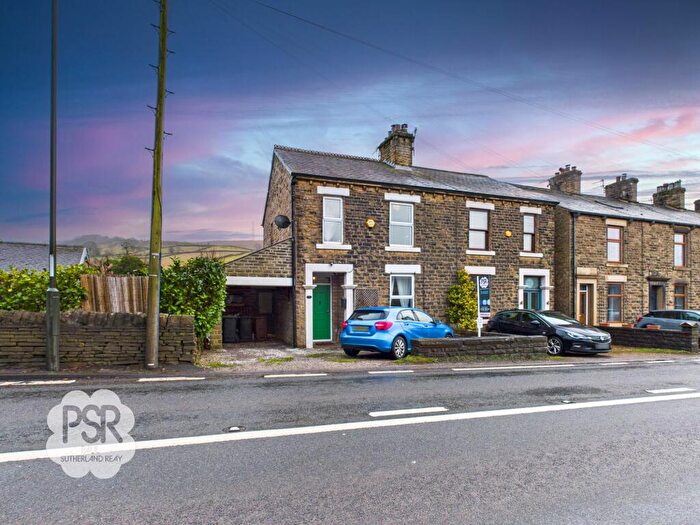
Houses for sale & to rent in Blackbrook, High Peak
House Prices in Blackbrook
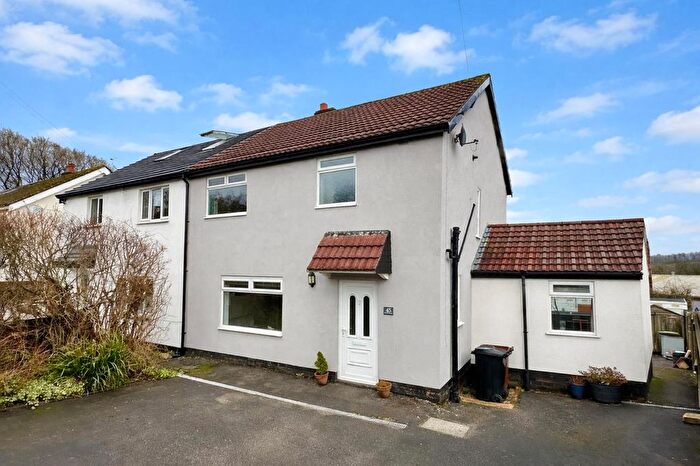
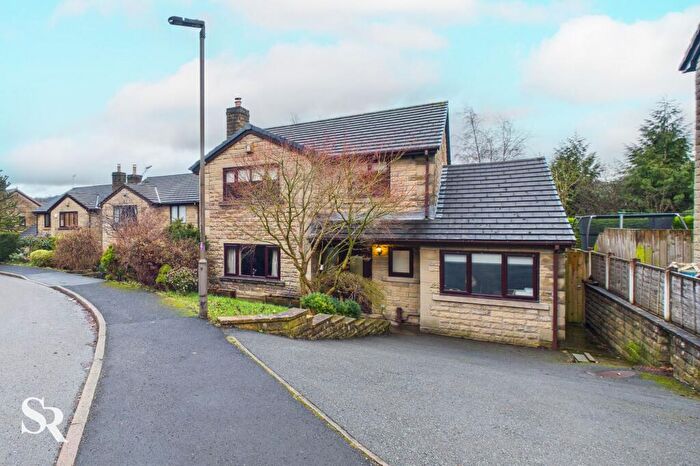
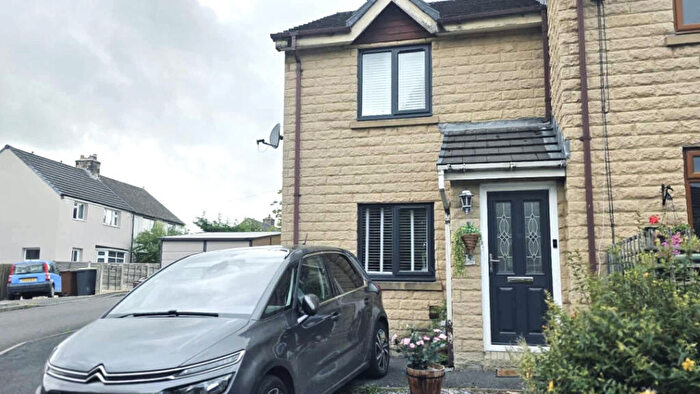
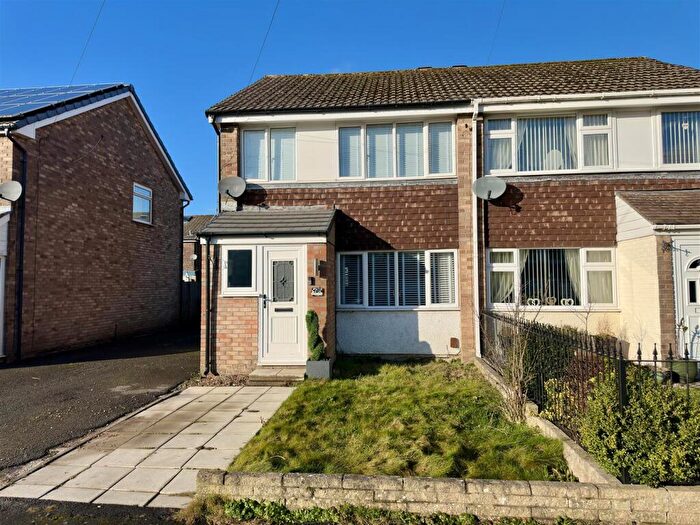
Properties in Blackbrook have an average house price of £380,509.00 and had 179 Property Transactions within the last 3 years¹.
Blackbrook is an area in High Peak, Derbyshire with 1,689 households², where the most expensive property was sold for £997,450.00.
Properties for sale in Blackbrook
Roads and Postcodes in Blackbrook
Navigate through our locations to find the location of your next house in Blackbrook, High Peak for sale or to rent.
| Streets | Postcodes |
|---|---|
| Alder Brook | SK23 6DN |
| Alders Avenue | SK23 6DS |
| Alders Lane | SK23 6DP SK23 6DW |
| Alders Meadow | SK23 6EN |
| Alpha Road | SK23 6DL |
| Ash Grove | SK23 6BQ |
| Belgrade Avenue | SK23 6BG |
| Belle Vue | SK23 6BB |
| Blackbrook Drive | SK23 6BF |
| Bradshaw Lane | SK23 9UL |
| Bridgeholme | SK23 6DU |
| Bridgemont | SK23 7EE |
| Brierley Green | SK23 7NL |
| Brierley Park | SK23 7NW |
| Britannia Trading Estate | SK23 7NF SK23 7SE |
| Brookside | SK23 7NE |
| Buxton Road | SK23 6DJ SK23 6DR SK23 6DT SK23 6EL SK23 6ES SK23 6EW SK23 6FJ |
| Chapel Milton | SK23 0QQ |
| Charley Lane | SK23 6DX SK23 6DY |
| Combs Road | SK23 9UP SK23 9UW |
| Cracken Close | SK23 6AZ |
| Crossings Road | SK23 9RX SK23 9RY SK23 9RZ |
| Derby Knowle | SK23 7SD |
| Derwent Drive | SK23 6BL |
| Derwent Square | SK23 6BH |
| Devonshire Drive | SK23 6AS |
| Dolly Lane | SK23 7NN SK23 7QG SK23 7QH SK23 7QJ SK23 7QL SK23 7QQ |
| Dollywood Close | SK23 7NX |
| Eccles Fold | SK23 6BY |
| Eccles Road | SK23 7EW SK23 9RS SK23 9RT |
| Eccles Terrace | SK23 6BU |
| Ella Mews | SK23 6EU |
| Forge Road | SK23 6FG |
| Forge Terrace | SK23 6BW |
| Gowhole | SK23 7QE |
| Granby Avenue | SK23 6DH |
| Green Lane | SK23 6AA SK23 6BA SK23 6BN SK23 6BR SK23 6ET |
| Hadfield Drive | SK23 6EZ |
| Hartington Drive | SK23 6DQ |
| Hawthorn Close | SK23 6DD |
| Hayfield Road | SK23 6AL |
| Heath Lane | SK23 9AB |
| Hunters Green Close | SK23 6DF |
| Leaden Knowle | SK23 6DA |
| Lesser Lane | SK23 9UZ |
| Lower Lane | SK23 6BD SK23 6BE SK23 6DB |
| Lyme Park | SK23 6AG |
| Manchester Road | SK23 9TN SK23 9TP SK23 9UH SK23 9TW |
| Manners Close | SK23 6AU |
| Marriott Place | SK23 6EP |
| Marsh Hall Lane | SK23 9UQ |
| Marsh Way | SK23 9AD |
| Maybank Close | SK23 6EH |
| Maynestone Road | SK23 6AF SK23 6AH SK23 6AQ |
| Mill Court | SK23 6FH |
| Millpond Close | SK23 6EX |
| Mount Pleasant | SK23 7TB |
| Mount Villas | SK23 6DZ |
| New Road | SK23 7NH |
| New Smithy | SK23 6AP |
| Orchid Drive | SK23 9AA |
| Outram Way | SK23 6EQ |
| Pike View Close | SK23 6EF |
| Portland Grove | SK23 6AD SK23 6AX |
| Princes Road | SK23 6AB |
| Printers Close | SK23 6FL |
| Rhuddlan Place | SK23 6BJ |
| Ridge Lane | SK23 9UU |
| Rose Terrace | SK23 7GJ |
| Rutland Way | SK23 6AT |
| Silk Hill | SK23 7TA |
| St Marys Close | SK23 6EG |
| Station Road | SK23 6AR SK23 7NJ |
| Stockton Drive | SK23 6DG |
| Stubbins Lane | SK23 6AE SK23 6EB SK23 6ED |
| The Avenue | SK23 9US |
| The Sidings | SK23 6DE |
| The Terrace | SK23 6AY |
| The Wash | SK23 0QL SK23 0QN SK23 0QW |
| Tom Lane | SK23 9UN |
| Tunstead Milton | SK23 7ER SK23 7ES SK23 7GL |
| Twayblade Crescent | SK23 9AE |
| Western Lane | SK23 7NQ SK23 7NS |
| White Knowle | SK23 6EA |
| Whitehall Terrace | SK23 6BS |
| Whitehough | SK23 6BX SK23 6EJ SK23 6BZ |
| Wicken Lane | SK23 6AN |
| Wood Cutters Way | SK23 9TQ |
| SK23 6EE SK23 7NP SK23 7NR SK23 9UT SK23 9UX SK23 9UY SK23 6AW SK23 6BT SK23 6WN SK23 6WP SK23 7RH SK23 9XA |
Transport near Blackbrook
- FAQ
- Price Paid By Year
- Property Type Price
Frequently asked questions about Blackbrook
What is the average price for a property for sale in Blackbrook?
The average price for a property for sale in Blackbrook is £380,509. This amount is 26% higher than the average price in High Peak. There are 2,142 property listings for sale in Blackbrook.
What streets have the most expensive properties for sale in Blackbrook?
The streets with the most expensive properties for sale in Blackbrook are Lyme Park at an average of £950,000, Bridgemont at an average of £812,500 and Maynestone Road at an average of £732,500.
What streets have the most affordable properties for sale in Blackbrook?
The streets with the most affordable properties for sale in Blackbrook are Charley Lane at an average of £133,400, Hunters Green Close at an average of £140,000 and Tom Lane at an average of £193,500.
Which train stations are available in or near Blackbrook?
Some of the train stations available in or near Blackbrook are Chinley, Whaley Bridge and Chapel-En-Le-Frith.
Property Price Paid in Blackbrook by Year
The average sold property price by year was:
| Year | Average Sold Price | Price Change |
Sold Properties
|
|---|---|---|---|
| 2025 | £377,765 | 0,4% |
47 Properties |
| 2024 | £376,162 | -4% |
84 Properties |
| 2023 | £390,802 | 5% |
48 Properties |
| 2022 | £370,818 | 4% |
80 Properties |
| 2021 | £355,550 | 6% |
84 Properties |
| 2020 | £333,451 | 19% |
92 Properties |
| 2019 | £270,970 | -2% |
94 Properties |
| 2018 | £275,145 | 1% |
118 Properties |
| 2017 | £272,686 | 9% |
123 Properties |
| 2016 | £248,252 | 3% |
113 Properties |
| 2015 | £241,138 | 4% |
87 Properties |
| 2014 | £232,164 | 23% |
74 Properties |
| 2013 | £179,866 | -18% |
40 Properties |
| 2012 | £212,552 | -7% |
47 Properties |
| 2011 | £228,096 | -12% |
43 Properties |
| 2010 | £255,563 | 13% |
42 Properties |
| 2009 | £222,955 | -25% |
42 Properties |
| 2008 | £279,500 | 14% |
33 Properties |
| 2007 | £240,390 | 12% |
108 Properties |
| 2006 | £211,364 | 13% |
88 Properties |
| 2005 | £184,021 | 1% |
71 Properties |
| 2004 | £182,307 | 14% |
102 Properties |
| 2003 | £156,357 | 11% |
81 Properties |
| 2002 | £138,976 | 21% |
83 Properties |
| 2001 | £110,298 | 9% |
84 Properties |
| 2000 | £100,041 | 8% |
82 Properties |
| 1999 | £91,881 | -2% |
92 Properties |
| 1998 | £94,069 | 3% |
69 Properties |
| 1997 | £91,420 | 30% |
95 Properties |
| 1996 | £64,432 | -2% |
83 Properties |
| 1995 | £65,776 | - |
57 Properties |
Property Price per Property Type in Blackbrook
Here you can find historic sold price data in order to help with your property search.
The average Property Paid Price for specific property types in the last three years are:
| Property Type | Average Sold Price | Sold Properties |
|---|---|---|
| Semi Detached House | £333,103.00 | 58 Semi Detached Houses |
| Detached House | £549,765.00 | 62 Detached Houses |
| Terraced House | £263,739.00 | 51 Terraced Houses |
| Flat | £156,875.00 | 8 Flats |

