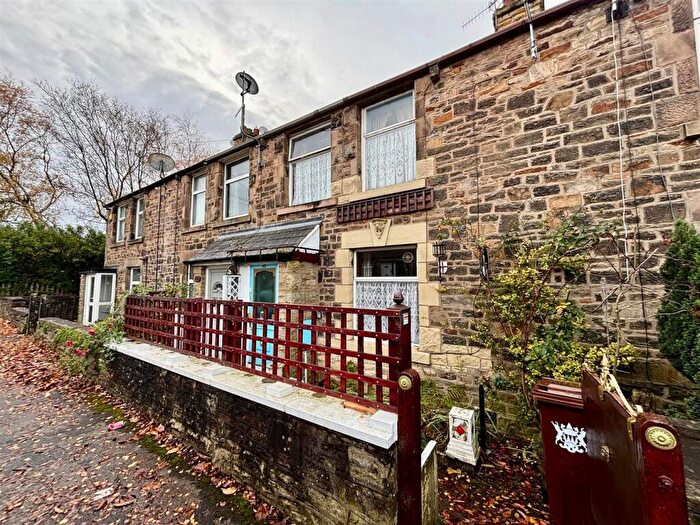
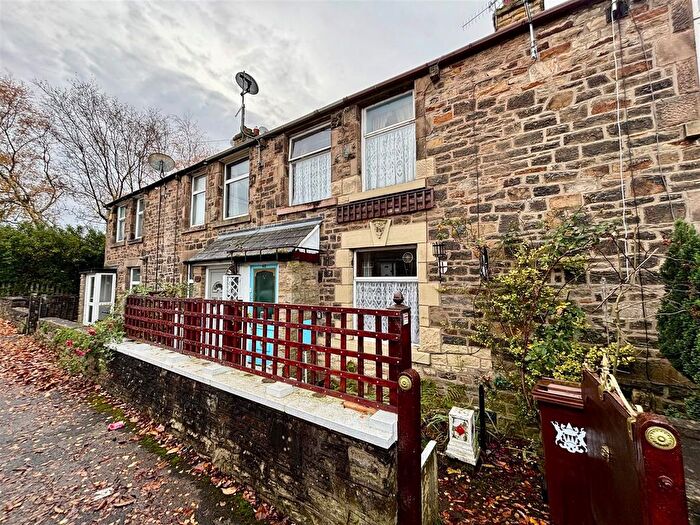
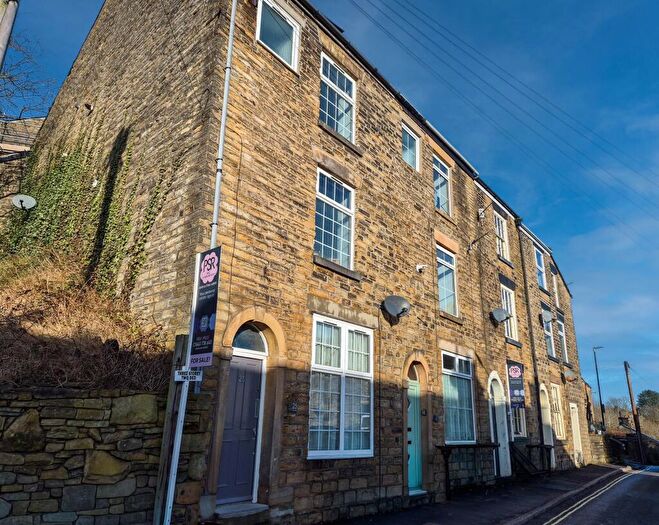
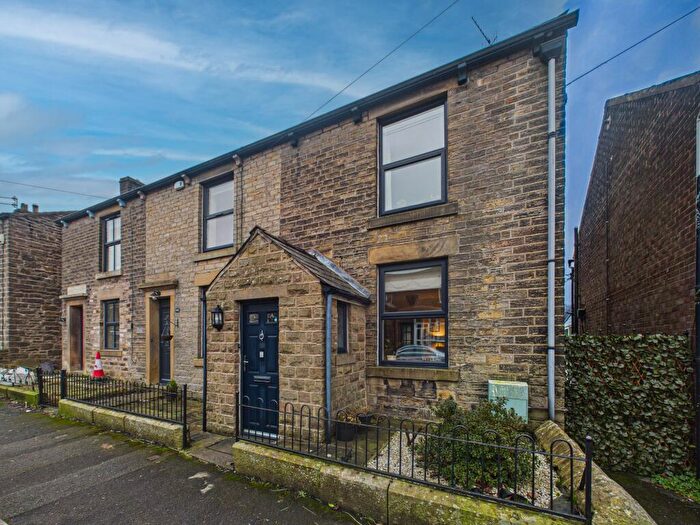
Houses for sale & to rent in New Mills East, High Peak
House Prices in New Mills East
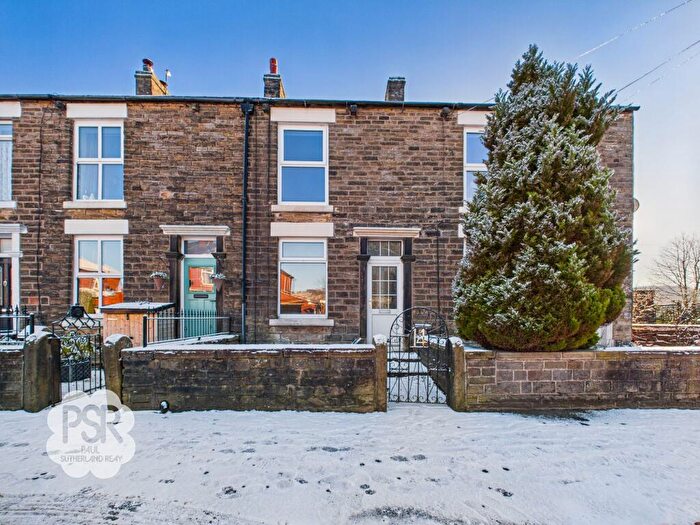
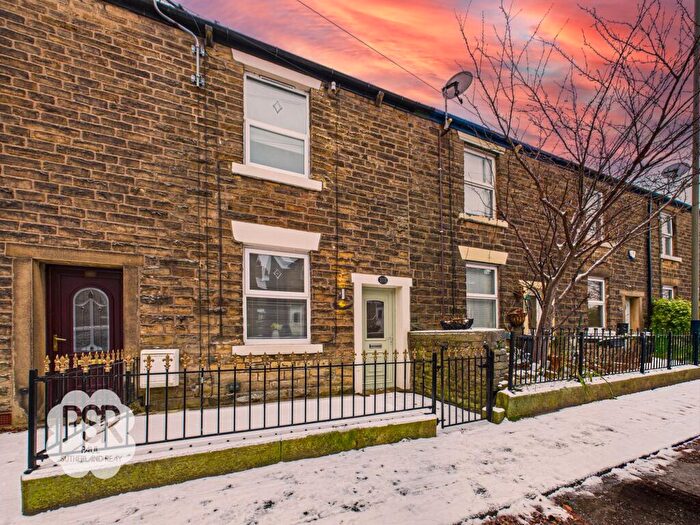
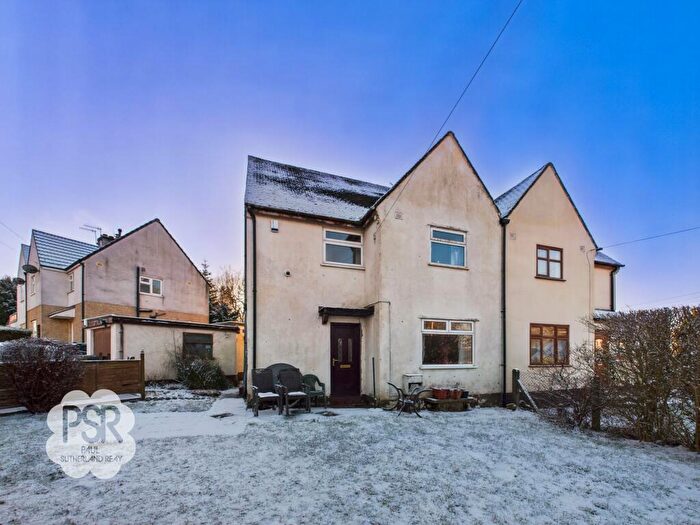
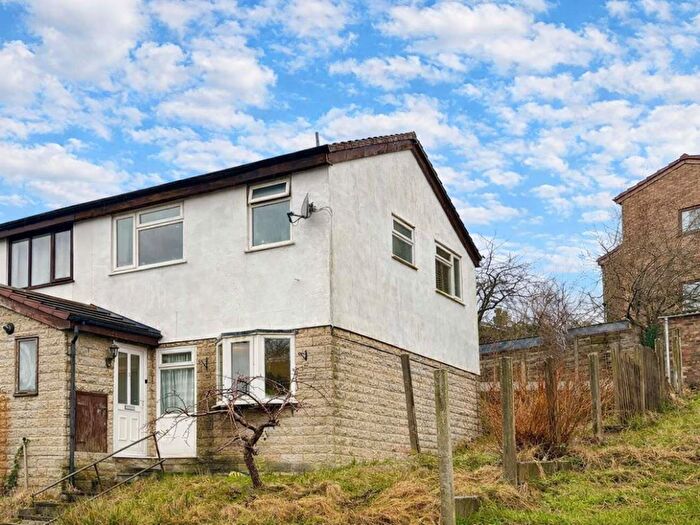
Properties in New Mills East have an average house price of £252,650.00 and had 168 Property Transactions within the last 3 years¹.
New Mills East is an area in High Peak, Derbyshire with 1,751 households², where the most expensive property was sold for £750,000.00.
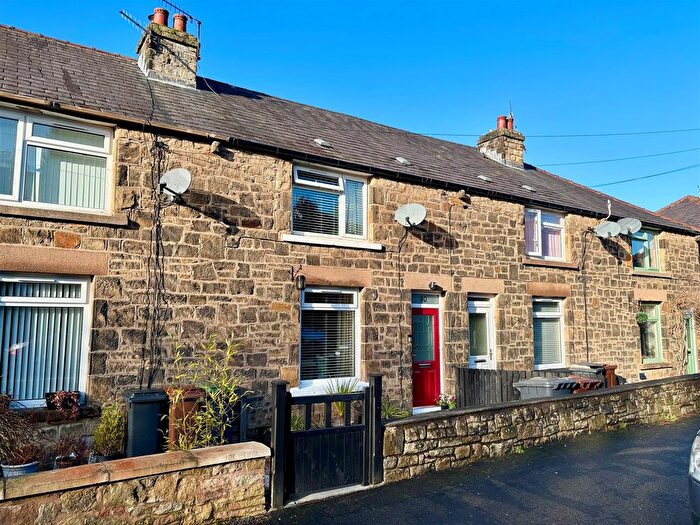
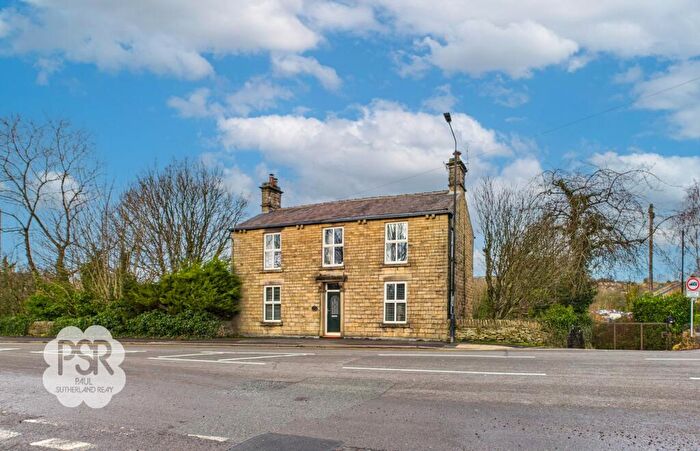
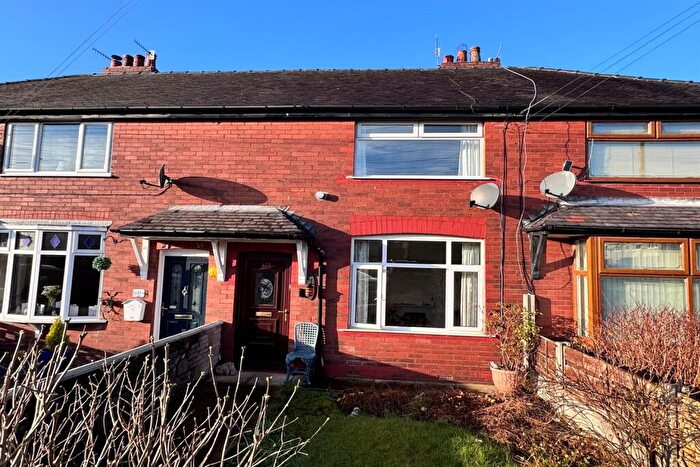
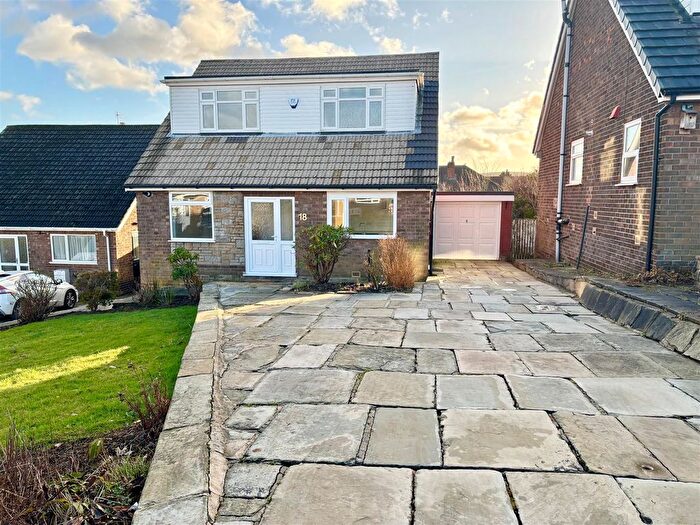
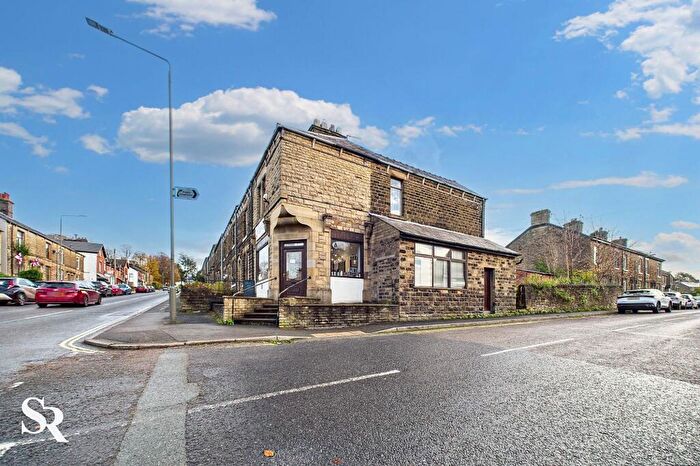
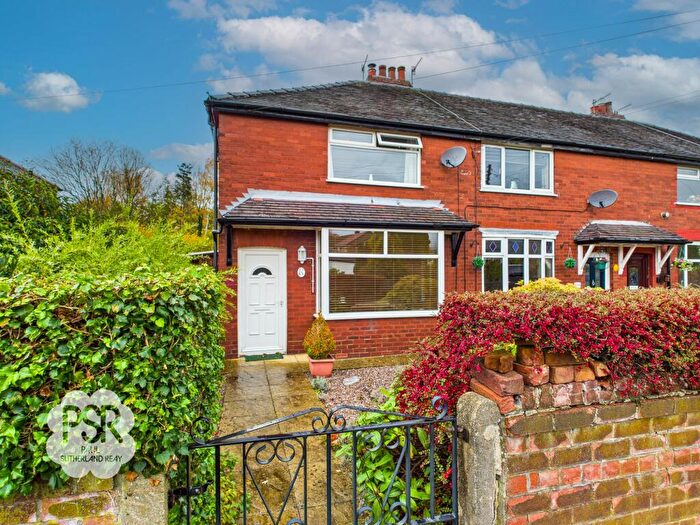
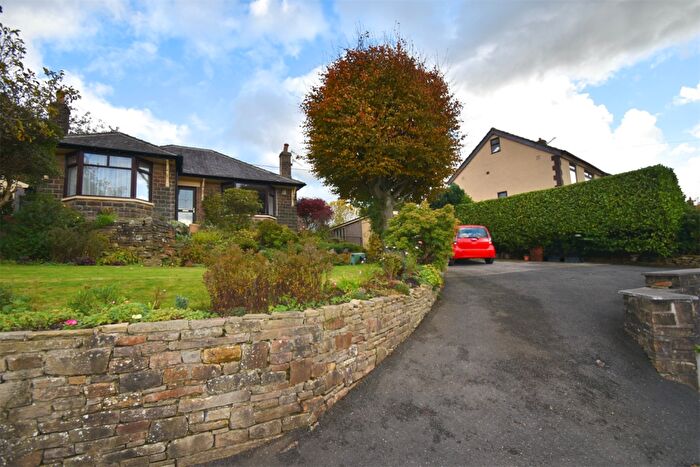
Properties for sale in New Mills East
Roads and Postcodes in New Mills East
Navigate through our locations to find the location of your next house in New Mills East, High Peak for sale or to rent.
| Streets | Postcodes |
|---|---|
| Arden Estate | SK22 4PH |
| Bakehurst Close | SK22 4PT |
| Beard Crescent | SK22 4LH SK22 4LJ |
| Beech Avenue | SK22 4HU |
| Bowden Crescent | SK22 4LN |
| Bridleway | SK22 4HD |
| Cale Road | SK22 4LW |
| Carr View | SK22 4PR |
| Chestnut Close | SK22 4HZ |
| Church Road | SK22 4NJ SK22 4NU SK22 4PF |
| Derby Road | SK22 4HW |
| Digland Villas | SK22 4HS |
| Diglands Avenue | SK22 4JD |
| Ellerscroft | SK22 4JA |
| Ensor Way | SK22 4NQ |
| Falcon Close | SK22 4JQ |
| Furness Vale | SK23 7QF |
| Garrison Road | SK22 1DQ |
| Goyt Road | SK22 4PB |
| Goytside | SK22 4PS |
| Griffin Close | SK22 4PX |
| Hawk Road | SK22 4JJ |
| Hayfield Road | SK22 1DF SK22 1DG SK22 4HY SK22 4JB SK22 4QH |
| High Hill Road | SK22 4HG SK22 4HN SK22 4HQ |
| Highfield Terrace | SK22 4LP |
| Hyde Bank Road | SK22 4BW SK22 4AJ SK22 4BF |
| Jubilee Gardens | SK22 4PL |
| Jubilee Street | SK22 4NX SK22 4PA |
| Ladypit Road | SK23 7TD |
| Laneside Road | SK22 4LT SK22 4LU SK22 4LX SK22 4QN SK22 4NA |
| Lime Avenue | SK22 4HT |
| Low Leighton Road | SK22 4JF SK22 4JG SK22 4LR SK22 4PG SK22 4PJ SK22 4LS |
| Marsh Lane | SK22 4PN SK22 4PP |
| Mill Pond Avenue | SK22 4HL |
| Millers Vale | SK22 4QT |
| New Park Court | SK22 4NB |
| New Street | SK22 4PD SK22 4PE |
| Ollersett Avenue | SK22 4LE SK22 4LF SK22 4LG SK22 4LL |
| Ollersett Drive | SK22 4GA SK22 4GD SK22 4GE SK22 4GF |
| Ollersett Lane | SK22 4JE |
| Park Road | SK22 4NZ |
| Peak Road | SK22 4LA SK22 4LD |
| Pingot Road | SK22 4JH |
| Poplar Avenue | SK22 4HR |
| Portland Road | SK22 4HP |
| Quarry Road | SK22 4PQ |
| Roundway | SK22 4LQ |
| Rowarth Drive | SK22 4QS |
| Salem Cottages | SK22 4BN |
| St Andrews Walk | SK22 4JX |
| St Georges Road | SK22 4JT SK22 4JY SK22 4JZ SK22 4JU |
| Sycamore Close | SK22 4HX |
| The Mews | SK22 4GB |
| Watburn Road | SK22 4HH |
| Watford Bridge Road | SK22 4HJ |
| Yates Road | SK22 4NY |
| SK22 4QW SK22 4PW |
Transport near New Mills East
-
New Mills Central Station
-
New Mills Newtown Station
-
Furness Vale Station
-
Strines Station
-
Disley Station
-
Whaley Bridge Station
-
Chinley Station
- FAQ
- Price Paid By Year
- Property Type Price
Frequently asked questions about New Mills East
What is the average price for a property for sale in New Mills East?
The average price for a property for sale in New Mills East is £252,650. This amount is 16% lower than the average price in High Peak. There are 341 property listings for sale in New Mills East.
What streets have the most expensive properties for sale in New Mills East?
The streets with the most expensive properties for sale in New Mills East are Millers Vale at an average of £454,000, Diglands Avenue at an average of £350,412 and Watburn Road at an average of £335,000.
What streets have the most affordable properties for sale in New Mills East?
The streets with the most affordable properties for sale in New Mills East are Ollersett Drive at an average of £158,666, Roundway at an average of £160,000 and New Park Court at an average of £167,166.
Which train stations are available in or near New Mills East?
Some of the train stations available in or near New Mills East are New Mills Central, New Mills Newtown and Furness Vale.
Property Price Paid in New Mills East by Year
The average sold property price by year was:
| Year | Average Sold Price | Price Change |
Sold Properties
|
|---|---|---|---|
| 2025 | £261,286 | 6% |
60 Properties |
| 2024 | £244,661 | -3% |
65 Properties |
| 2023 | £252,675 | -4% |
43 Properties |
| 2022 | £262,471 | 22% |
51 Properties |
| 2021 | £205,215 | 2% |
69 Properties |
| 2020 | £200,220 | 4% |
69 Properties |
| 2019 | £192,690 | -4% |
63 Properties |
| 2018 | £200,161 | 6% |
75 Properties |
| 2017 | £187,822 | 9% |
74 Properties |
| 2016 | £170,056 | 14% |
65 Properties |
| 2015 | £146,126 | 8% |
84 Properties |
| 2014 | £134,210 | 5% |
74 Properties |
| 2013 | £127,284 | 6% |
56 Properties |
| 2012 | £119,251 | -4% |
35 Properties |
| 2011 | £124,342 | -6% |
52 Properties |
| 2010 | £131,306 | -4% |
47 Properties |
| 2009 | £136,161 | 3% |
38 Properties |
| 2008 | £131,717 | -23% |
34 Properties |
| 2007 | £161,448 | 18% |
85 Properties |
| 2006 | £132,740 | 1% |
101 Properties |
| 2005 | £131,785 | 7% |
110 Properties |
| 2004 | £122,650 | 22% |
69 Properties |
| 2003 | £95,743 | 11% |
92 Properties |
| 2002 | £85,535 | 19% |
115 Properties |
| 2001 | £69,528 | 16% |
81 Properties |
| 2000 | £58,366 | 6% |
78 Properties |
| 1999 | £55,145 | 12% |
60 Properties |
| 1998 | £48,662 | -3% |
59 Properties |
| 1997 | £50,232 | 10% |
60 Properties |
| 1996 | £45,233 | -13% |
45 Properties |
| 1995 | £51,087 | - |
44 Properties |
Property Price per Property Type in New Mills East
Here you can find historic sold price data in order to help with your property search.
The average Property Paid Price for specific property types in the last three years are:
| Property Type | Average Sold Price | Sold Properties |
|---|---|---|
| Semi Detached House | £259,288.00 | 60 Semi Detached Houses |
| Detached House | £467,250.00 | 10 Detached Houses |
| Terraced House | £232,042.00 | 92 Terraced Houses |
| Flat | £144,583.00 | 6 Flats |

