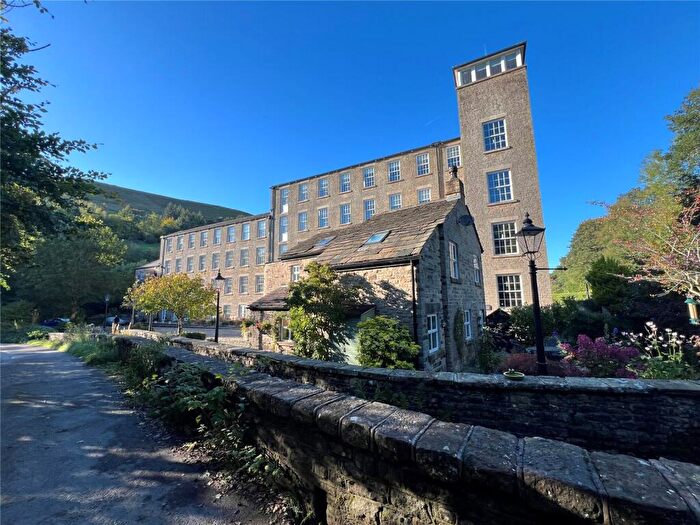
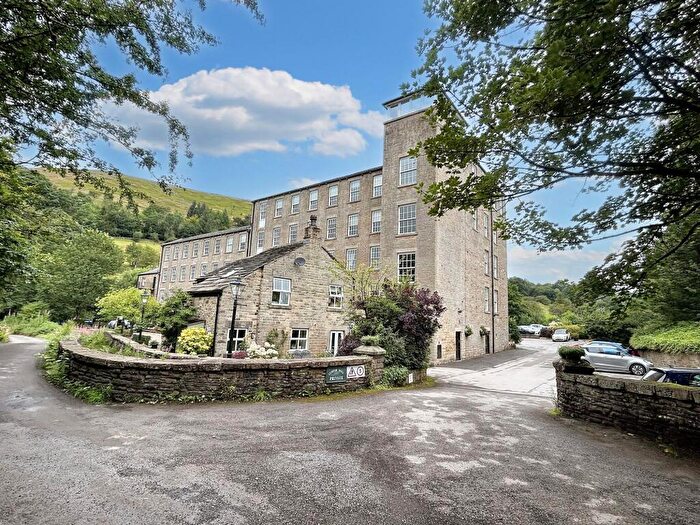
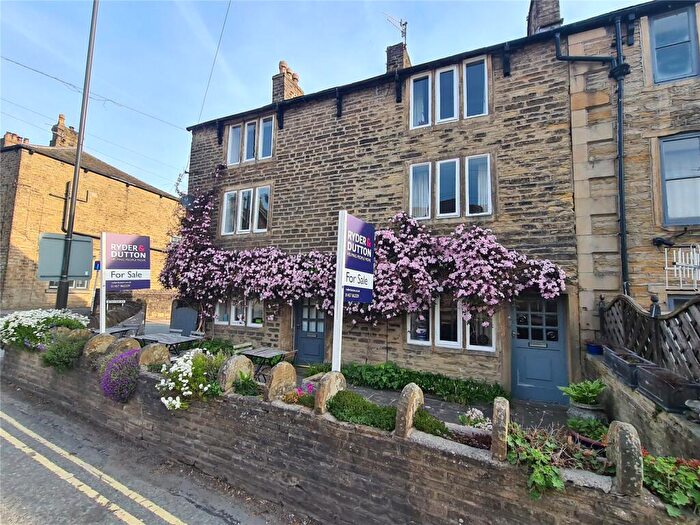
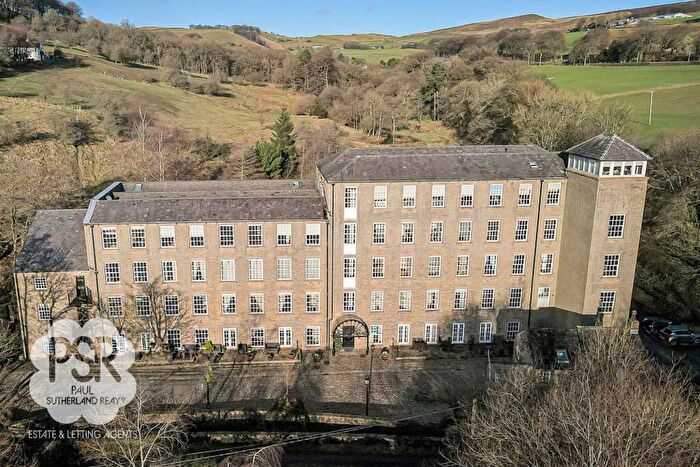
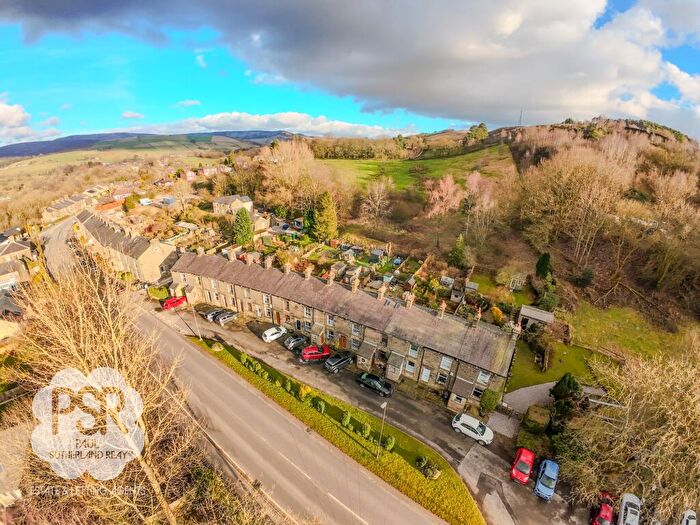
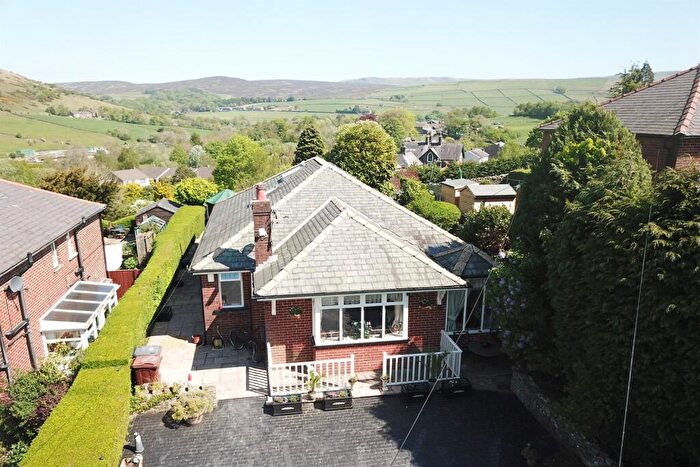
Houses for sale & to rent in Hayfield, High Peak
House Prices in Hayfield
Properties in Hayfield have an average house price of £317,675.00 and had 67 Property Transactions within the last 3 years¹.
Hayfield is an area in High Peak, Derbyshire with 911 households², where the most expensive property was sold for £789,000.00.
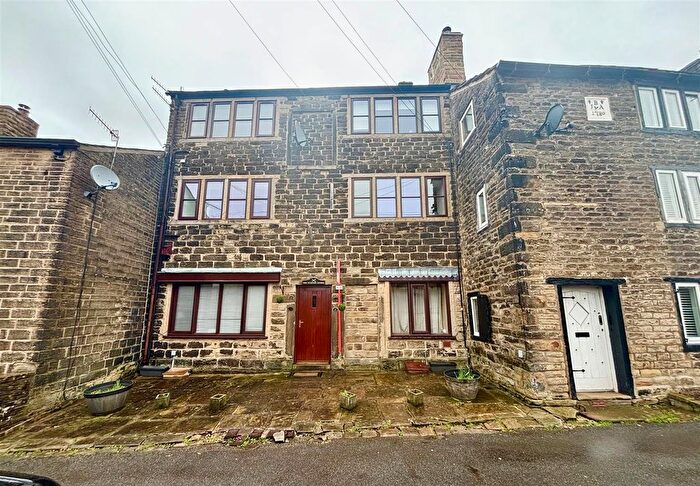
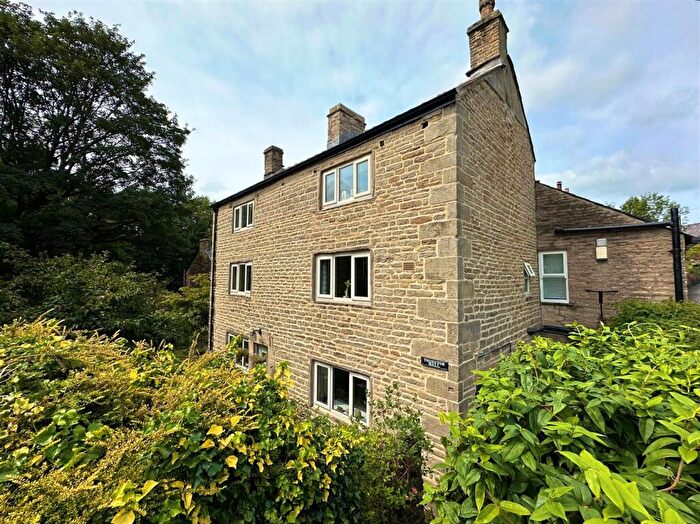
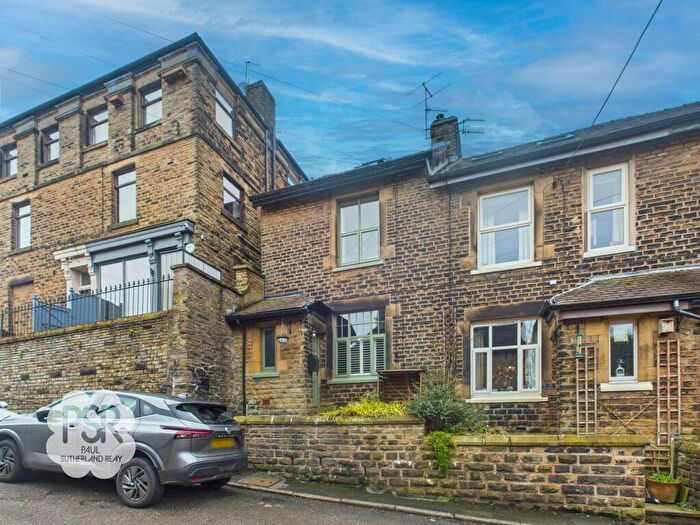
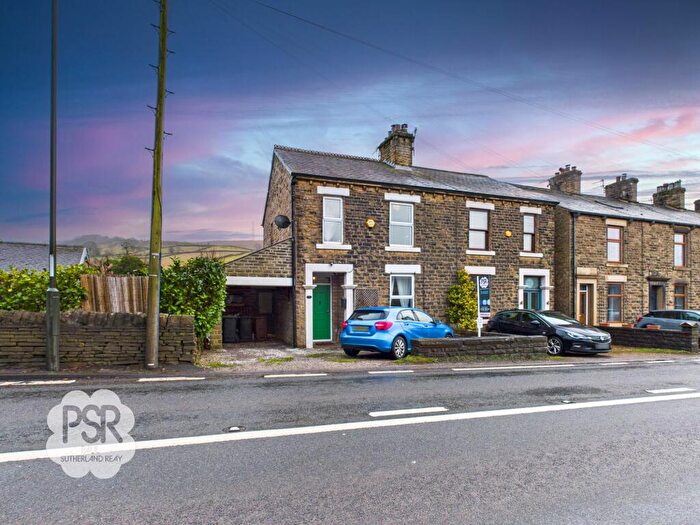
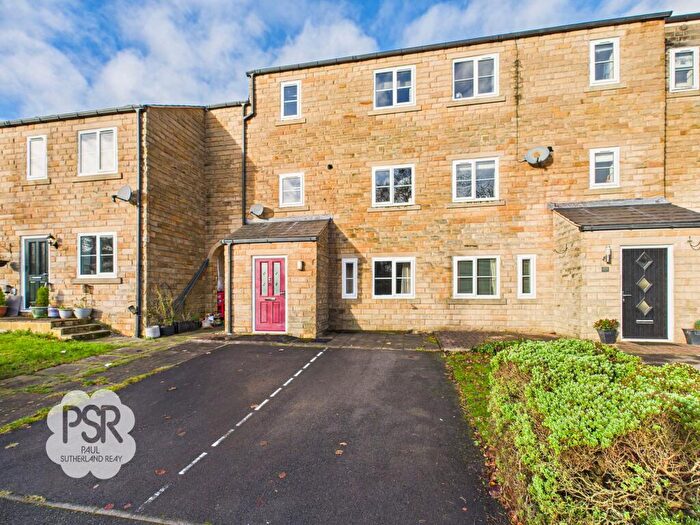
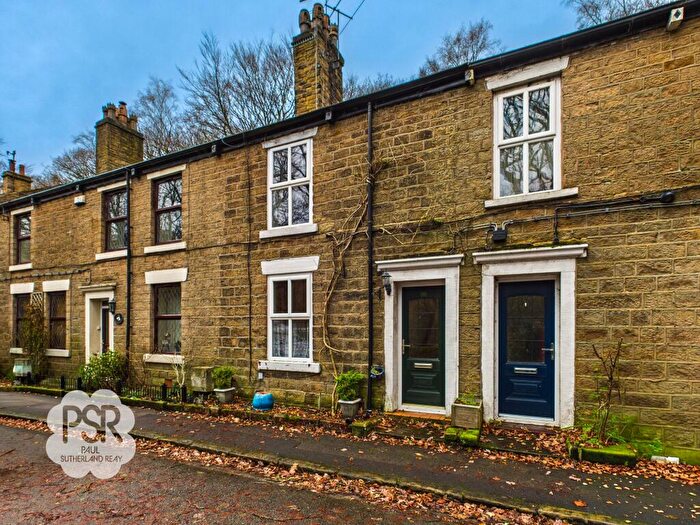
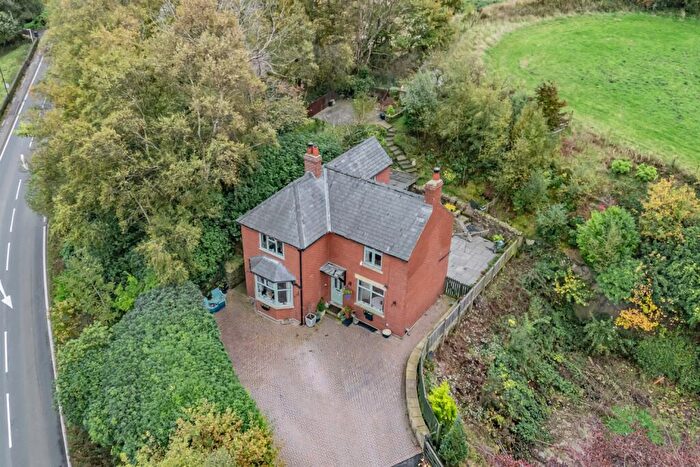
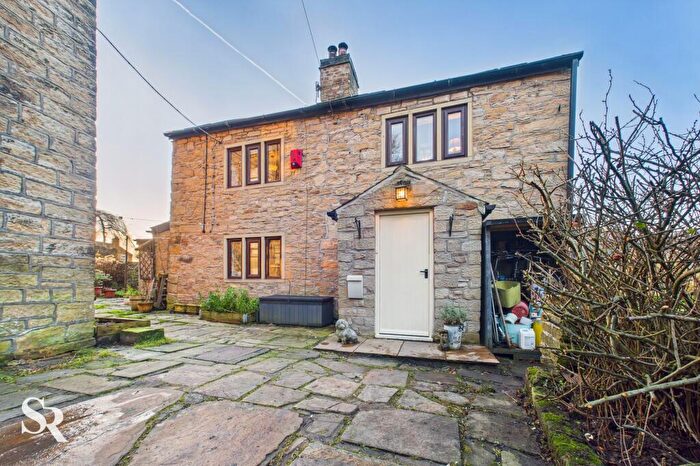
Properties for sale in Hayfield
Roads and Postcodes in Hayfield
Navigate through our locations to find the location of your next house in Hayfield, High Peak for sale or to rent.
| Streets | Postcodes |
|---|---|
| Bank Street | SK22 2EQ |
| Bank Vale Road | SK22 2EZ |
| Barnsfold Court | SK22 2PB |
| Basingwerke Court | SK22 2PE |
| Bluebell Close | SK22 2PG |
| Bowden Bridge | SK22 2LH |
| Bowden Close | SK22 2PJ |
| Brookhouse Court | SK22 2PD |
| Chapel Road | SK22 2JF SK22 2JS |
| Chapel Street | SK22 2JJ |
| Chendre Close | SK22 2PH |
| Church Street | SK22 2JE |
| Cote Lane | SK22 2HL |
| Edale Road | SK22 2LL |
| Ellers Bank | SK22 2LR |
| Fairy Bank Crescent | SK22 2HR |
| Fairy Bank Road | SK22 2NE |
| Fishers Bridge | SK22 2JZ |
| Glossop Road | SK22 2NF |
| Highfield Road | SK22 2HN |
| Highgate Road | SK22 2JL SK22 2JR SK22 2JW |
| Houghton Close | SK22 2PL |
| Kinder | SK22 2LQ |
| Kinder Road | SK22 2HJ SK22 2HS SK22 2LE SK22 2LJ |
| Lea Road | SK22 2HE |
| Lucas Terrace | SK22 2HG |
| Market Street | SK22 2EP SK22 2EW |
| Meadows Road | SK22 2JH |
| Mill Street | SK22 2EN |
| New Mills Road | SK22 2EU SK22 2EX SK22 2JG |
| North Road | SK22 2HW |
| Oaks Avenue | SK22 2JU |
| Phoside View | SK22 2JN |
| Pike Close | SK22 2HH |
| Ridge Top Lane | SK22 2JQ SK22 2JT |
| Rock Hall Cottages | SK22 2LS |
| Sett Bank | SK22 2LN |
| Shudehill | SK22 2ND |
| Shudehill Close | SK22 2HP |
| Spring Vale Road | SK22 2LD |
| Springfield Terrace | SK22 2LT |
| St John Street | SK22 2JX |
| Station Road | SK22 2ES |
| Steeple End Fold | SK22 2JD |
| Swallow House Crescent | SK22 2HD |
| Swallow House Lane | SK22 2HB SK22 2HF |
| The Glade | SK22 2AB |
| The Ridgeways | SK22 2AD |
| Valley Road | SK22 2LP SK22 2JP |
| Vicarage Lane | SK22 2HT |
| Wainhouse Brow | SK22 2ET |
| Walk Mill Road | SK22 2ER |
| Wood Gardens | SK22 2HQ |
| Wood Lane | SK22 2PA |
| SK23 6AJ |
Transport near Hayfield
- FAQ
- Price Paid By Year
- Property Type Price
Frequently asked questions about Hayfield
What is the average price for a property for sale in Hayfield?
The average price for a property for sale in Hayfield is £317,675. This amount is 6% higher than the average price in High Peak. There are 174 property listings for sale in Hayfield.
What streets have the most expensive properties for sale in Hayfield?
The streets with the most expensive properties for sale in Hayfield are Highgate Road at an average of £555,000, The Glade at an average of £550,500 and Wood Lane at an average of £495,000.
What streets have the most affordable properties for sale in Hayfield?
The streets with the most affordable properties for sale in Hayfield are Chapel Road at an average of £135,000, Pike Close at an average of £159,333 and Chapel Street at an average of £211,562.
Which train stations are available in or near Hayfield?
Some of the train stations available in or near Hayfield are Chinley, New Mills Central and Furness Vale.
Property Price Paid in Hayfield by Year
The average sold property price by year was:
| Year | Average Sold Price | Price Change |
Sold Properties
|
|---|---|---|---|
| 2025 | £282,589 | -11% |
14 Properties |
| 2024 | £312,725 | -10% |
30 Properties |
| 2023 | £345,490 | 6% |
23 Properties |
| 2022 | £323,106 | -0,1% |
31 Properties |
| 2021 | £323,363 | 12% |
30 Properties |
| 2020 | £284,641 | 24% |
26 Properties |
| 2019 | £214,918 | -29% |
25 Properties |
| 2018 | £276,277 | 10% |
43 Properties |
| 2017 | £247,583 | -17% |
30 Properties |
| 2016 | £288,724 | 10% |
41 Properties |
| 2015 | £261,118 | -4% |
40 Properties |
| 2014 | £271,794 | 18% |
31 Properties |
| 2013 | £221,580 | -2% |
31 Properties |
| 2012 | £226,810 | -5% |
24 Properties |
| 2011 | £239,149 | 14% |
18 Properties |
| 2010 | £205,789 | 10% |
32 Properties |
| 2009 | £185,000 | -32% |
10 Properties |
| 2008 | £245,071 | 14% |
26 Properties |
| 2007 | £211,234 | -2% |
38 Properties |
| 2006 | £214,611 | 13% |
56 Properties |
| 2005 | £186,565 | -9% |
38 Properties |
| 2004 | £203,033 | 18% |
48 Properties |
| 2003 | £166,453 | 14% |
48 Properties |
| 2002 | £142,583 | 3% |
48 Properties |
| 2001 | £138,021 | 16% |
46 Properties |
| 2000 | £115,699 | 14% |
57 Properties |
| 1999 | £99,402 | 24% |
83 Properties |
| 1998 | £75,772 | -17% |
40 Properties |
| 1997 | £88,667 | 37% |
34 Properties |
| 1996 | £55,526 | -19% |
35 Properties |
| 1995 | £66,137 | - |
28 Properties |
Property Price per Property Type in Hayfield
Here you can find historic sold price data in order to help with your property search.
The average Property Paid Price for specific property types in the last three years are:
| Property Type | Average Sold Price | Sold Properties |
|---|---|---|
| Semi Detached House | £283,470.00 | 17 Semi Detached Houses |
| Detached House | £480,765.00 | 16 Detached Houses |
| Terraced House | £271,267.00 | 30 Terraced Houses |
| Flat | £158,750.00 | 4 Flats |

