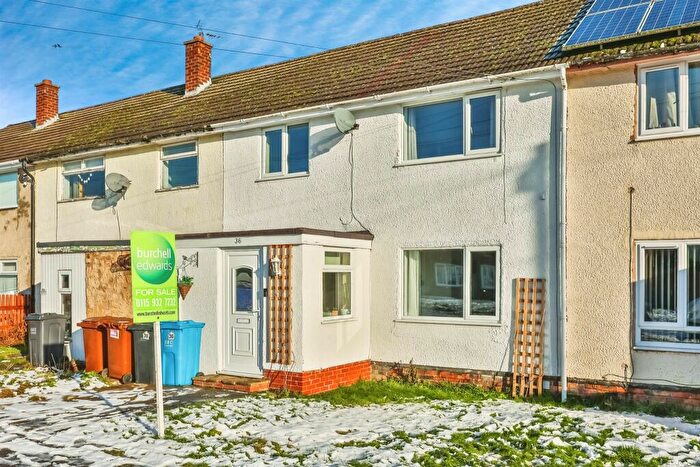
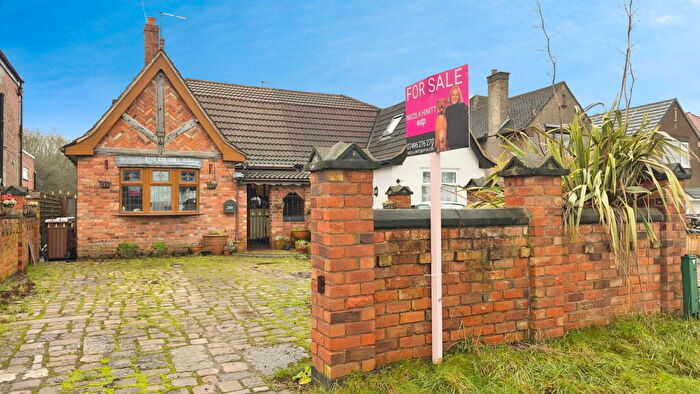
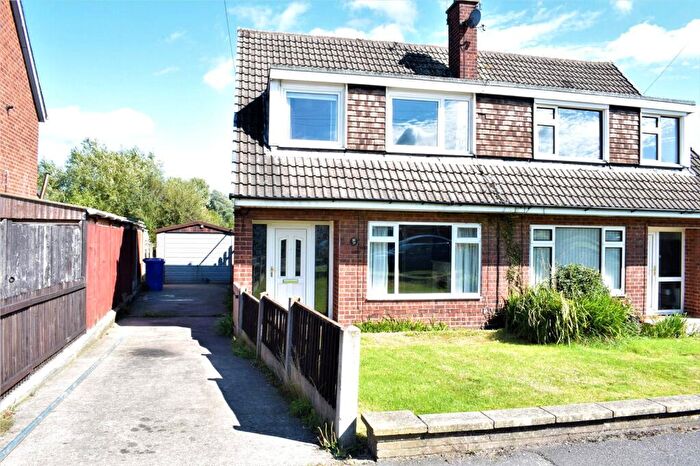
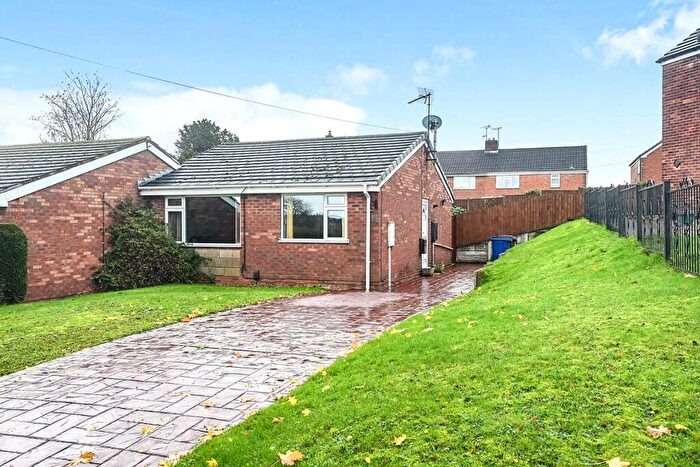
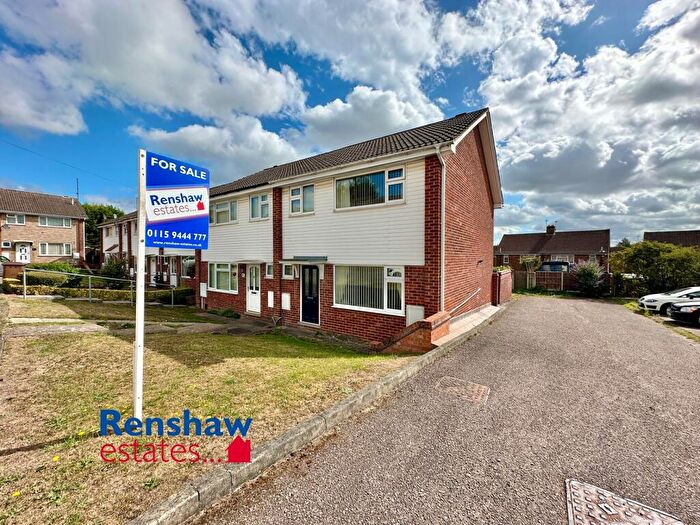
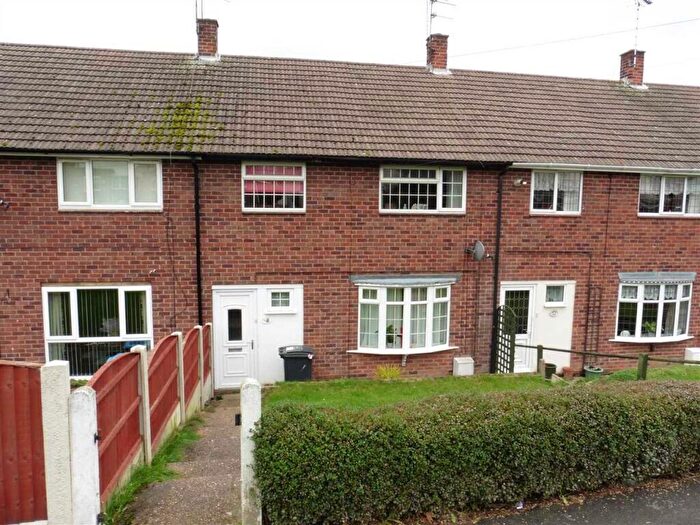
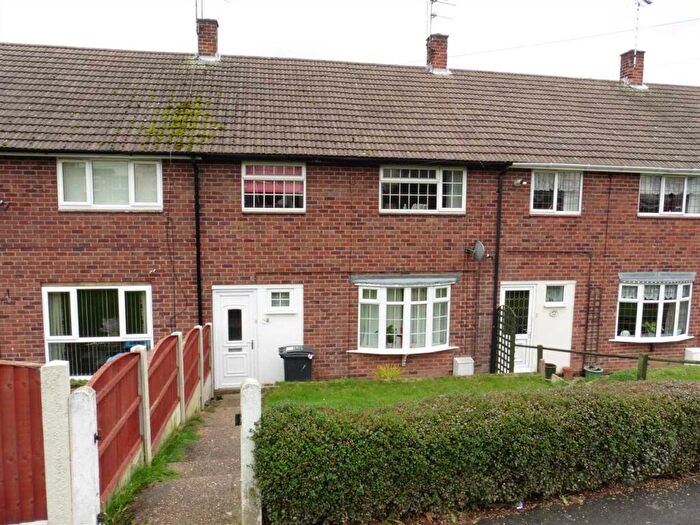
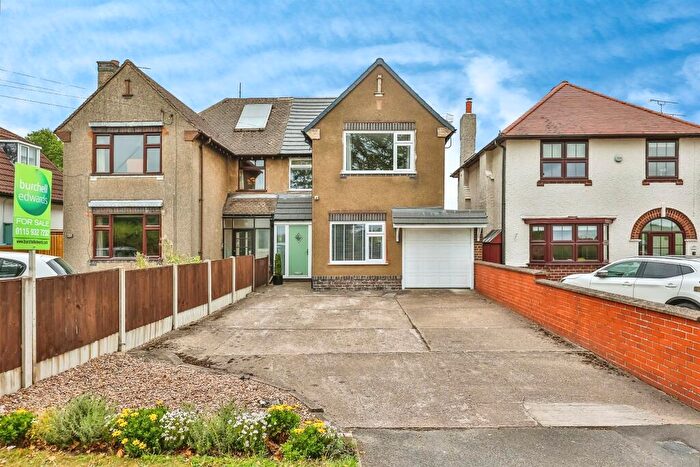
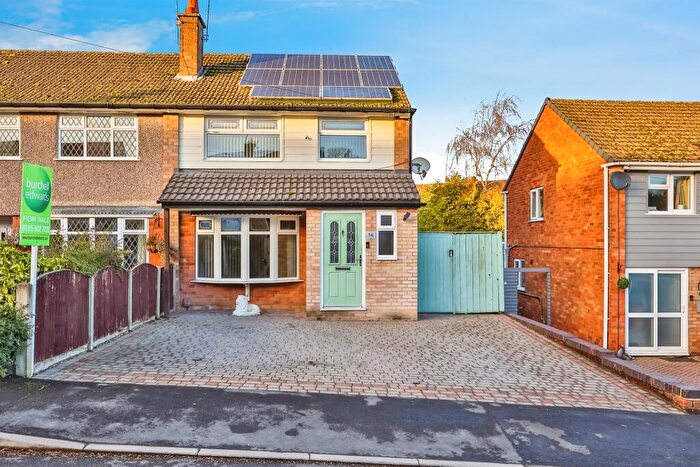
Houses for sale & to rent in Kirk Hallam, Ilkeston
House Prices in Kirk Hallam
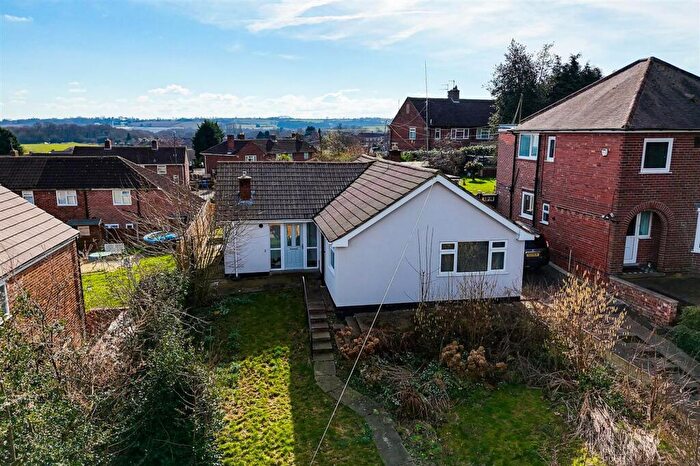
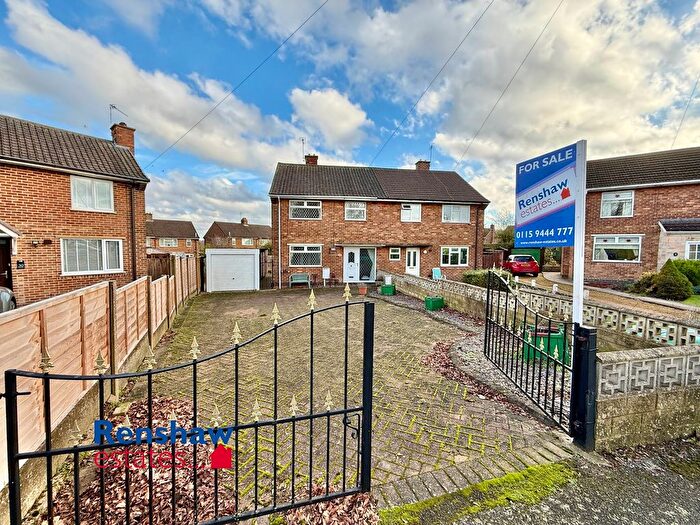
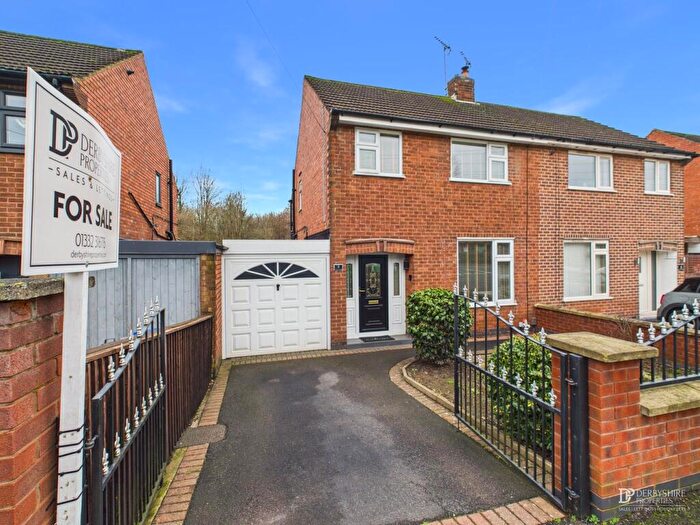
Properties in Kirk Hallam have an average house price of £176,895.00 and had 195 Property Transactions within the last 3 years¹.
Kirk Hallam is an area in Ilkeston, Derbyshire with 2,524 households², where the most expensive property was sold for £410,000.00.
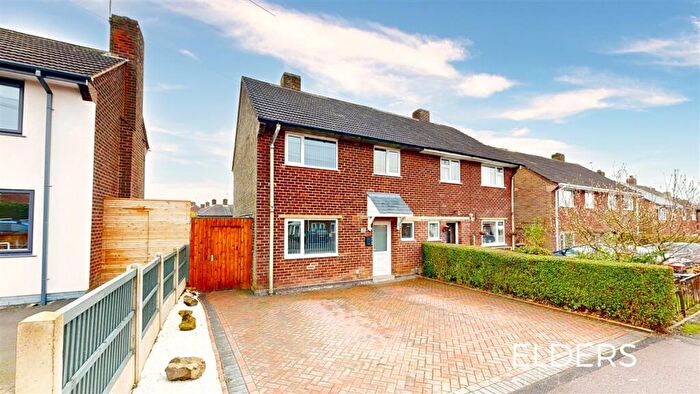
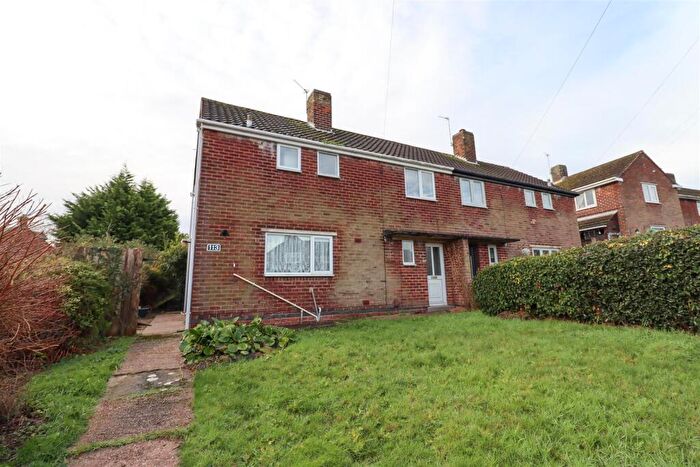
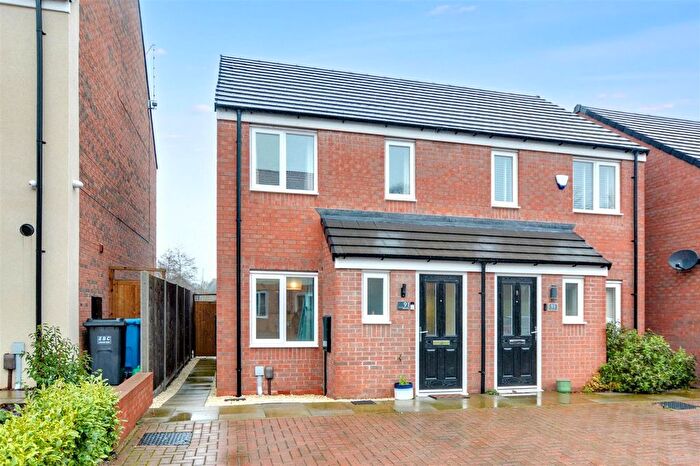
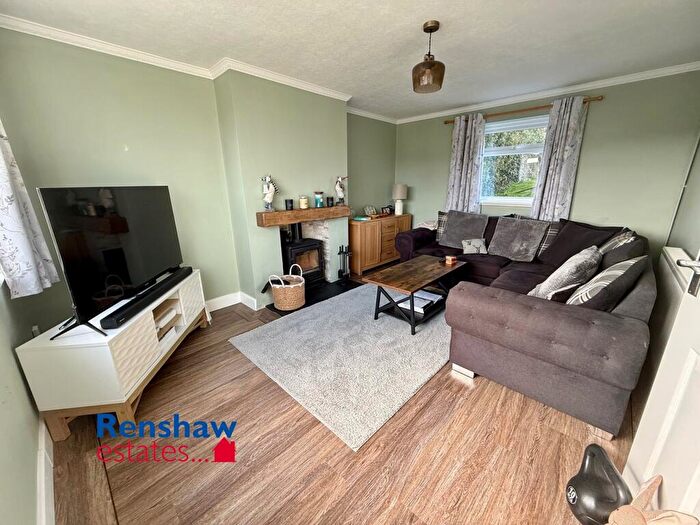
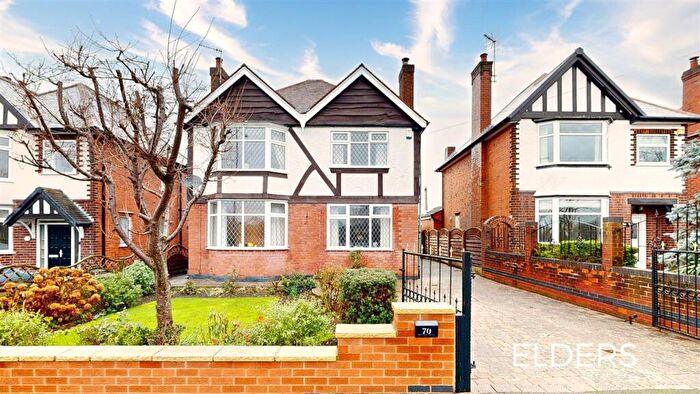
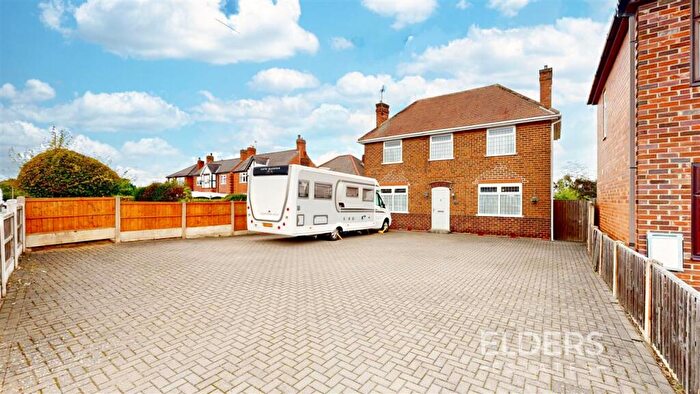
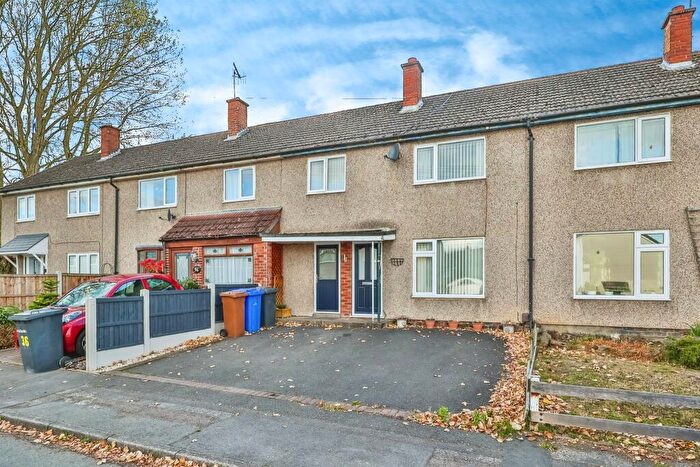
Properties for sale in Kirk Hallam
Previously listed properties in Kirk Hallam
Roads and Postcodes in Kirk Hallam
Navigate through our locations to find the location of your next house in Kirk Hallam, Ilkeston for sale or to rent.
| Streets | Postcodes |
|---|---|
| Abbot Road | DE7 4HX DE7 4HY |
| Ascot Place | DE7 4GB |
| Avondale Road | DE7 4GA |
| Balmoral Road | DE7 4FN |
| Bankfield Drive | DE7 4JL |
| Belvoir Close | DE7 4ND |
| Braefield Close | DE7 4JS |
| Buckminster Road | DE7 4GT |
| Bunting Close | DE7 4JE |
| Chatsworth Place | DE7 4GG |
| Coniston Drive | DE7 4FG |
| Crosshill Drive | DE7 4JR |
| Dallimore Road | DE7 4GZ |
| Depedale Avenue | DE7 4EL DE7 4FF |
| Dumbles Close | DE7 4HZ |
| Eaton Avenue | DE7 4HL |
| Eliot Drive | DE7 4FL |
| Festival Road | DE7 4EY |
| Friars Court | DE7 4JA |
| Glendon Road | DE7 4GQ |
| Godfrey Drive | DE7 4HF DE7 4HJ DE7 4HN DE7 4HP DE7 4HR DE7 4HS DE7 4HT DE7 4HU DE7 4HW |
| Goodwood Crescent | DE7 4HA |
| Hardwick Place | DE7 4GF |
| Hemlock Lane | DE7 4NN |
| Henshaw Avenue | DE7 4FE |
| Highfield Drive | DE7 4JN |
| Hillary Place | DE7 4GH |
| Kenilworth Drive | DE7 4EW DE7 4EX DE7 4FH DE7 4FJ |
| Keswick Close | DE7 4FS |
| Ladywood Road | DE7 4NE DE7 4NF DE7 4NH DE7 4NJ DE7 4NQ DE7 4NS |
| Lime Tree Rise | DE7 4JZ |
| Lock Close | DE7 4HG |
| Macdonald Square | DE7 4FD |
| Marshall Way | DE7 4LA |
| Meerbrook Place | DE7 4NY |
| Nutbrook Crescent | DE7 4GY |
| Nuthall Circle | DE7 4GU |
| Oliver Road | DE7 4JW DE7 4JY |
| Poplar Way | DE7 4NP |
| Priory Close | DE7 4JF |
| Queen Elizabeth Way | DE7 4NT DE7 4NU DE7 4NW |
| Ribblesdale | DE7 4GD |
| Ridgeway Drive | DE7 4JP |
| Sandringham Place | DE7 4FP |
| Sharp Close | DE7 4JB |
| Sow Brook Lane | DE7 4PD |
| St Norbert Drive | DE7 4EF DE7 4EG DE7 4EH DE7 4EJ DE7 4EN DE7 4EP DE7 4EQ DE7 4ER DE7 4ES DE7 4ET DE7 4EU |
| Sunningdale Drive | DE7 4JJ DE7 4JQ |
| Tilton Grove | DE7 4GR |
| Toad Hole Close | DE7 4RP |
| Trent Road | DE7 4HB |
| Tudor Place | DE7 4NX |
| Vine Farm Close | DE7 4NG |
| Welbeck Avenue | DE7 4NL |
| Westfield Close | DE7 4JT |
| Windermere Avenue | DE7 4EZ DE7 4FB DE7 4FQ DE7 4FR |
| Windsor Crescent | DE7 4HD DE7 4HE |
| Wirksworth Road | DE7 4GE DE7 4GJ DE7 4GL DE7 4GN DE7 4GP DE7 4GS DE7 4GW |
| Woolsthorpe Crescent | DE7 4GX |
| Wyndale Drive | DE7 4JD DE7 4JG DE7 4JH |
Transport near Kirk Hallam
- FAQ
- Price Paid By Year
- Property Type Price
Frequently asked questions about Kirk Hallam
What is the average price for a property for sale in Kirk Hallam?
The average price for a property for sale in Kirk Hallam is £176,895. This amount is 15% lower than the average price in Ilkeston. There are 565 property listings for sale in Kirk Hallam.
What streets have the most expensive properties for sale in Kirk Hallam?
The streets with the most expensive properties for sale in Kirk Hallam are Poplar Way at an average of £265,000, Ridgeway Drive at an average of £262,500 and Hardwick Place at an average of £207,500.
What streets have the most affordable properties for sale in Kirk Hallam?
The streets with the most affordable properties for sale in Kirk Hallam are Lock Close at an average of £125,500, Buckminster Road at an average of £130,000 and Priory Close at an average of £133,500.
Which train stations are available in or near Kirk Hallam?
Some of the train stations available in or near Kirk Hallam are Ilkeston, Langley Mill and Spondon.
Property Price Paid in Kirk Hallam by Year
The average sold property price by year was:
| Year | Average Sold Price | Price Change |
Sold Properties
|
|---|---|---|---|
| 2025 | £182,670 | 4% |
71 Properties |
| 2024 | £176,157 | 4% |
73 Properties |
| 2023 | £169,911 | -1% |
51 Properties |
| 2022 | £170,964 | 7% |
73 Properties |
| 2021 | £159,406 | 8% |
94 Properties |
| 2020 | £147,295 | 7% |
71 Properties |
| 2019 | £137,306 | 5% |
95 Properties |
| 2018 | £131,075 | 7% |
81 Properties |
| 2017 | £122,014 | 8% |
91 Properties |
| 2016 | £112,313 | 4% |
80 Properties |
| 2015 | £107,601 | 10% |
85 Properties |
| 2014 | £96,479 | 7% |
64 Properties |
| 2013 | £89,959 | 2% |
79 Properties |
| 2012 | £87,818 | -6% |
61 Properties |
| 2011 | £93,453 | -9% |
53 Properties |
| 2010 | £101,554 | 17% |
50 Properties |
| 2009 | £84,090 | -26% |
50 Properties |
| 2008 | £105,601 | 2% |
43 Properties |
| 2007 | £103,786 | 1% |
73 Properties |
| 2006 | £102,416 | 7% |
93 Properties |
| 2005 | £95,305 | 8% |
69 Properties |
| 2004 | £87,543 | 18% |
92 Properties |
| 2003 | £71,394 | 28% |
76 Properties |
| 2002 | £51,523 | 13% |
78 Properties |
| 2001 | £44,661 | 13% |
86 Properties |
| 2000 | £38,685 | 12% |
72 Properties |
| 1999 | £33,934 | -8% |
70 Properties |
| 1998 | £36,765 | -2% |
72 Properties |
| 1997 | £37,560 | 21% |
73 Properties |
| 1996 | £29,680 | -8% |
46 Properties |
| 1995 | £32,184 | - |
46 Properties |
Property Price per Property Type in Kirk Hallam
Here you can find historic sold price data in order to help with your property search.
The average Property Paid Price for specific property types in the last three years are:
| Property Type | Average Sold Price | Sold Properties |
|---|---|---|
| Semi Detached House | £179,178.00 | 124 Semi Detached Houses |
| Detached House | £261,916.00 | 12 Detached Houses |
| Terraced House | £157,253.00 | 57 Terraced Houses |
| Flat | £85,000.00 | 2 Flats |

