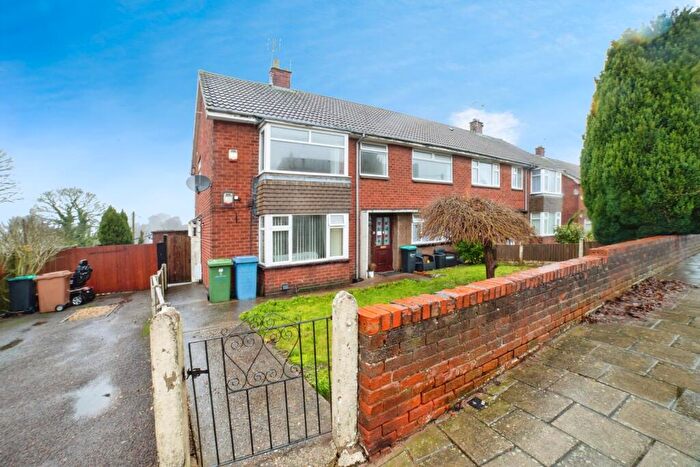
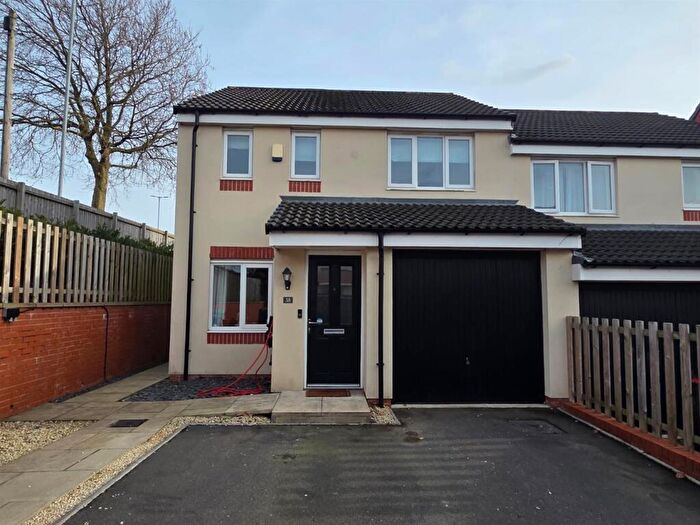
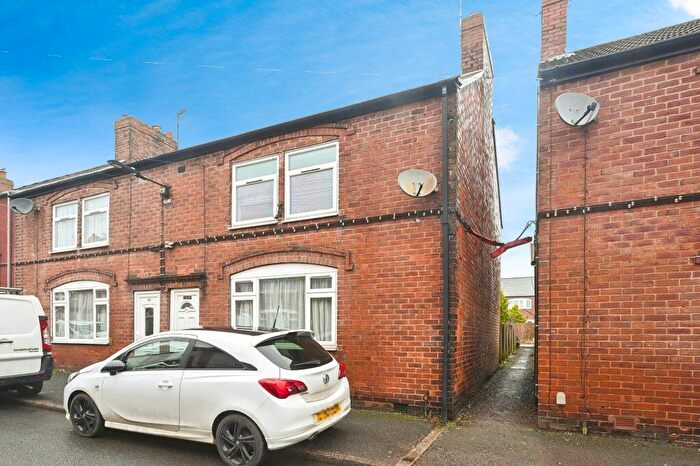
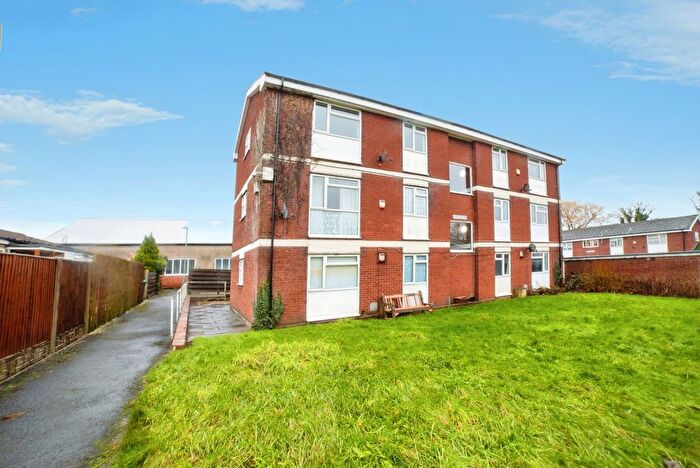
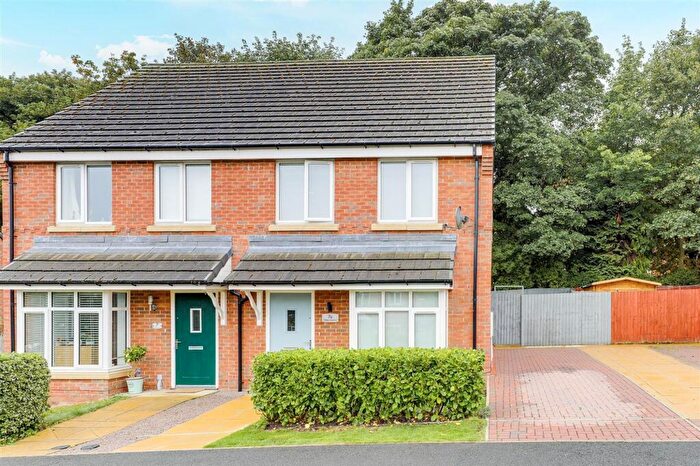
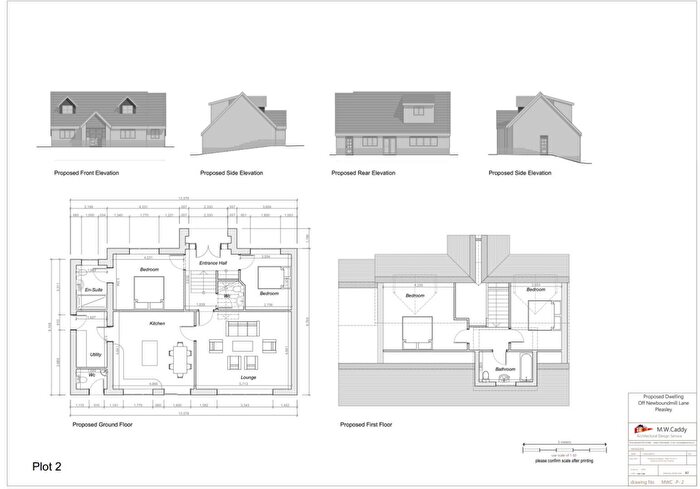
Houses for sale & to rent in Pleasley, Mansfield
House Prices in Pleasley
Properties in Pleasley have an average house price of £181,326.00 and had 105 Property Transactions within the last 3 years¹.
Pleasley is an area in Mansfield, Derbyshire with 1,026 households², where the most expensive property was sold for £595,000.00.
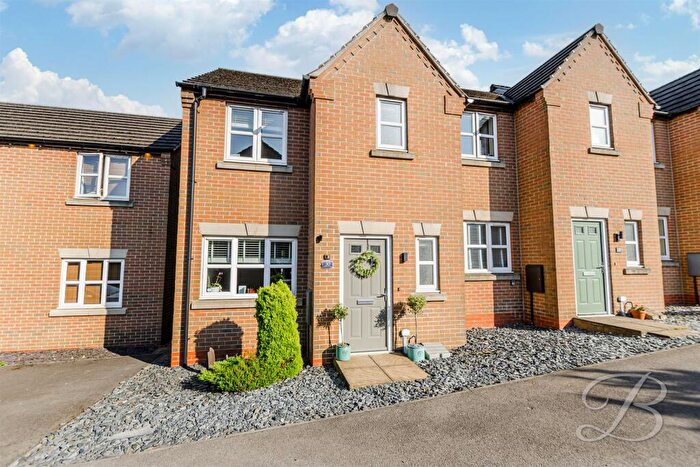
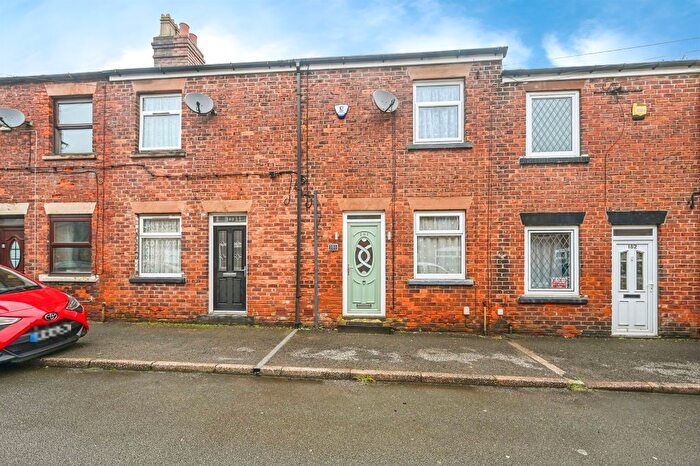
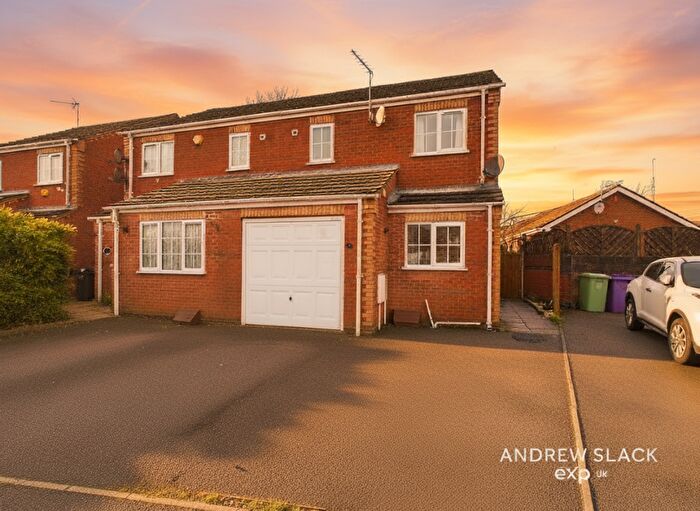
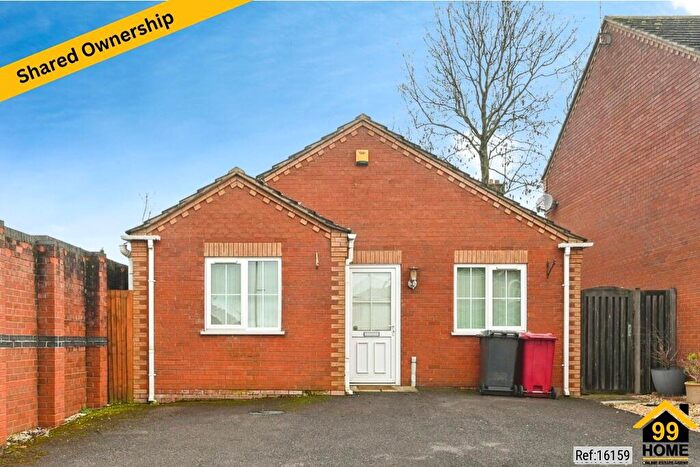
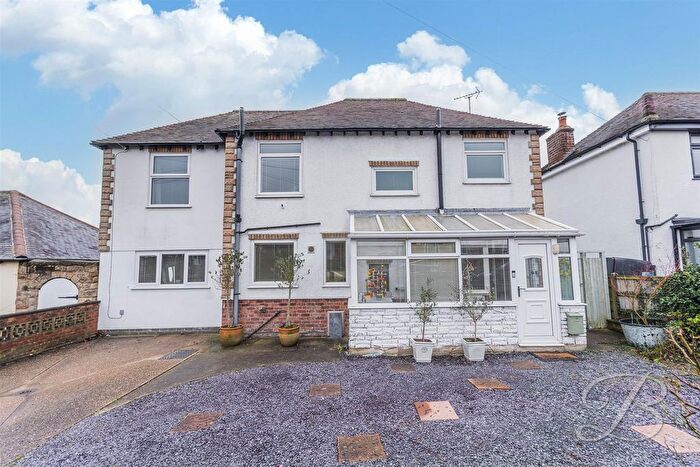
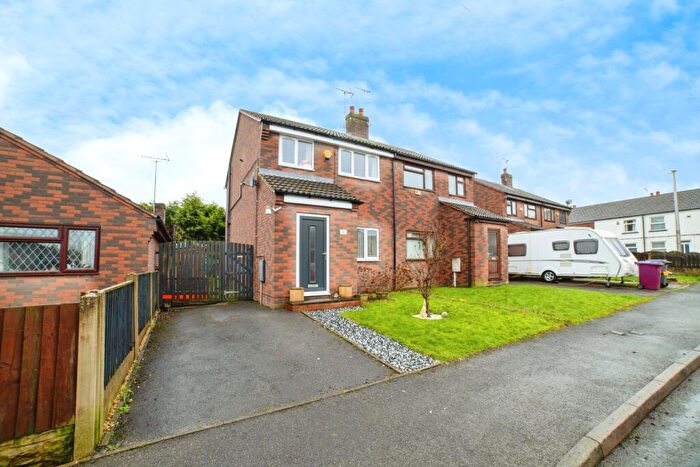
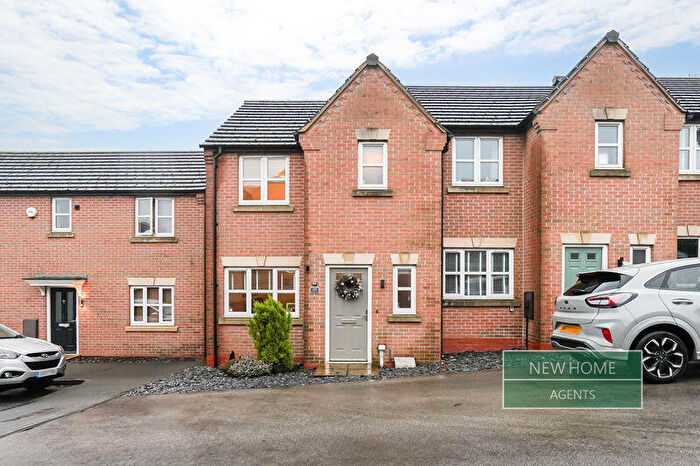
Properties for sale in Pleasley
Roads and Postcodes in Pleasley
Navigate through our locations to find the location of your next house in Pleasley, Mansfield for sale or to rent.
| Streets | Postcodes |
|---|---|
| Appleby Road | NG19 8SW |
| Bek Close | NG19 8BY |
| Booth Avenue | NG19 7TE |
| Chapel Street | NG19 8TY |
| Chesterfield Road | NG19 7PD NG19 7PE NG19 7PF NG19 7PJ NG19 7PQ NG19 8SL |
| Chesterfield Road North | NG19 7PA NG19 7PB |
| Church Lane | NG19 7TD |
| Church View | NG19 8TW |
| Coronation Avenue | NG19 8ST |
| Crompton Street | NG19 8TJ |
| Crookes Avenue | NG19 7PP |
| Deansgate | NG19 7QW |
| Devonshire Street | NG19 8SU NG19 8SX |
| Florence Close | NG19 7TB |
| Hardwick View Close | NG19 8SJ |
| Holbrook Close | NG19 7QP |
| Holly Bank Close | NG19 7ST |
| Leas Avenue | NG19 7PR |
| Meden Avenue | NG19 8SP NG19 8SR |
| Naples Crescent | NG19 7EA |
| New Terrace | NG19 7PY |
| Newboundmill Lane | NG19 7PL NG19 7PT NG19 7QA NG19 7QB |
| Nightingale Avenue | NG19 7QN |
| Old School Lane | NG19 7PW |
| Old Terrace | NG19 7QR |
| Outgang Lane | NG19 8RL |
| Park View | NG19 7QE |
| Parthenon Close | NG19 7SX |
| Pavilion Gardens | NG19 8TT |
| Phoenix Rise | NG19 7EY |
| Pit Lane | NG19 7PH |
| Pleasley Vale | NG19 8SE |
| Portland Street | NG19 8SY NG19 8SZ |
| Recreation Road | NG19 8TL |
| Rockley Cottages | NG19 8TS |
| Rotherham Road | NG19 7PG NG19 8TA NG19 8TD NG19 8TE |
| Stanton Place | NG19 8TX |
| Stanton Street | NG19 8TQ |
| Terrace Lane | NG19 7PU |
| The Paddocks | NG19 7PX |
| The Willows | NG19 7SN |
| Vale House Mews | NG19 8RQ |
| Verney Street | NG19 8TH |
| Verney Way | NG19 8TU |
| Wilkinson Close | NG19 7PS |
| NG19 8TR |
Transport near Pleasley
-
Mansfield Woodhouse Station
-
Shirebrook (Derbys) Station
-
Mansfield Town Station
-
Langwith Station
-
Sutton Parkway Station
- FAQ
- Price Paid By Year
- Property Type Price
Frequently asked questions about Pleasley
What is the average price for a property for sale in Pleasley?
The average price for a property for sale in Pleasley is £181,326. This amount is 19% higher than the average price in Mansfield. There are 459 property listings for sale in Pleasley.
What streets have the most expensive properties for sale in Pleasley?
The streets with the most expensive properties for sale in Pleasley are Vale House Mews at an average of £544,000, Hardwick View Close at an average of £313,750 and Crookes Avenue at an average of £265,000.
What streets have the most affordable properties for sale in Pleasley?
The streets with the most affordable properties for sale in Pleasley are Portland Street at an average of £96,136, Crompton Street at an average of £105,000 and Devonshire Street at an average of £117,653.
Which train stations are available in or near Pleasley?
Some of the train stations available in or near Pleasley are Mansfield Woodhouse, Shirebrook (Derbys) and Mansfield Town.
Property Price Paid in Pleasley by Year
The average sold property price by year was:
| Year | Average Sold Price | Price Change |
Sold Properties
|
|---|---|---|---|
| 2025 | £175,681 | -9% |
22 Properties |
| 2024 | £191,198 | 12% |
53 Properties |
| 2023 | £168,025 | -4% |
30 Properties |
| 2022 | £175,357 | 13% |
34 Properties |
| 2021 | £153,335 | 6% |
55 Properties |
| 2020 | £144,313 | -1% |
45 Properties |
| 2019 | £145,984 | 6% |
51 Properties |
| 2018 | £137,851 | 6% |
54 Properties |
| 2017 | £129,604 | 8% |
43 Properties |
| 2016 | £119,388 | -9% |
69 Properties |
| 2015 | £129,617 | 0,4% |
62 Properties |
| 2014 | £129,046 | - |
31 Properties |
| 2013 | £129,049 | -2% |
32 Properties |
| 2012 | £132,084 | 16% |
41 Properties |
| 2011 | £111,209 | -4% |
53 Properties |
| 2010 | £116,108 | 2% |
43 Properties |
| 2009 | £113,467 | -2% |
34 Properties |
| 2008 | £115,708 | 11% |
25 Properties |
| 2007 | £103,105 | -10% |
49 Properties |
| 2006 | £113,894 | 17% |
48 Properties |
| 2005 | £95,014 | 7% |
52 Properties |
| 2004 | £88,143 | 13% |
69 Properties |
| 2003 | £76,717 | 40% |
54 Properties |
| 2002 | £46,066 | -14% |
72 Properties |
| 2001 | £52,330 | -2% |
93 Properties |
| 2000 | £53,565 | -12% |
74 Properties |
| 1999 | £60,176 | 39% |
34 Properties |
| 1998 | £36,938 | -9% |
26 Properties |
| 1997 | £40,315 | -21% |
39 Properties |
| 1996 | £48,653 | -14% |
41 Properties |
| 1995 | £55,619 | - |
37 Properties |
Property Price per Property Type in Pleasley
Here you can find historic sold price data in order to help with your property search.
The average Property Paid Price for specific property types in the last three years are:
| Property Type | Average Sold Price | Sold Properties |
|---|---|---|
| Semi Detached House | £191,708.00 | 36 Semi Detached Houses |
| Detached House | £240,804.00 | 32 Detached Houses |
| Terraced House | £119,783.00 | 37 Terraced Houses |

