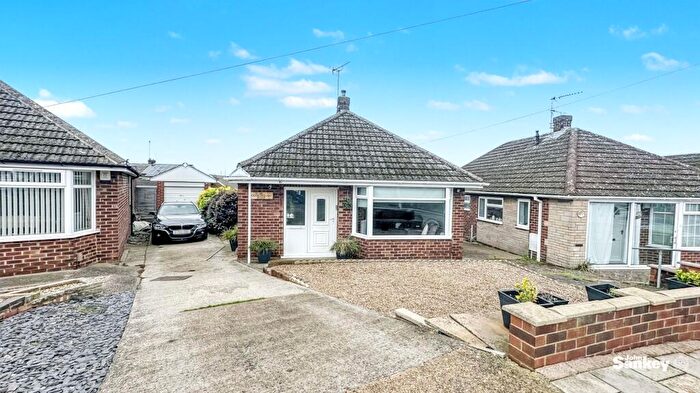
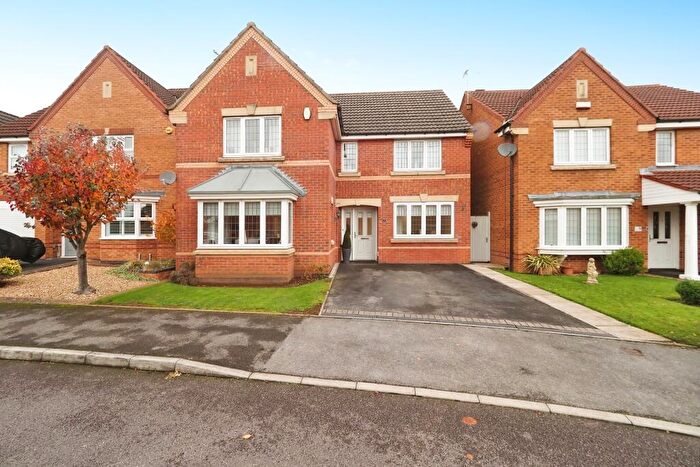
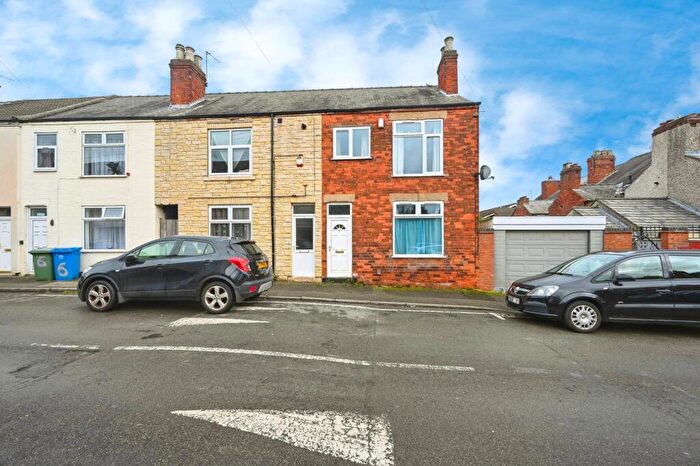
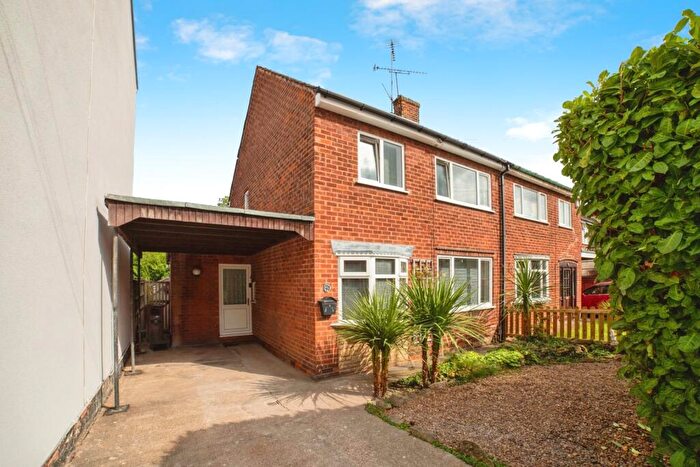
Houses for sale & to rent in Abbott, Mansfield
House Prices in Abbott
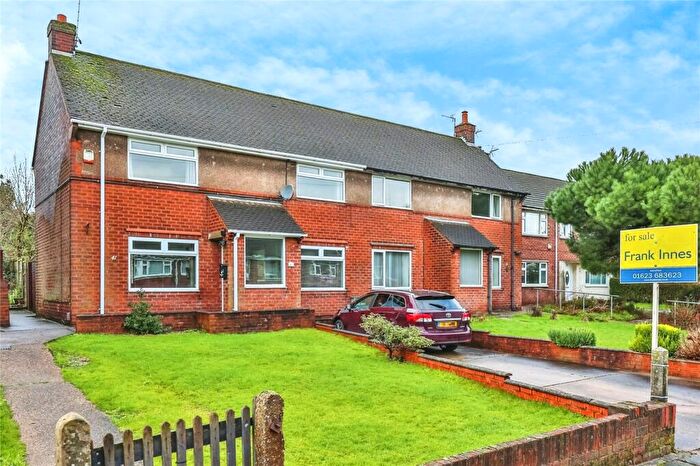
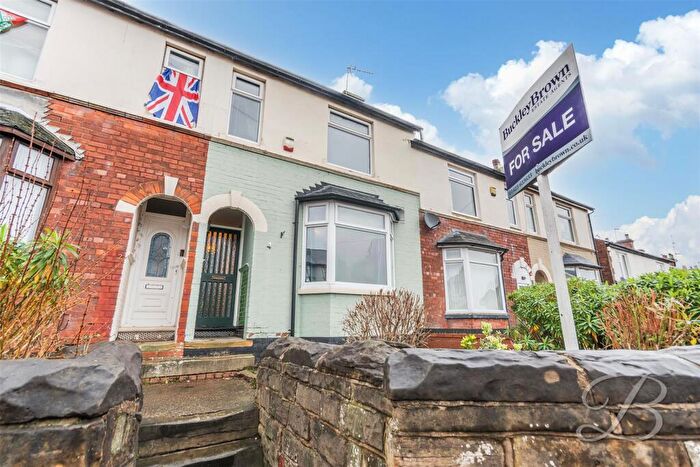
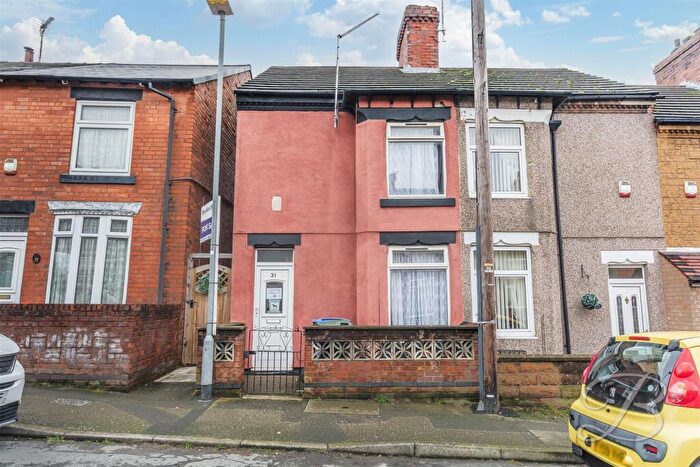
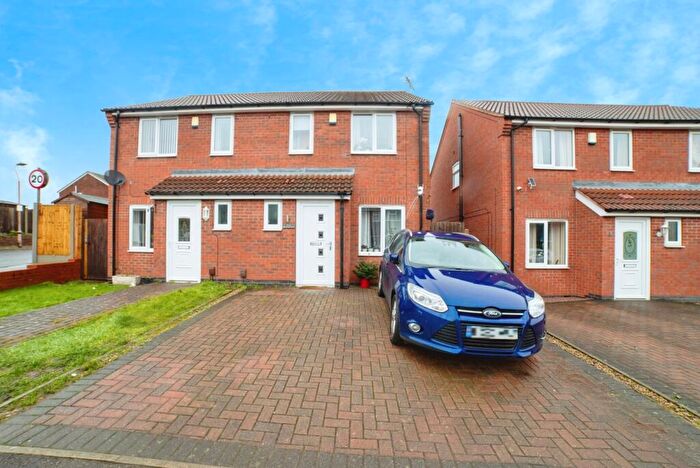
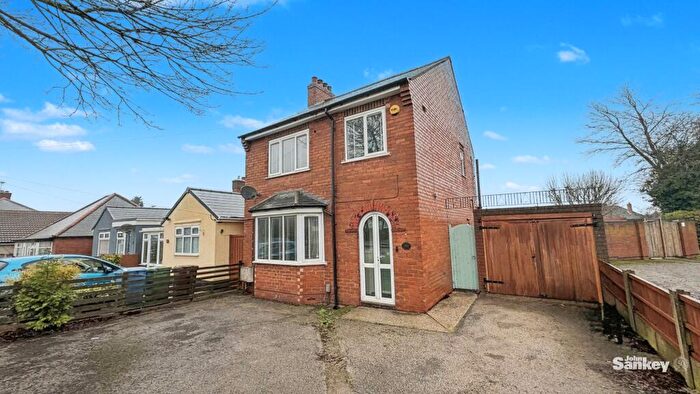
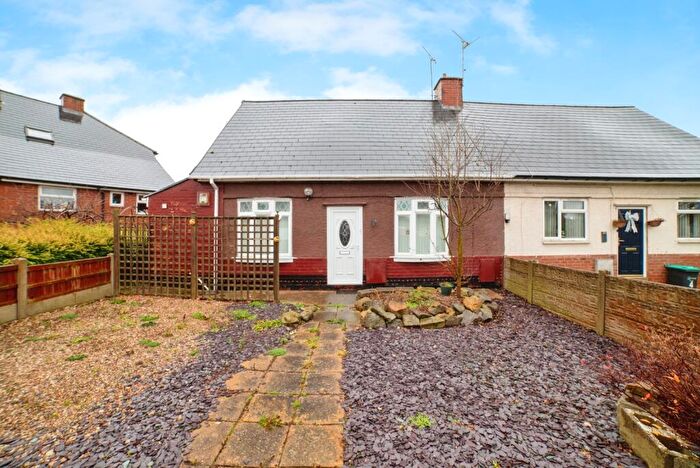
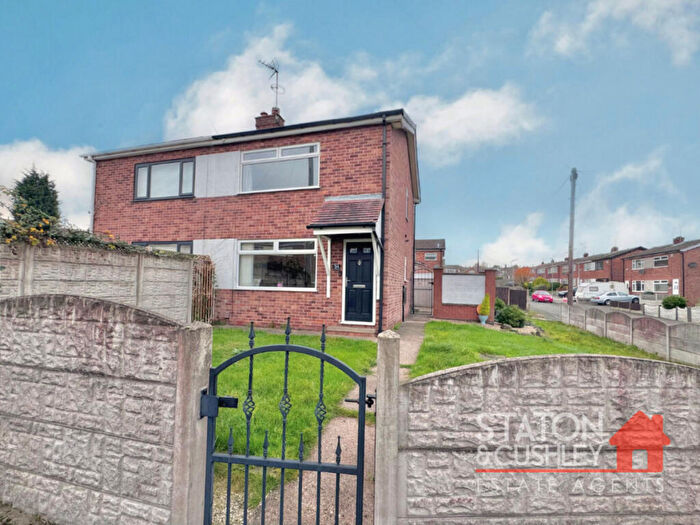
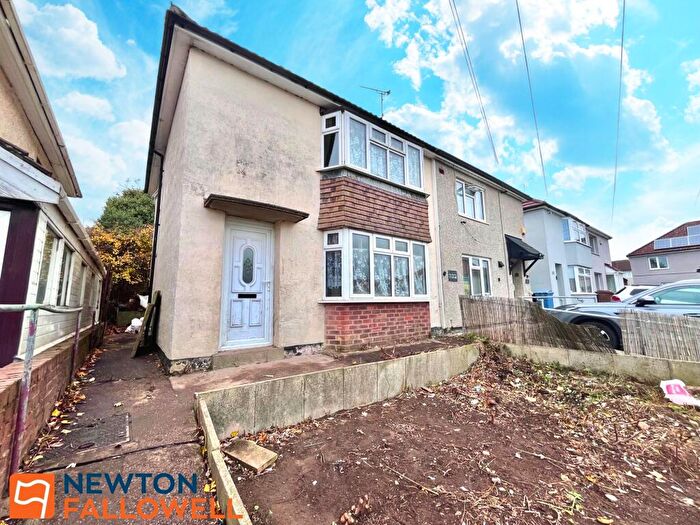
Properties in Abbott have an average house price of £202,820.00 and had 94 Property Transactions within the last 3 years¹.
Abbott is an area in Mansfield, Nottinghamshire with 1,202 households², where the most expensive property was sold for £370,000.00.
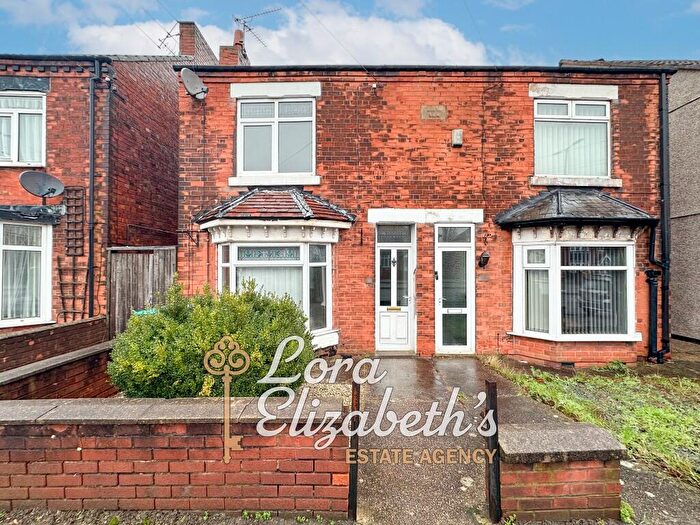
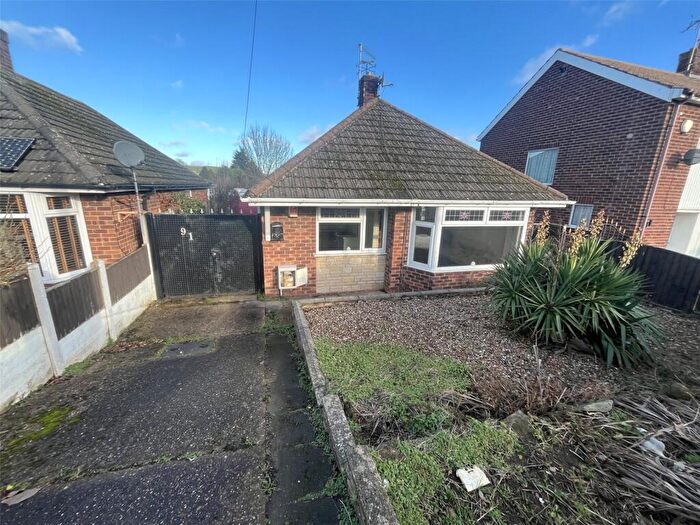
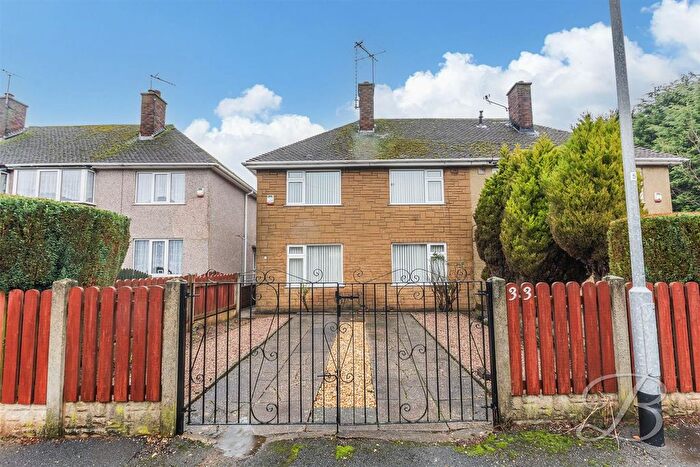
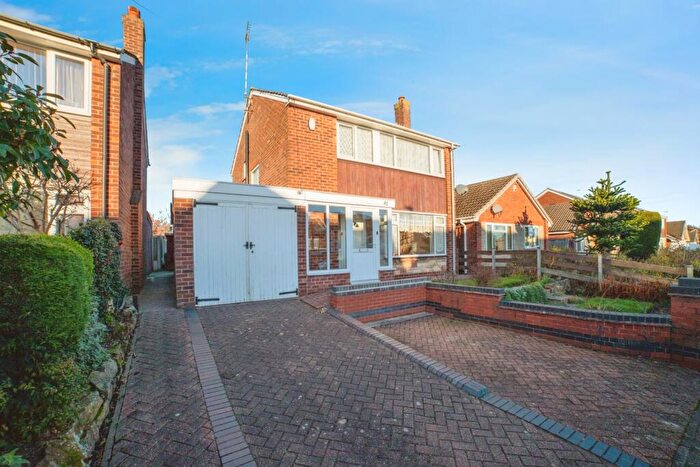
Properties for sale in Abbott
Roads and Postcodes in Abbott
Navigate through our locations to find the location of your next house in Abbott, Mansfield for sale or to rent.
| Streets | Postcodes |
|---|---|
| Abbott Road | NG19 6DD NG19 6DE NG19 6DF NG19 6DG NG19 6DQ |
| Abbotts Croft | NG19 6NY NG19 6NZ |
| Beckett Avenue | NG19 6BX |
| Blyth Court | NG19 6NU |
| Blythe Close | NG19 6NP |
| Broomhill Lane | NG19 6BN NG19 6BW |
| Buxton Road | NG19 6DA |
| Cheriton Close | NG19 6ED |
| Chester Street | NG19 6DW NG19 6NJ |
| Chesterfield Road North | NG19 7JA NG19 7QZ |
| Chesterfield Road South | NG19 7ES NG19 7EL |
| Cobden Place | NG19 7NF |
| Collingham Road | NG19 6NR |
| Colwick Close | NG19 6NW |
| Dalestorth Avenue | NG19 6NT |
| Drayton Avenue | NG19 6NS |
| Elston Close | NG19 6PA |
| Everton Street | NG19 6EB |
| Fairholme Drive | NG19 6DJ NG19 6DN NG19 6DR NG19 6DS NG19 6DU NG19 6DX |
| Farmilo Crescent | NG19 7NE |
| Heron Way | NG19 6EQ |
| Kingfisher Road | NG19 6EG |
| Langley Close | NG19 6DL |
| Marlborough Road | NG19 6DY |
| Morton Street | NG19 6DP |
| Newport Crescent | NG19 6BY |
| Nightingale Drive | NG19 7NG |
| Old Water Lane | NG19 6DZ |
| Otter Way | NG19 6DH |
| Oundle Drive | NG19 6BZ |
| Saundby Avenue | NG19 6NX |
| Shaftsbury Avenue | NG19 7ND |
| Shelton Close | NG19 6DB |
| Thorn Avenue | NG19 7ET |
| Upton Mount | NG19 6NL |
| Vicarage Court | NG19 6LQ |
| Westfield Drive | NG19 6EU |
| Westfield Lane | NG19 6HG NG19 6NQ NG19 6NH |
| Woodborough Road | NG19 6DT NG19 6NN |
| Wysall Close | NG19 6EA |
Transport near Abbott
-
Mansfield Woodhouse Station
-
Mansfield Town Station
-
Sutton Parkway Station
-
Shirebrook (Derbys) Station
-
Kirkby in Ashfield Station
- FAQ
- Price Paid By Year
- Property Type Price
Frequently asked questions about Abbott
What is the average price for a property for sale in Abbott?
The average price for a property for sale in Abbott is £202,820. This amount is 4% higher than the average price in Mansfield. There are 850 property listings for sale in Abbott.
What streets have the most expensive properties for sale in Abbott?
The streets with the most expensive properties for sale in Abbott are Heron Way at an average of £312,000, Chesterfield Road South at an average of £302,500 and Otter Way at an average of £300,000.
What streets have the most affordable properties for sale in Abbott?
The streets with the most affordable properties for sale in Abbott are Cobden Place at an average of £142,500, Fairholme Drive at an average of £158,733 and Langley Close at an average of £167,000.
Which train stations are available in or near Abbott?
Some of the train stations available in or near Abbott are Mansfield Woodhouse, Mansfield Town and Sutton Parkway.
Property Price Paid in Abbott by Year
The average sold property price by year was:
| Year | Average Sold Price | Price Change |
Sold Properties
|
|---|---|---|---|
| 2025 | £206,896 | -3% |
29 Properties |
| 2024 | £212,484 | 14% |
39 Properties |
| 2023 | £183,778 | 0,3% |
26 Properties |
| 2022 | £183,150 | 0,2% |
30 Properties |
| 2021 | £182,733 | 14% |
61 Properties |
| 2020 | £156,973 | 2% |
30 Properties |
| 2019 | £153,578 | -1% |
47 Properties |
| 2018 | £155,316 | 7% |
36 Properties |
| 2017 | £144,939 | 1% |
34 Properties |
| 2016 | £143,967 | 16% |
50 Properties |
| 2015 | £120,983 | -6% |
39 Properties |
| 2014 | £127,886 | 10% |
38 Properties |
| 2013 | £114,807 | 0,2% |
38 Properties |
| 2012 | £114,583 | 4% |
18 Properties |
| 2011 | £109,527 | -10% |
35 Properties |
| 2010 | £120,524 | 6% |
27 Properties |
| 2009 | £113,526 | 8% |
19 Properties |
| 2008 | £104,983 | -28% |
30 Properties |
| 2007 | £134,647 | -2% |
50 Properties |
| 2006 | £136,896 | 9% |
44 Properties |
| 2005 | £124,965 | -16% |
50 Properties |
| 2004 | £144,675 | 23% |
71 Properties |
| 2003 | £111,798 | 28% |
65 Properties |
| 2002 | £80,701 | 29% |
82 Properties |
| 2001 | £56,899 | 15% |
69 Properties |
| 2000 | £48,539 | 5% |
33 Properties |
| 1999 | £46,192 | 4% |
38 Properties |
| 1998 | £44,146 | 1% |
30 Properties |
| 1997 | £43,610 | 9% |
24 Properties |
| 1996 | £39,887 | 3% |
36 Properties |
| 1995 | £38,630 | - |
26 Properties |
Property Price per Property Type in Abbott
Here you can find historic sold price data in order to help with your property search.
The average Property Paid Price for specific property types in the last three years are:
| Property Type | Average Sold Price | Sold Properties |
|---|---|---|
| Semi Detached House | £188,762.00 | 40 Semi Detached Houses |
| Detached House | £230,617.00 | 46 Detached Houses |
| Terraced House | £122,571.00 | 7 Terraced Houses |
| Flat | £48,250.00 | 1 Flat |

