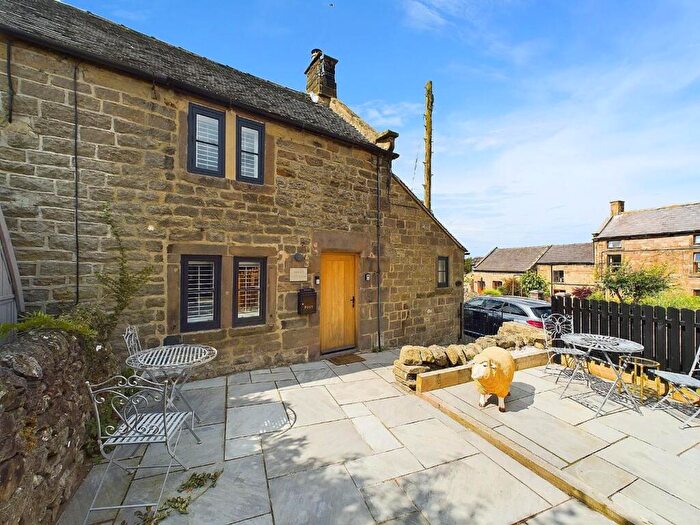
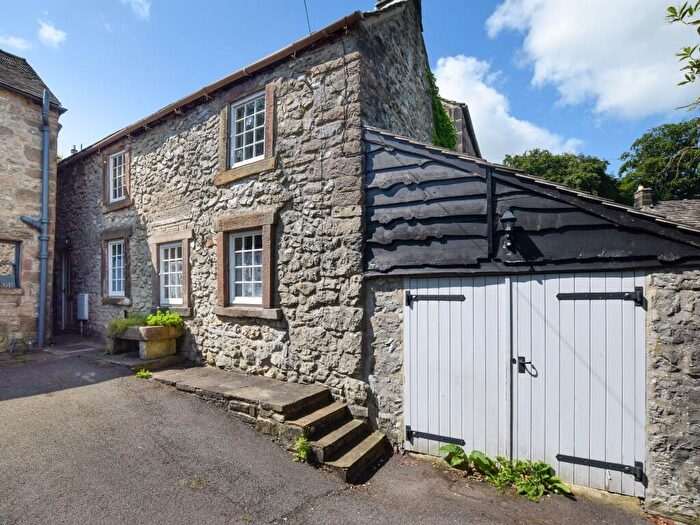
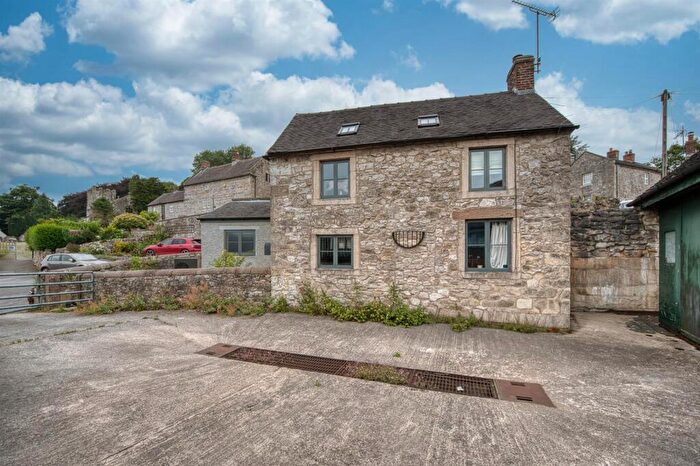
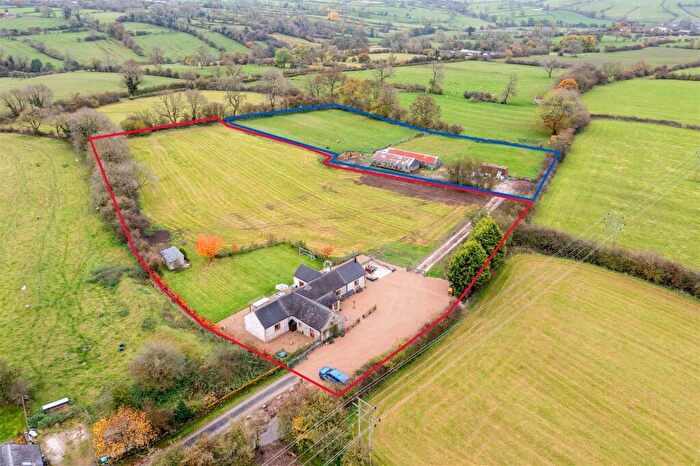
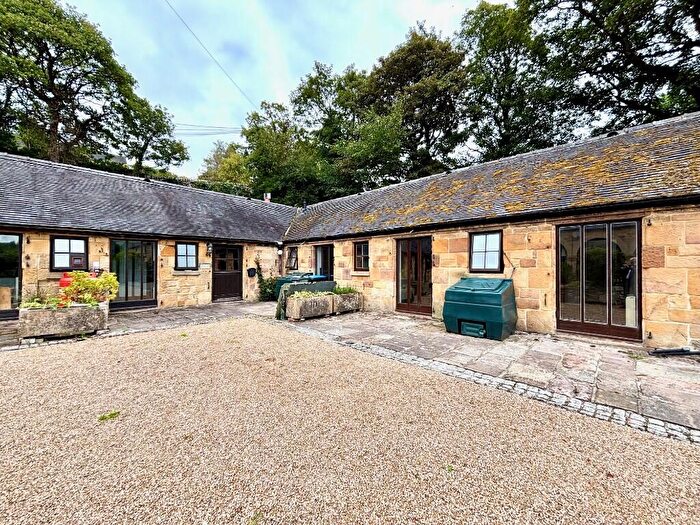
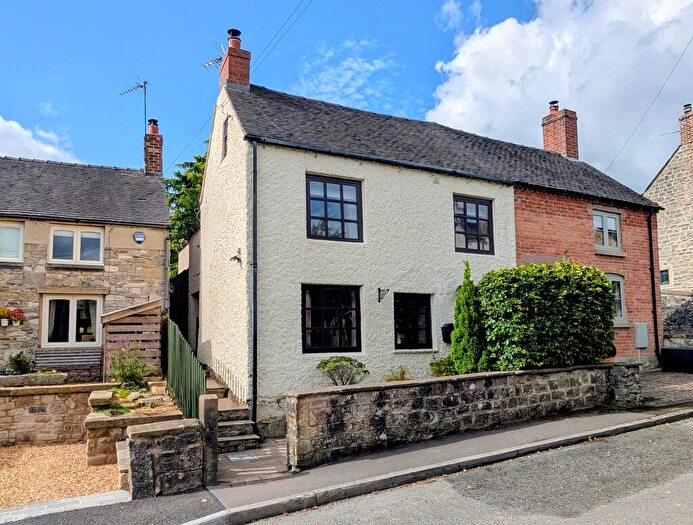
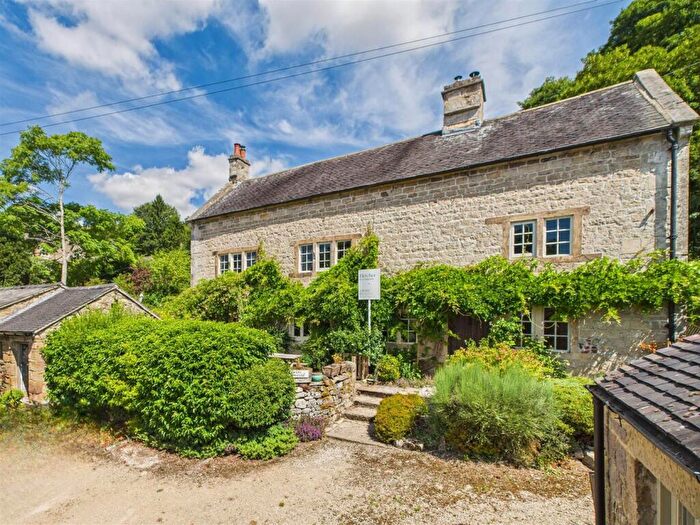
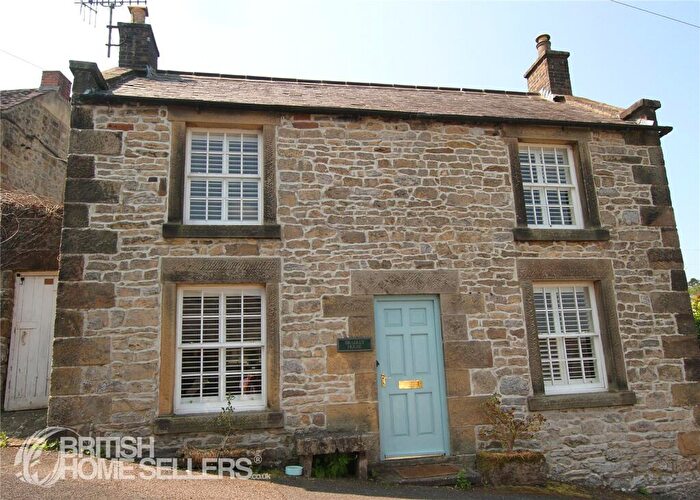
Houses for sale & to rent in Carsington Water, Matlock
House Prices in Carsington Water
Properties in Carsington Water have an average house price of £503,692.00 and had 26 Property Transactions within the last 3 years¹.
Carsington Water is an area in Matlock, Derbyshire with 413 households², where the most expensive property was sold for £1,500,000.00.
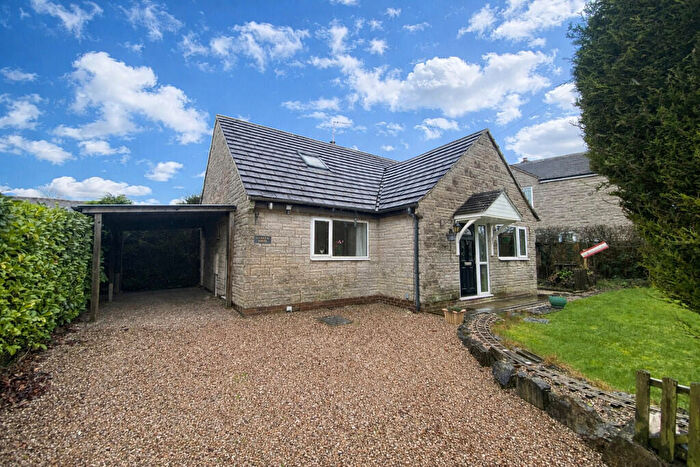
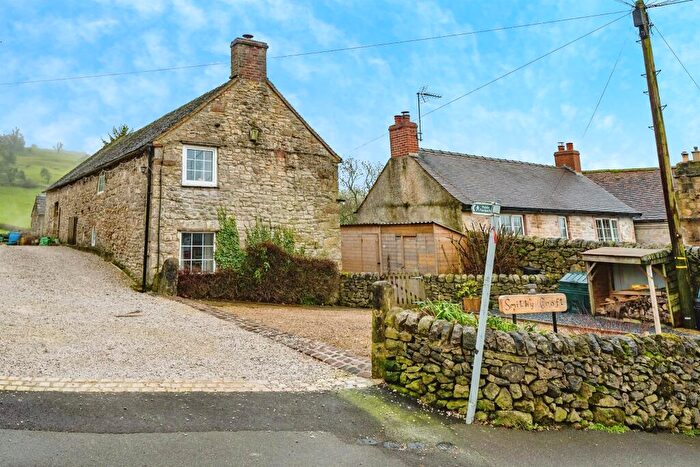
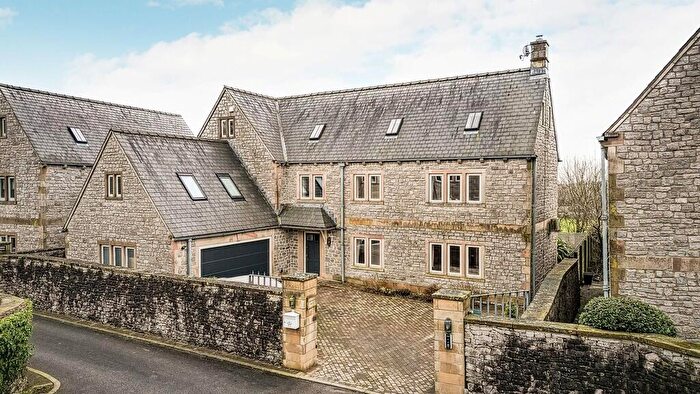
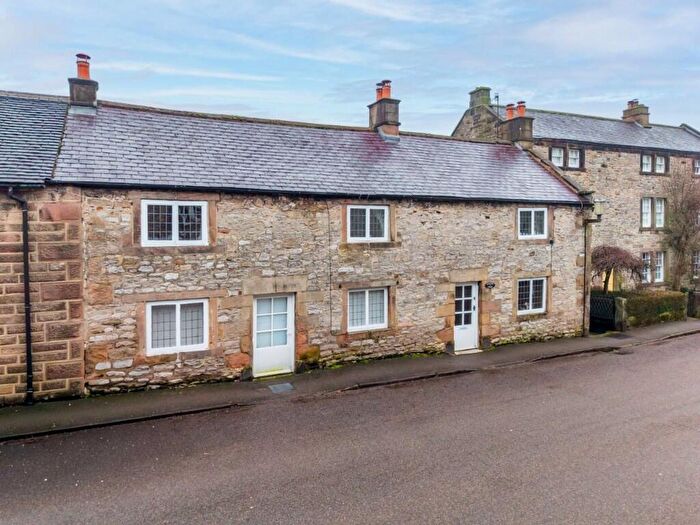
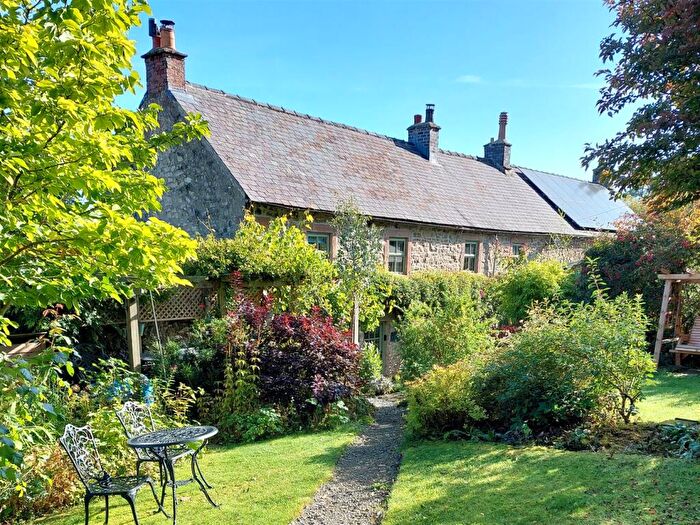
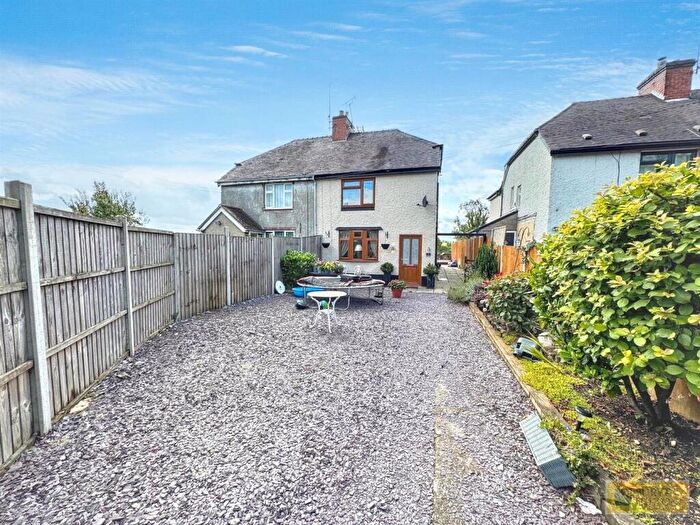
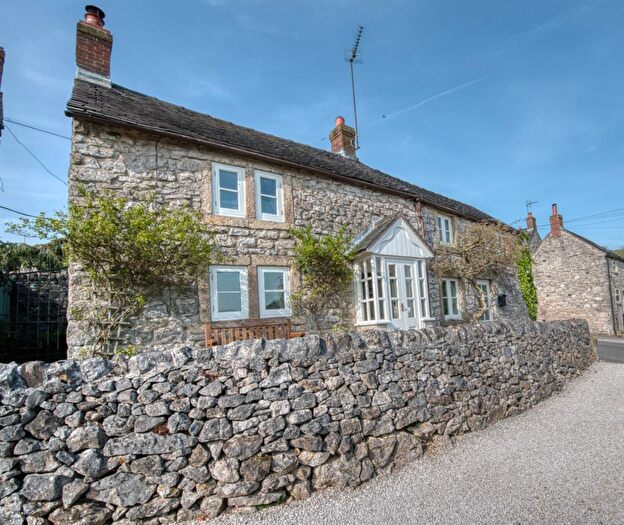
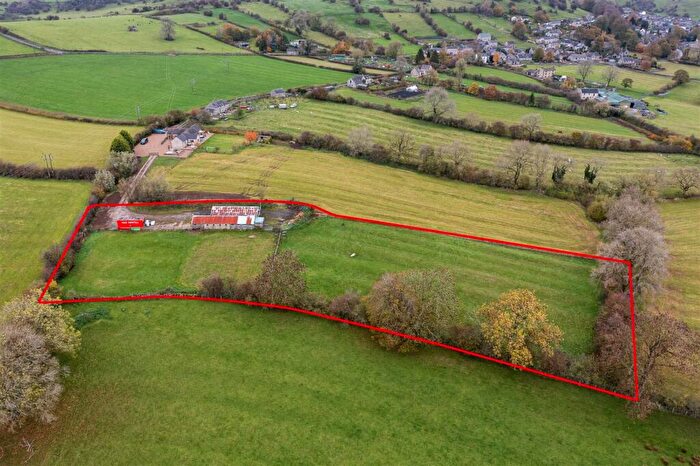
Properties for sale in Carsington Water
Roads and Postcodes in Carsington Water
Navigate through our locations to find the location of your next house in Carsington Water, Matlock for sale or to rent.
| Streets | Postcodes |
|---|---|
| Aldwark | DE4 4HW DE4 4HX |
| Ashbourne Road | DE4 4DD |
| Back Lane | DE4 4PY |
| Ballidon Moor | DE4 4HP |
| Bowling Green | DE4 4PW |
| Bradbourne Lane | DE4 4PH |
| Church Street | DE4 4HJ |
| Dale End | DE4 4HA |
| Field End | DE4 4HG |
| Grange Mill | DE4 4BW DE4 4HU DE4 4HY |
| Greenway | DE4 4HD |
| Hillside | DE4 4HL |
| Hopton | DE4 4DF |
| Ible | DE4 4HS DE4 4HT |
| Jaspers Lane | DE4 4NT |
| Kings Close | DE4 4BY |
| Longcliffe | DE4 4HN DE4 4BX DE4 4BZ |
| Main Street | DE4 4DE |
| Manor Close | DE4 4HZ |
| Manystones Lane | DE4 4HF DE4 4ES DE4 4NY |
| Meadow Rise | DE4 4HQ DE4 4JB |
| Miners Arms Cottages | DE4 4JN |
| Mining Lane | DE4 4PL |
| Moor Lane | DE4 2PF |
| Parwich Lane | DE4 2PJ |
| Pasture Lane | DE4 4QA |
| Shiningford Lane | DE4 4PS |
| Stainsbro Lane | DE4 4PU |
| The Dene | DE4 4PT |
| The Town | DE4 4PX |
| Town Street | DE4 4HB |
| Wash Hills Close | DE4 4HR |
| DE4 2PG DE4 2PQ DE4 4DA DE4 4DB DE4 2PR |
Transport near Carsington Water
- FAQ
- Price Paid By Year
- Property Type Price
Frequently asked questions about Carsington Water
What is the average price for a property for sale in Carsington Water?
The average price for a property for sale in Carsington Water is £503,692. This amount is 55% higher than the average price in Matlock. There are 214 property listings for sale in Carsington Water.
What streets have the most expensive properties for sale in Carsington Water?
The streets with the most expensive properties for sale in Carsington Water are The Town at an average of £800,000, Main Street at an average of £780,000 and Wash Hills Close at an average of £635,000.
What streets have the most affordable properties for sale in Carsington Water?
The streets with the most affordable properties for sale in Carsington Water are Manor Close at an average of £183,000, Field End at an average of £298,000 and Dale End at an average of £335,666.
Which train stations are available in or near Carsington Water?
Some of the train stations available in or near Carsington Water are Matlock Bath, Cromford and Matlock.
Property Price Paid in Carsington Water by Year
The average sold property price by year was:
| Year | Average Sold Price | Price Change |
Sold Properties
|
|---|---|---|---|
| 2025 | £392,200 | -64% |
5 Properties |
| 2024 | £642,444 | 31% |
9 Properties |
| 2023 | £446,083 | -14% |
12 Properties |
| 2022 | £509,916 | 19% |
9 Properties |
| 2021 | £414,017 | -12% |
28 Properties |
| 2020 | £463,437 | -4% |
16 Properties |
| 2019 | £482,060 | 26% |
19 Properties |
| 2018 | £358,964 | 9% |
14 Properties |
| 2017 | £327,353 | -0,4% |
14 Properties |
| 2016 | £328,730 | -8% |
13 Properties |
| 2015 | £354,142 | 32% |
7 Properties |
| 2014 | £241,407 | -64% |
14 Properties |
| 2013 | £395,750 | 37% |
8 Properties |
| 2012 | £247,500 | -42% |
6 Properties |
| 2011 | £351,545 | 5% |
11 Properties |
| 2010 | £332,291 | 43% |
12 Properties |
| 2009 | £188,428 | -72% |
7 Properties |
| 2008 | £323,687 | -26% |
8 Properties |
| 2007 | £409,429 | 22% |
18 Properties |
| 2006 | £319,600 | 20% |
15 Properties |
| 2005 | £254,806 | -28% |
16 Properties |
| 2004 | £325,009 | 29% |
11 Properties |
| 2003 | £231,231 | 9% |
19 Properties |
| 2002 | £210,302 | 18% |
23 Properties |
| 2001 | £172,660 | -39% |
20 Properties |
| 2000 | £239,827 | 54% |
13 Properties |
| 1999 | £110,837 | 13% |
16 Properties |
| 1998 | £96,697 | -22% |
20 Properties |
| 1997 | £117,772 | 26% |
11 Properties |
| 1996 | £87,646 | 5% |
16 Properties |
| 1995 | £82,933 | - |
15 Properties |
Property Price per Property Type in Carsington Water
Here you can find historic sold price data in order to help with your property search.
The average Property Paid Price for specific property types in the last three years are:
| Property Type | Average Sold Price | Sold Properties |
|---|---|---|
| Semi Detached House | £342,500.00 | 6 Semi Detached Houses |
| Detached House | £618,750.00 | 16 Detached Houses |
| Terraced House | £285,250.00 | 4 Terraced Houses |

