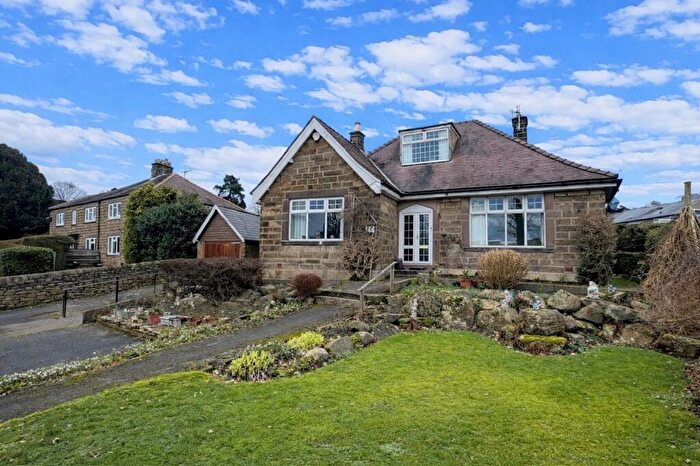
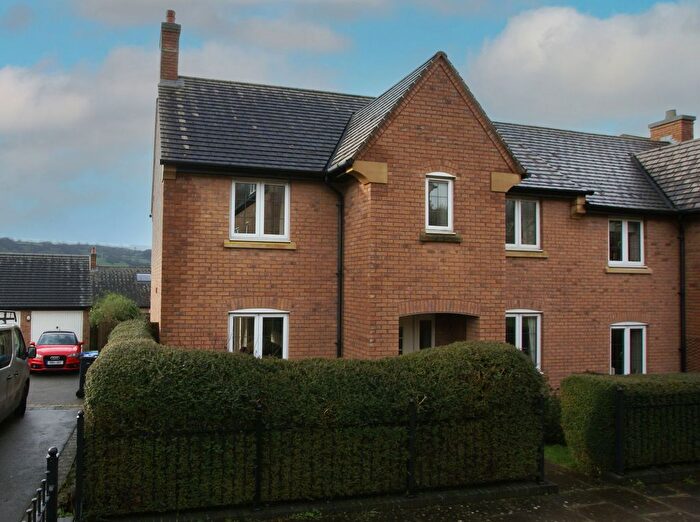
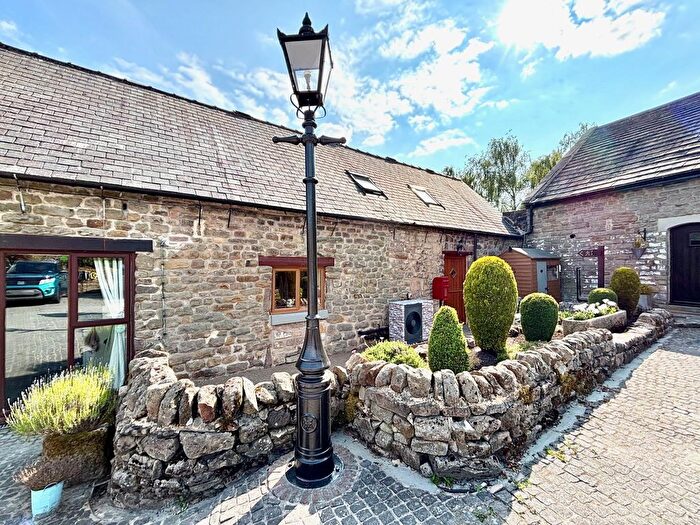
Houses for sale & to rent in Masson, Matlock
House Prices in Masson
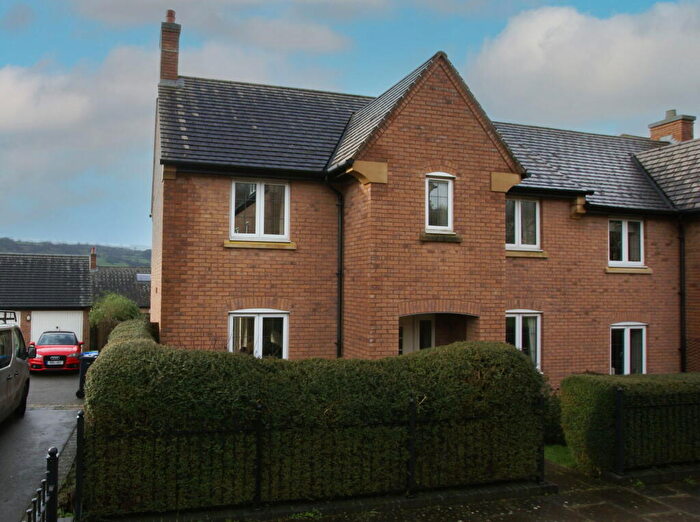
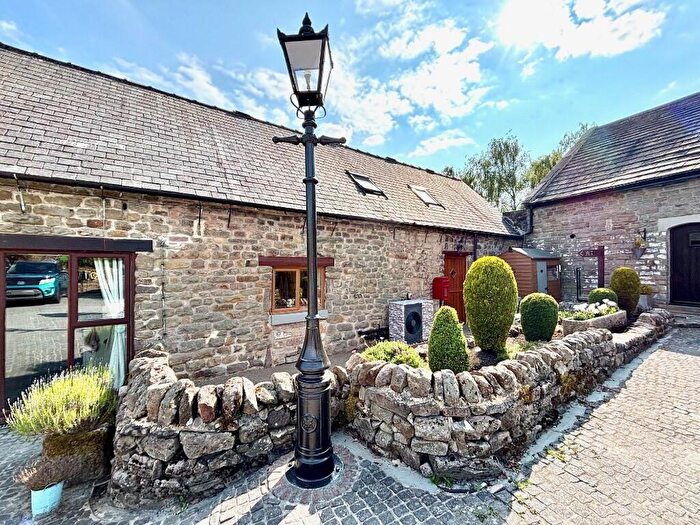
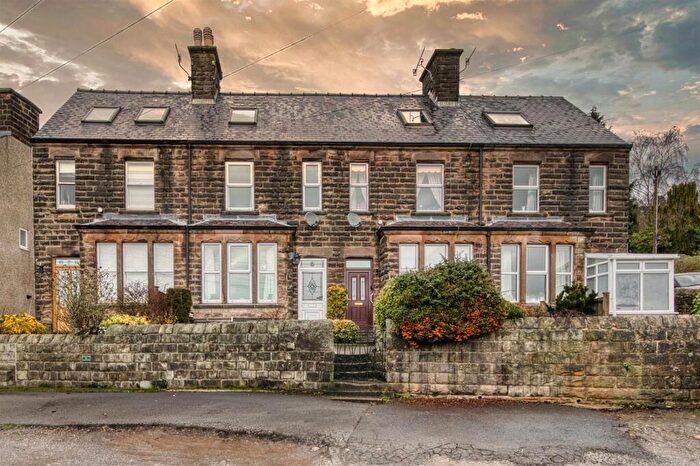
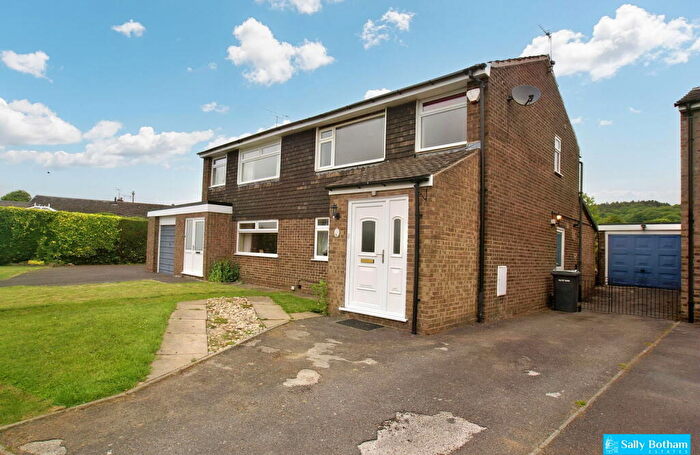
Properties in Masson have an average house price of £283,312.00 and had 110 Property Transactions within the last 3 years¹.
Masson is an area in Matlock, Derbyshire with 1,376 households², where the most expensive property was sold for £700,000.00.
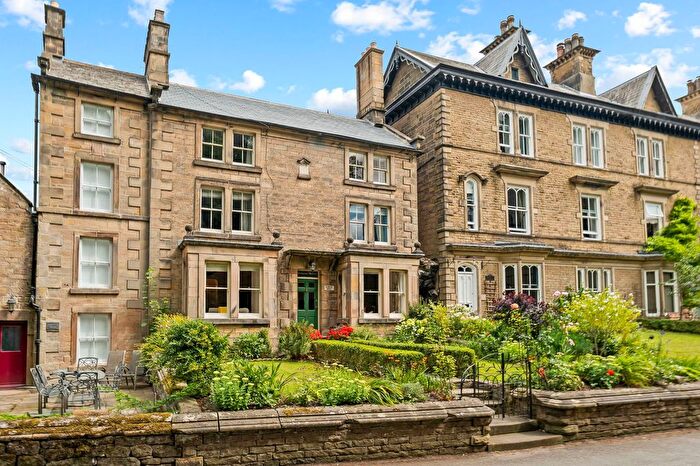
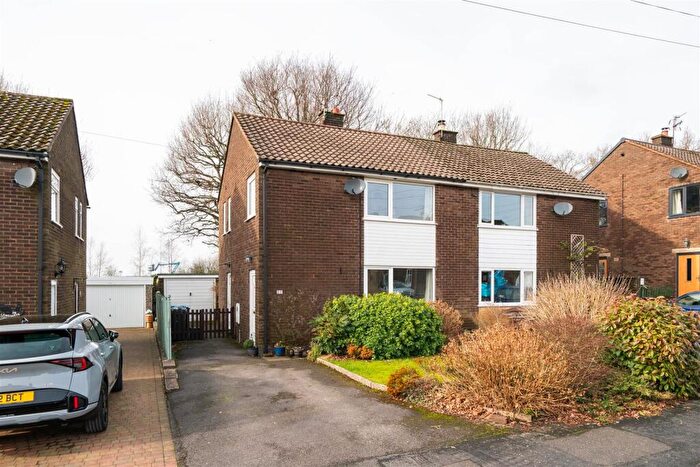
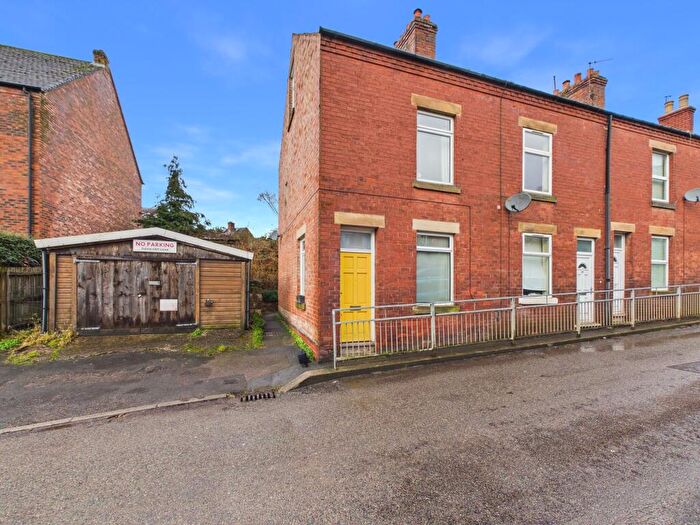
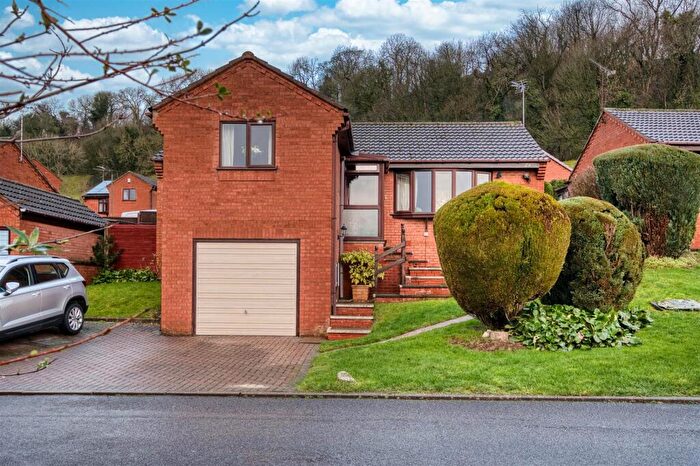
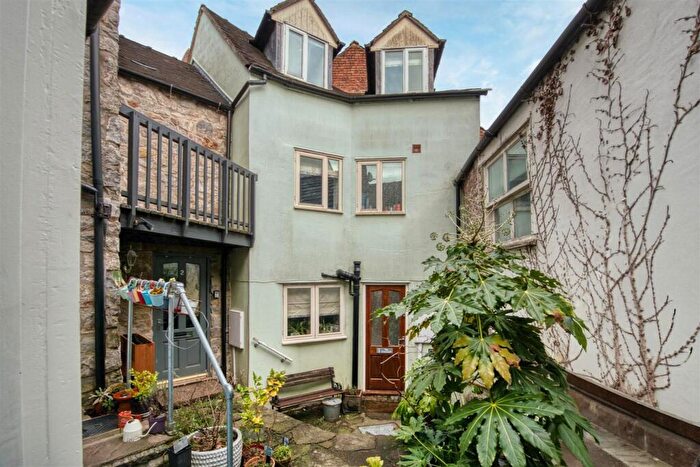
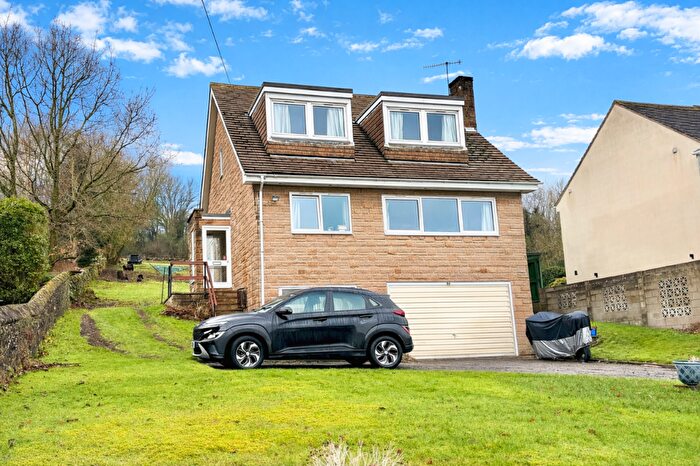
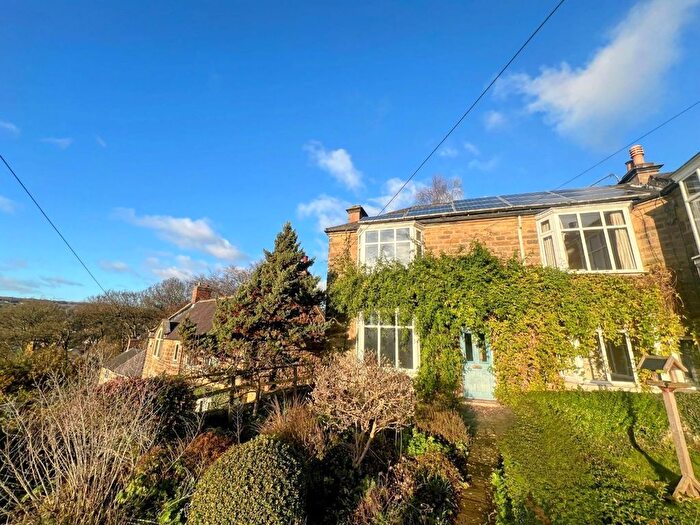
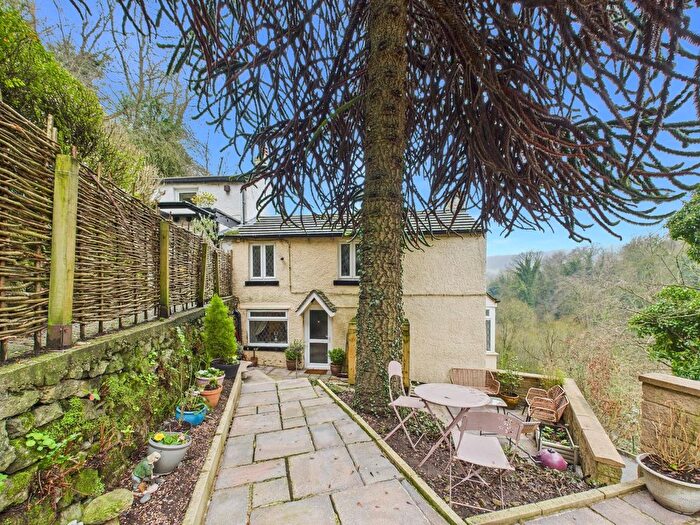
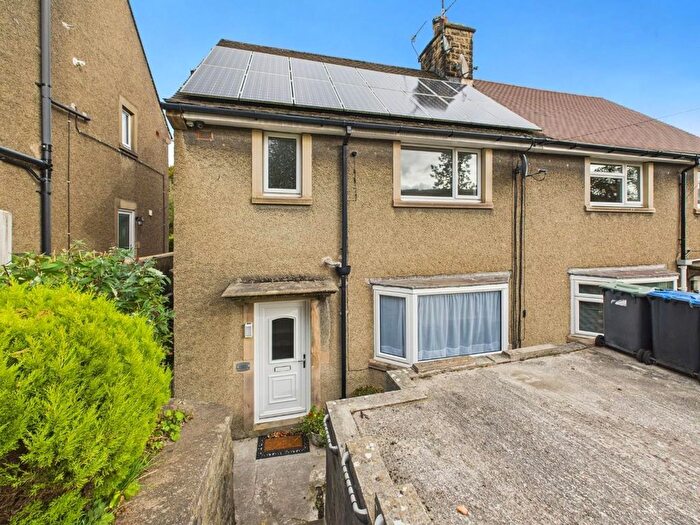
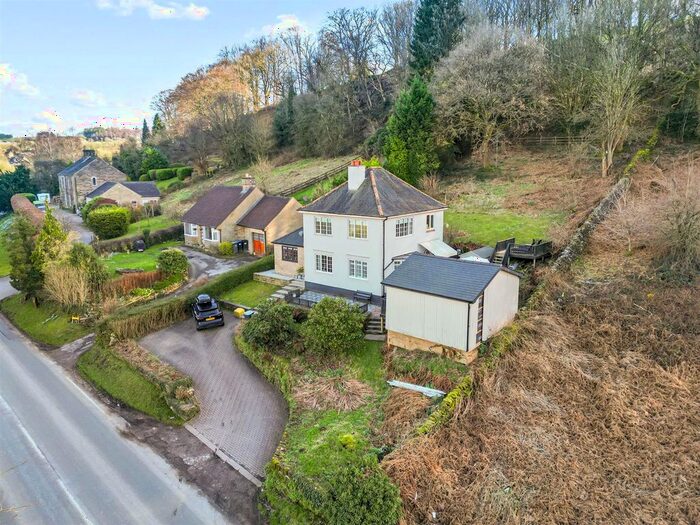
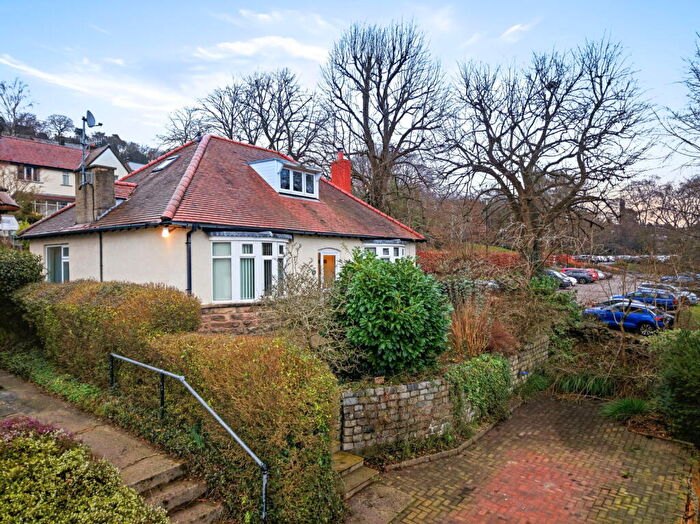
Properties for sale in Masson
Roads and Postcodes in Masson
Navigate through our locations to find the location of your next house in Masson, Matlock for sale or to rent.
| Streets | Postcodes |
|---|---|
| Addison Square | DE4 3QT |
| Alabaster Lane | DE4 3QJ |
| Arkwright Gardens | DE4 3QQ |
| Arter Hill | DE4 2AZ |
| Bankside | DE4 2AX |
| Barnwell Lane | DE4 3QY |
| Bedehouse Lane | DE4 3QZ |
| Beech Walk | DE4 3RB |
| Bell Lane | DE4 2AU |
| Black Tor Road | DE4 2AG |
| Bonsall Lane | DE4 2PD |
| Bow Wood | DE4 5AB |
| Brightgate | DE4 2PB |
| Castle View Drive | DE4 3RL |
| Chapel Hill | DE4 3QG |
| Chestnut Court | DE4 3RS |
| Church Street | DE4 2AE |
| Clarence Terrace | DE4 3NY |
| Clifton Road | DE4 3PW |
| Coach House Mews | DE4 3AL |
| Cromford Bridge | DE4 5JJ |
| Dale Road | DE4 3NT DE4 3PP DE4 3PS DE4 3RT |
| Derby Road | DE4 3PU DE4 3PY DE4 3RN DE4 3RP |
| Devonshire Terrace | DE4 3PA |
| Ember Lane | DE4 2AF |
| Hawthorn Drive | DE4 3QN |
| High Peak Junction | DE4 5HN |
| High Street | DE4 2AR DE4 2AS |
| Holme Road | DE4 3NU |
| Hope Terrace | DE4 3NZ |
| Intake Lane | DE4 3RH |
| Lea Mills | DE4 5AG |
| Leys Lane | DE4 4JH |
| Market Place | DE4 3QE DE4 3RE |
| Masson Road | DE4 3PB |
| Mill Road | DE4 3RQ |
| Moorside | DE4 3QW |
| Moorside Close | DE4 3QX |
| Nether Green | DE4 2AH |
| New Bath Road | DE4 3PX |
| North Parade | DE4 3NS |
| North Street | DE4 3RG |
| Orchard Road | DE4 3PF |
| Porter Lane | DE4 4NQ |
| Pounder Lane | DE4 2AP |
| Puddle Hill | DE4 2BA |
| Ridgewood Drive | DE4 3RJ |
| Rock View Cottages | DE4 3PG |
| Rockvale Terrace | DE4 3NW |
| Rockvale Villas | DE4 3NX |
| Rose End Avenue | DE4 3QP |
| Scarthin | DE4 3QF |
| Slaley | DE4 2BB |
| South Parade | DE4 3NR |
| St Johns Road | DE4 3PQ DE4 3PR |
| St Marks Close | DE4 3QD |
| Study Drive | DE4 2AD |
| The Dale | DE4 2AY |
| The Hill | DE4 3QL DE4 3QR DE4 3QU DE4 3RF |
| Tor View Rise | DE4 3RA |
| Town Head | DE4 2AT |
| Uppertown | DE4 2AW |
| Upperwood | DE4 3PE |
| Upperwood Road | DE4 3PD |
| Via Gellia Road | DE4 2AJ |
| Water Lane | DE4 3QH |
| Waterloo Road | DE4 3PH |
| Willersley Castle Drive | DE4 5JY |
| Willersley Lane | DE4 5JG |
| Yeoman Street | DE4 2AA |
| DE4 5JH |
Transport near Masson
- FAQ
- Price Paid By Year
- Property Type Price
Frequently asked questions about Masson
What is the average price for a property for sale in Masson?
The average price for a property for sale in Masson is £283,312. This amount is 13% lower than the average price in Matlock. There are 1,719 property listings for sale in Masson.
What streets have the most expensive properties for sale in Masson?
The streets with the most expensive properties for sale in Masson are Devonshire Terrace at an average of £700,000, Slaley at an average of £475,000 and Church Street at an average of £451,666.
What streets have the most affordable properties for sale in Masson?
The streets with the most affordable properties for sale in Masson are Beech Walk at an average of £152,000, High Street at an average of £194,000 and High Peak Junction at an average of £195,000.
Which train stations are available in or near Masson?
Some of the train stations available in or near Masson are Matlock Bath, Cromford and Matlock.
Property Price Paid in Masson by Year
The average sold property price by year was:
| Year | Average Sold Price | Price Change |
Sold Properties
|
|---|---|---|---|
| 2025 | £283,749 | 4% |
32 Properties |
| 2024 | £273,585 | -7% |
41 Properties |
| 2023 | £293,712 | -17% |
37 Properties |
| 2022 | £344,785 | 19% |
55 Properties |
| 2021 | £277,792 | 10% |
62 Properties |
| 2020 | £250,205 | -7% |
44 Properties |
| 2019 | £266,641 | 3% |
37 Properties |
| 2018 | £259,321 | 19% |
55 Properties |
| 2017 | £209,083 | -9% |
59 Properties |
| 2016 | £228,757 | 8% |
56 Properties |
| 2015 | £210,862 | -1% |
62 Properties |
| 2014 | £212,754 | 5% |
43 Properties |
| 2013 | £201,848 | 1% |
35 Properties |
| 2012 | £199,323 | -7% |
40 Properties |
| 2011 | £213,779 | 6% |
25 Properties |
| 2010 | £200,401 | 7% |
36 Properties |
| 2009 | £187,005 | -13% |
34 Properties |
| 2008 | £211,336 | -3% |
30 Properties |
| 2007 | £216,845 | 9% |
86 Properties |
| 2006 | £197,460 | 4% |
64 Properties |
| 2005 | £189,606 | 12% |
65 Properties |
| 2004 | £167,784 | 10% |
47 Properties |
| 2003 | £151,458 | 24% |
61 Properties |
| 2002 | £115,370 | -1% |
73 Properties |
| 2001 | £116,529 | 22% |
67 Properties |
| 2000 | £91,004 | 11% |
64 Properties |
| 1999 | £81,376 | 12% |
67 Properties |
| 1998 | £71,469 | -12% |
63 Properties |
| 1997 | £79,799 | 16% |
67 Properties |
| 1996 | £66,641 | 11% |
52 Properties |
| 1995 | £59,578 | - |
45 Properties |
Property Price per Property Type in Masson
Here you can find historic sold price data in order to help with your property search.
The average Property Paid Price for specific property types in the last three years are:
| Property Type | Average Sold Price | Sold Properties |
|---|---|---|
| Semi Detached House | £250,612.00 | 31 Semi Detached Houses |
| Detached House | £380,240.00 | 34 Detached Houses |
| Terraced House | £242,804.00 | 35 Terraced Houses |
| Flat | £196,900.00 | 10 Flats |

