
Houses for sale in Matlock, Derbyshire
House Prices in Matlock
Properties in Matlock have an average house price of £326k and had 1,489 Property Transactions within the last 3 years.¹
Matlock is an area in Derbyshire with 15,747 households², where the most expensive property was sold for £1.75M.
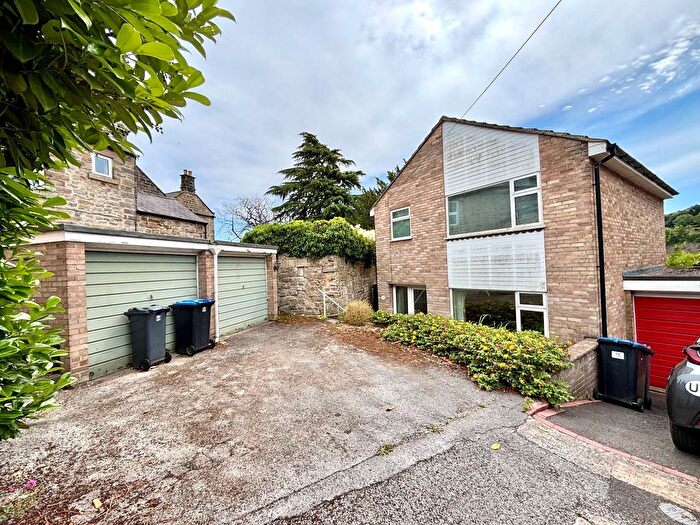
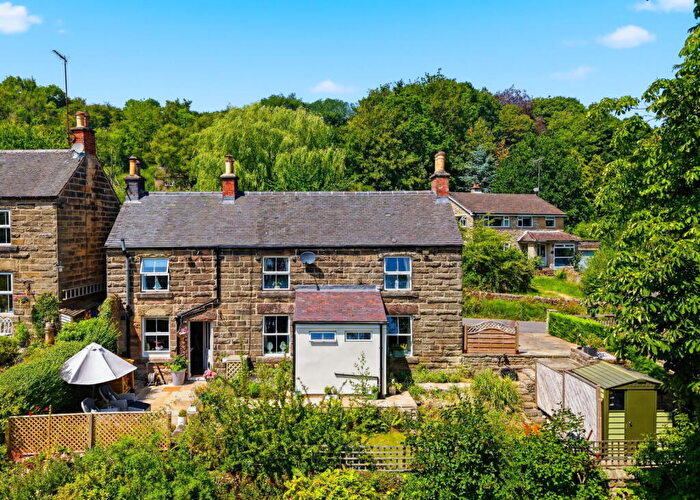
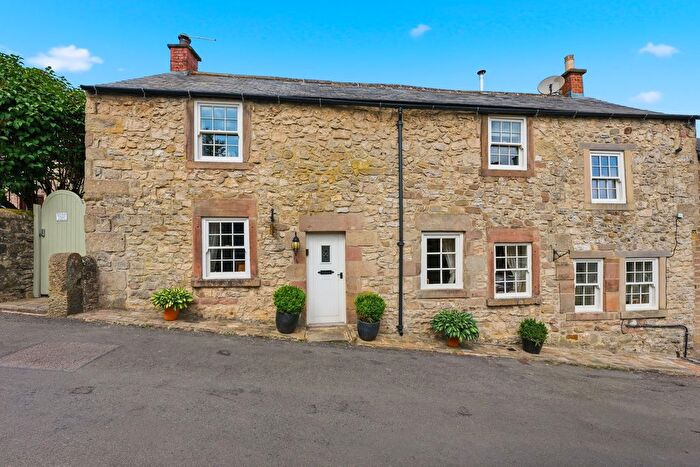
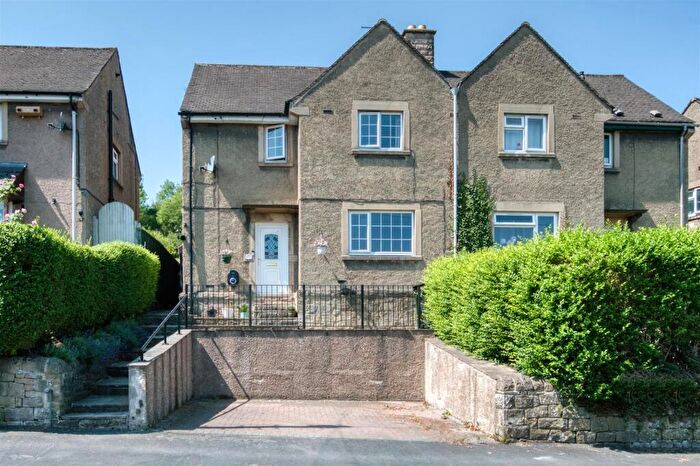
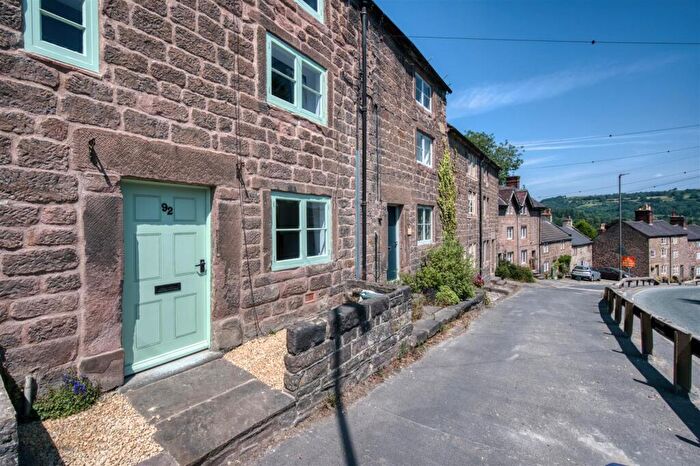
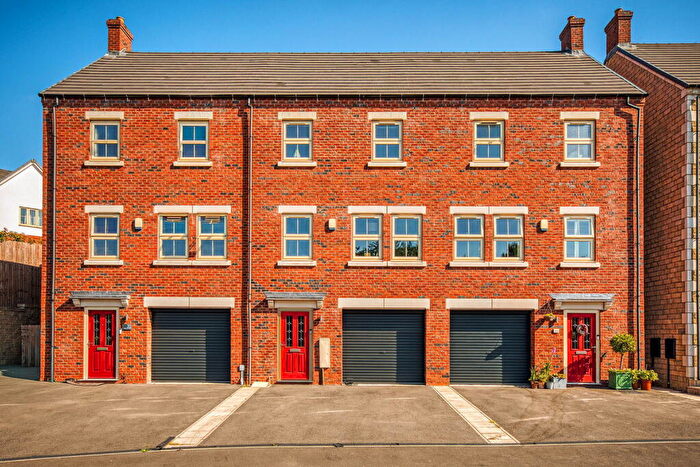
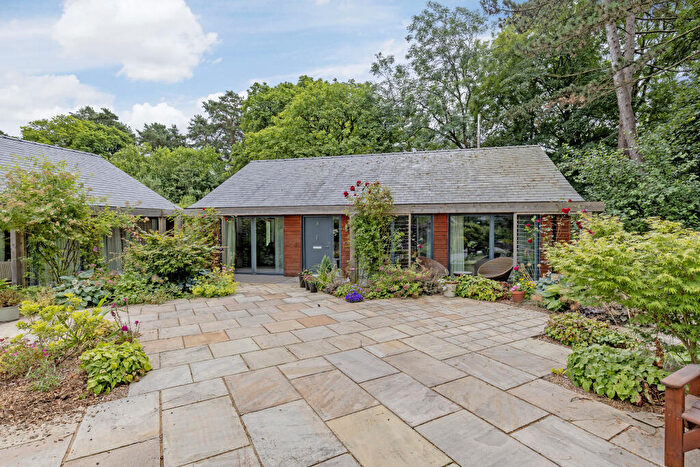
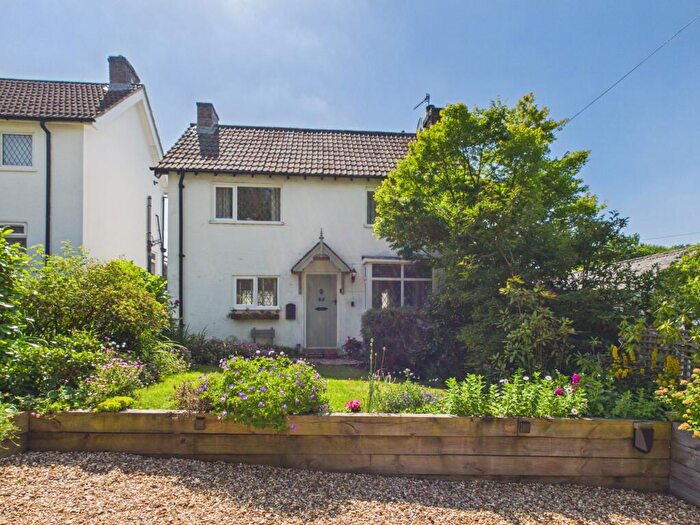
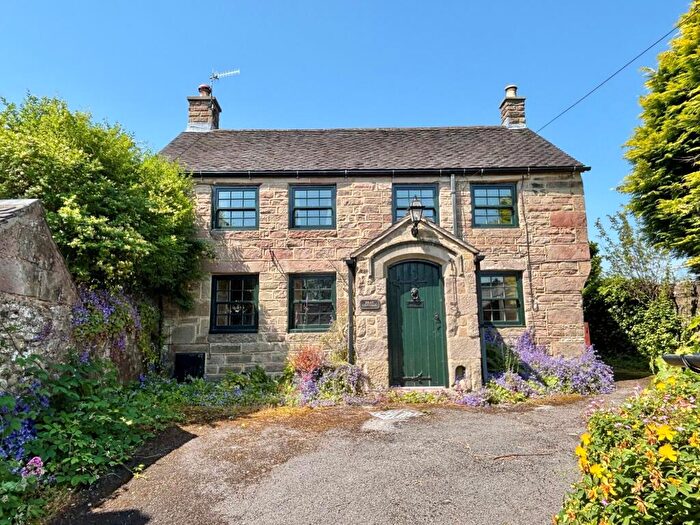
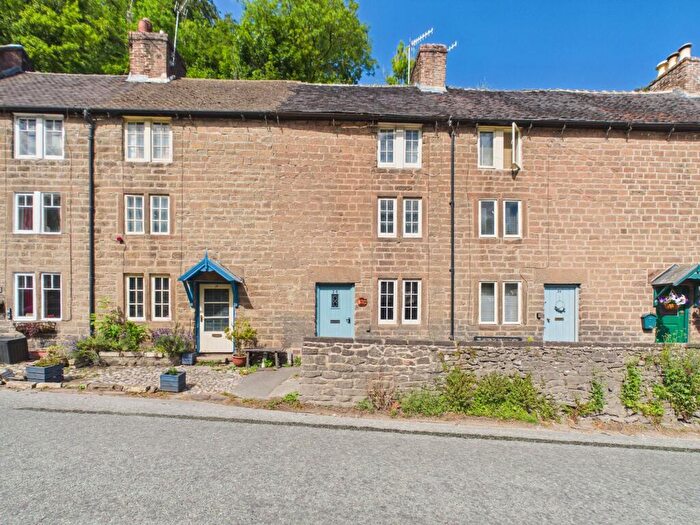
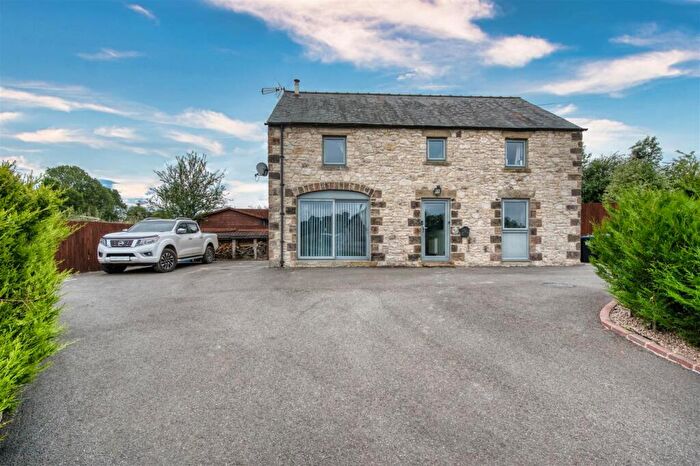
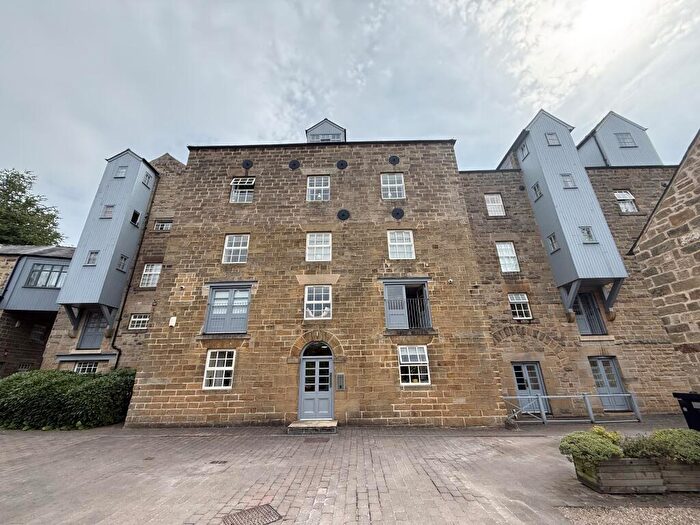
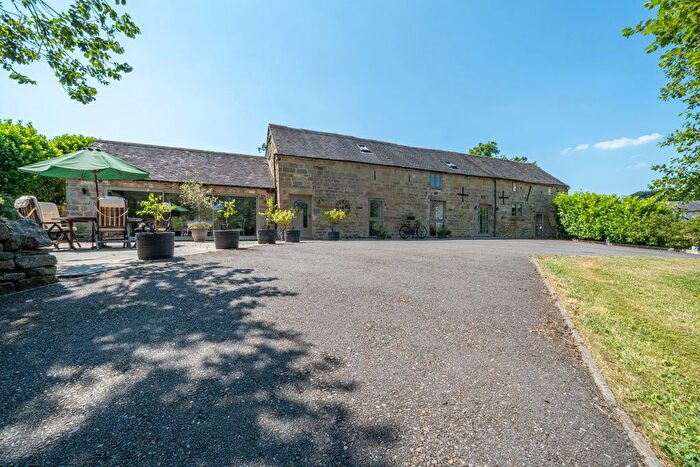
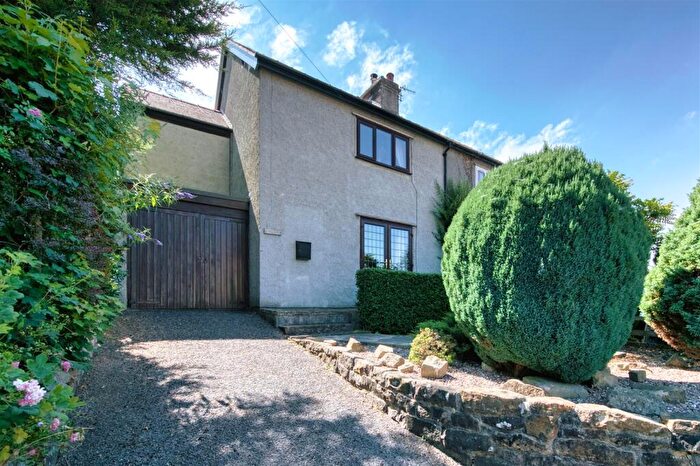
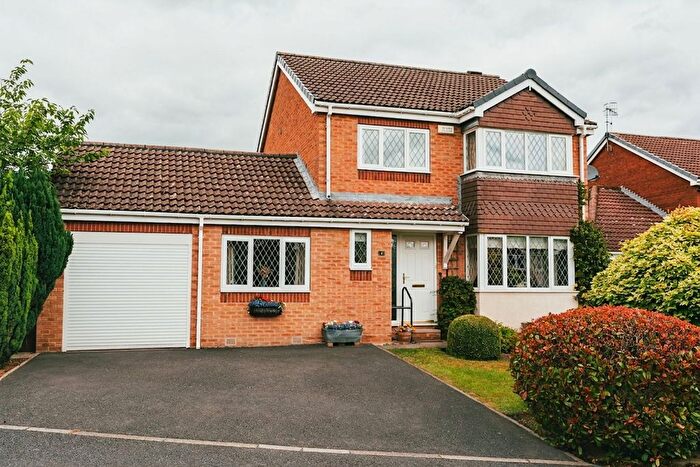
Properties for sale in Matlock

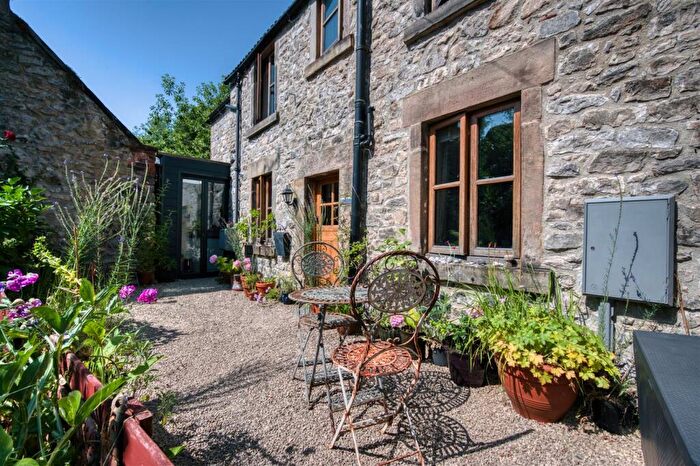

![]()
If you are looking to sell your house, let it out, or receive a property valuation, an expert can help you.
Click the button below to get started.


Neighbourhoods in Matlock
Navigate through our locations to find the location of your next house in Matlock, Derbyshire for sale or to rent.
- Alport
- Ashover
- Carsington Water
- Chatsworth
- Crich
- Darley Dale
- Masson
- Matlock All Saints
- Matlock St Giles
- Stanton
- Winster And South Darley
- Wirksworth
- Alport & South West Parishes
- Crich & South Wingfield
- Bakewell
- Youlgrave
- Bonsall & Winster
- Matlock East & Tansley
- Matlock West
- Dovedale, Parwich & Brassington
Property price trends in Matlock
According to the latest Land Registry data, the average home in Matlock sold for £324,562 in 2026. That figure comes from a substantial record of 17,858 sales logged over the past 31 years.
Prices have moved up over the last three years. Compared with 2023, when the typical sale came in around £318,936, that's a rise of roughly 1.8%.
Looking back five years, average prices are up about 8.3% since 2021, a gain of around £24,764 in cash terms.
Zoom out to the past decade for the fuller picture. Back in 2016, homes here averaged £231,425, so the typical sold price has climbed about 40.2% since then, roughly 3.4% a year. Stretch the view to fifteen years and that annual pace eases back to about 3.1%.
Frequently asked questions about Matlock
What is the average price for a property for sale in Matlock?
The average price for a property for sale in Matlock is £326,312. This amount is 30% higher than the average price in Derbyshire. There are 9,683 property listings for sale in Matlock.
What locations have the most expensive properties for sale in Matlock?
The locations with the most expensive properties for sale in Matlock are Carsington Water at an average of £551,450, Alport at an average of £434,591 and Winster And South Darley at an average of £381,734.
What locations have the most affordable properties for sale in Matlock?
The locations with the most affordable properties for sale in Matlock are Matlock All Saints at an average of £282,419, Masson at an average of £288,485 and Wirksworth at an average of £305,080.
Which train stations are available in or near Matlock?
Some of the train stations available in or near Matlock are Matlock Bath, Matlock and Cromford.
Property Price Paid in Matlock by Year
The average sold property price by year was:
| Year | Average Sold Price | Price Change |
Sold Properties
|
|---|---|---|---|
| 2026 | £324,562 | -0,4% |
43 Properties |
| 2025 | £325,704 | -2% |
485 Properties |
| 2024 | £333,676 | 4% |
506 Properties |
| 2023 | £318,936 | -2% |
455 Properties |
| 2022 | £326,499 | 8% |
532 Properties |
| 2021 | £299,798 | 3% |
704 Properties |
| 2020 | £291,276 | 7% |
548 Properties |
| 2019 | £271,330 | 2% |
611 Properties |
| 2018 | £266,336 | 8% |
667 Properties |
| 2017 | £244,351 | 5% |
623 Properties |
Property Price per Property Type in Matlock
Here you can find historic sold price data in order to help with your property search.
The average Property Paid Price for specific property types in the last three years are:
| Property Type | Average Sold Price | Sold Properties |
|---|---|---|
| Semi Detached House | £274,940.00 | 456 Semi Detached Houses |
| Detached House | £461,264.00 | 535 Detached Houses |
| Terraced House | £229,441.00 | 387 Terraced Houses |
| Flat | £224,647.00 | 111 Flats |
Transport in Matlock
Please see below transportation links in this area:
