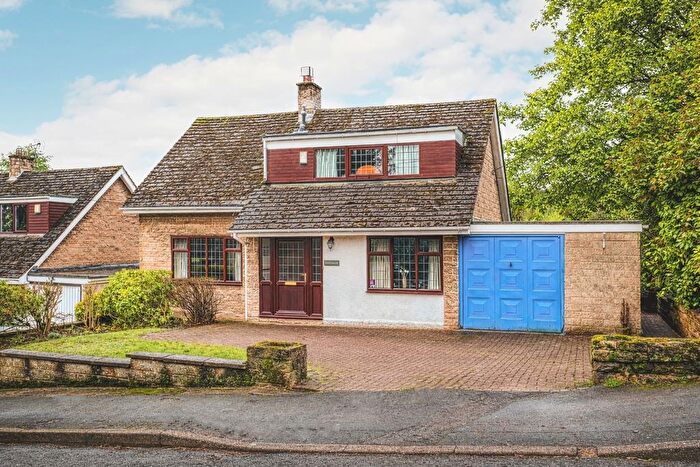
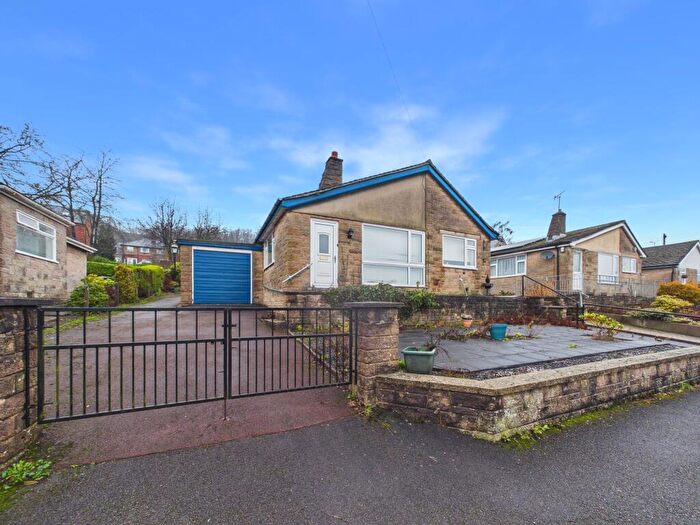
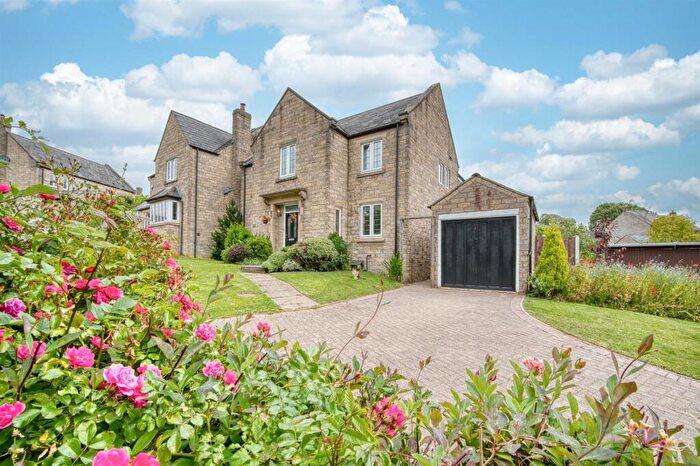
Houses for sale & to rent in Crich, Matlock
House Prices in Crich
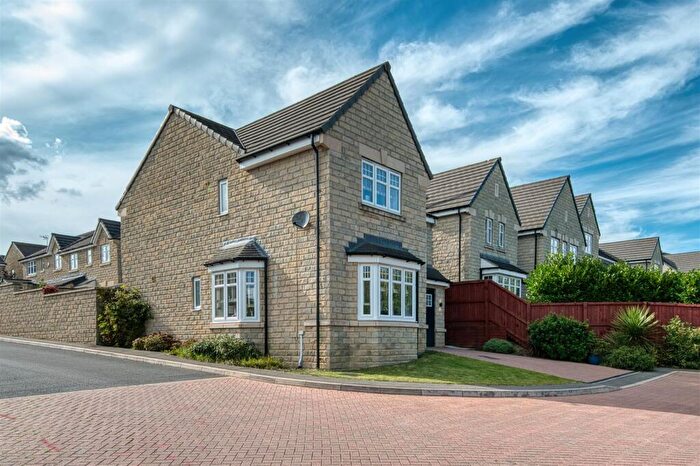
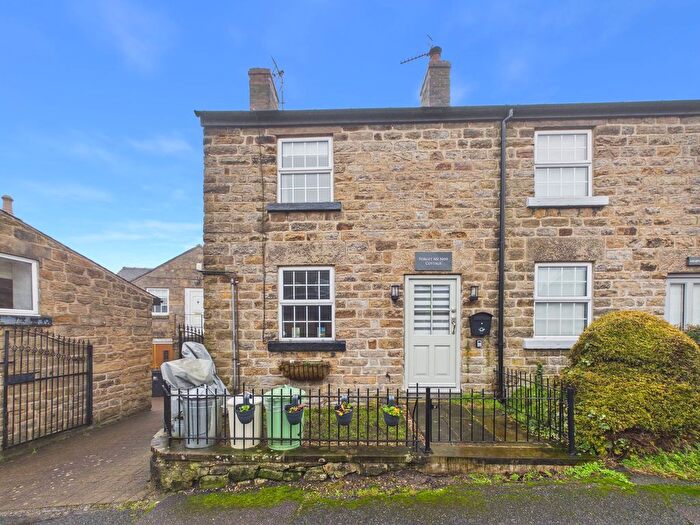
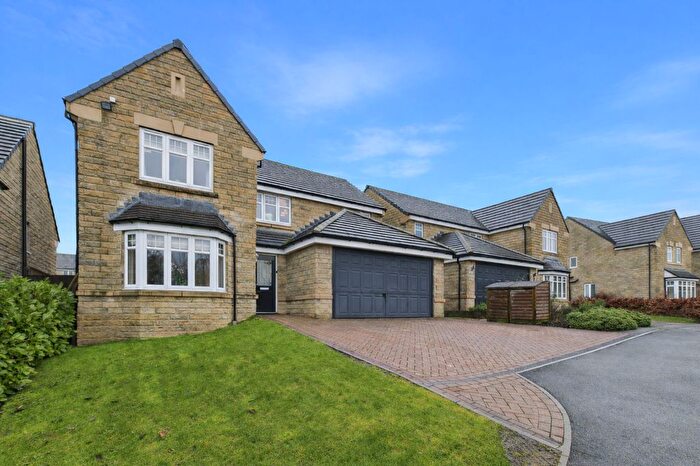
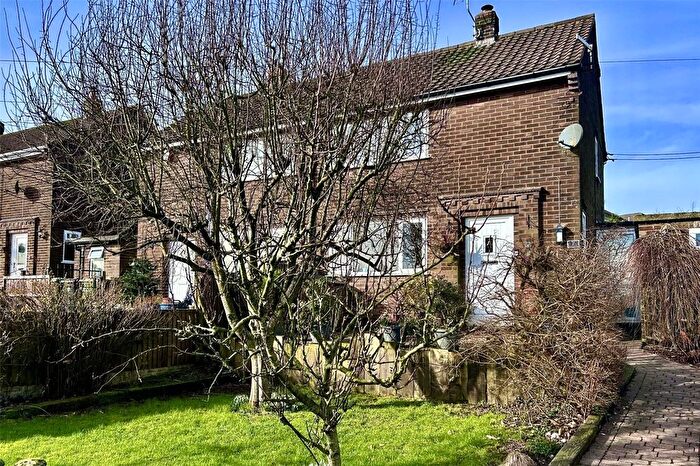
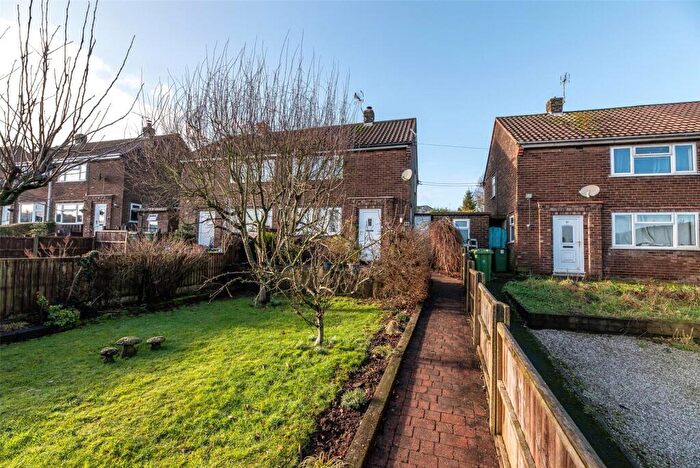
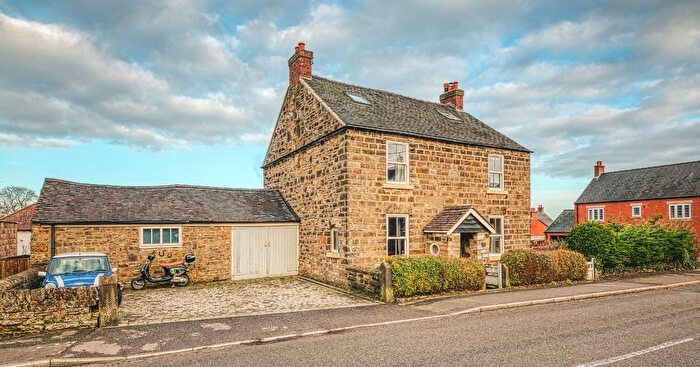
Properties in Crich have an average house price of £366,390.00 and had 101 Property Transactions within the last 3 years¹.
Crich is an area in Matlock, Derbyshire with 1,057 households², where the most expensive property was sold for £1,165,000.00.
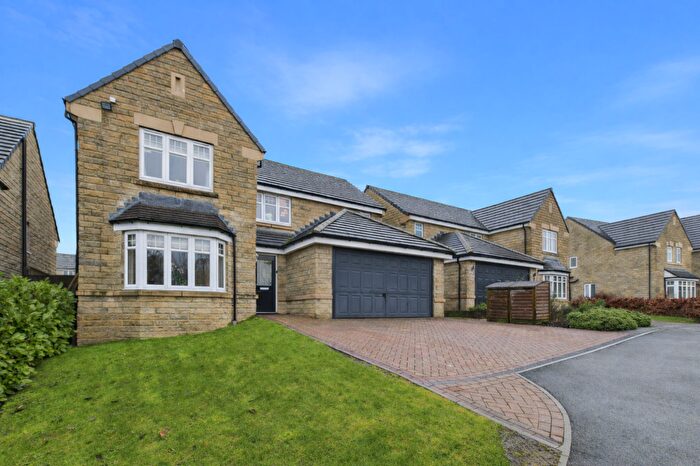
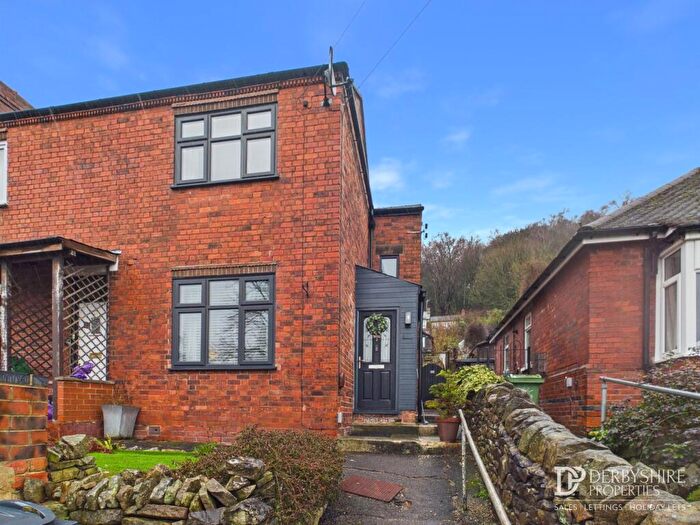
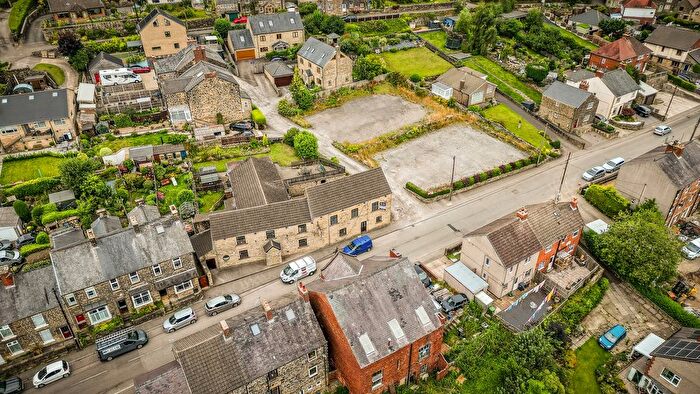
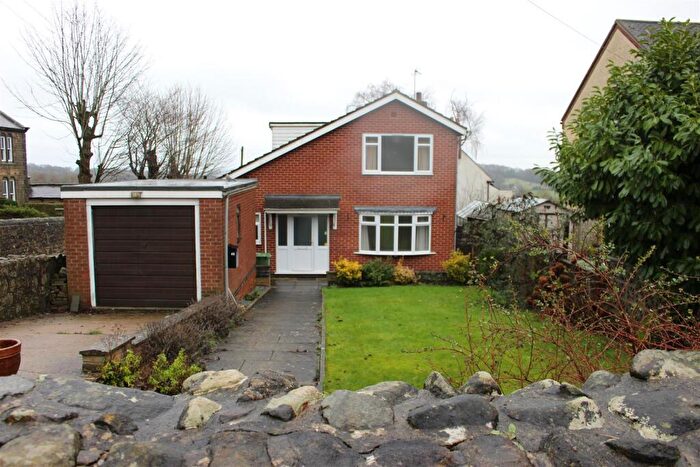
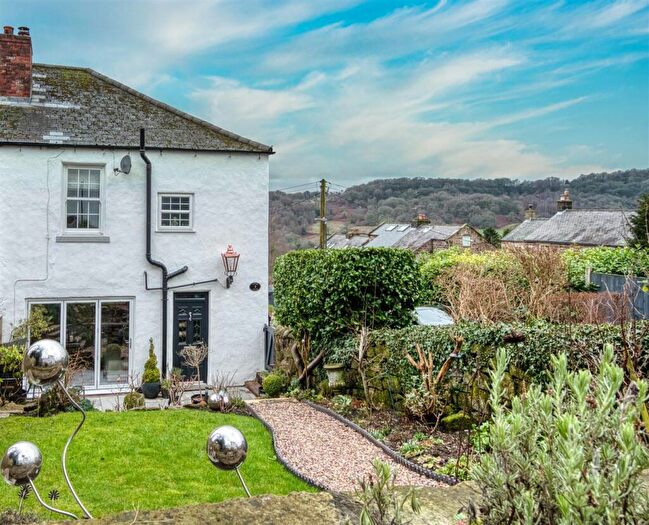
Properties for sale in Crich
Roads and Postcodes in Crich
Navigate through our locations to find the location of your next house in Crich, Matlock for sale or to rent.
| Streets | Postcodes |
|---|---|
| Amber Hill | DE4 5BZ |
| Bennetts Lane | DE4 5BS |
| Bower Drive | DE4 5NF |
| Bowns Hill | DE4 5DG |
| Bulling Lane | DE4 5DX |
| Carr Lane | DE4 5DR |
| Chadwick Nick Lane | DE4 5BY |
| Chapel Lane | DE4 5BU |
| Chase View | DE4 5DZ |
| Chatsworth Avenue | DE4 5DY |
| Coasthill | DE4 5DS |
| Coddington Lane | DE4 5EL |
| Crich Road | DE4 5EQ |
| Cromford Road | DE4 5DJ |
| Culland View | DE4 5DA |
| Dark Lane | DE4 5GW |
| Derby Road | DE4 5HG |
| Derwent Terrace | DE4 5NN |
| Dimple Villas | DE4 5BQ |
| Dowie Way | DE4 5NJ |
| Folds Yard | DE4 5DL |
| Forrester Close | DE4 5NQ |
| Glebe Field Close | DE4 5EU |
| Glen Road | DE4 5EH |
| Goodwin Close | DE4 5NY |
| Grays Close | DE4 5PF |
| High Lane | DE4 5BG |
| Hindersitch Lane | DE4 5EF DE4 5EJ |
| Hodder Close | DE4 5NH |
| Hollins Lane | DE4 5AL |
| Holly Bank Court | DE4 5HZ |
| Jeffries Avenue | DE4 5DU |
| Jeffries Lane | DE4 5DT |
| Joseph Roe Drive | DE4 5PD |
| Main Road | DE4 5EE DE4 5HE |
| Market Place | DE4 5DD |
| Middle Lane | DE4 5EG |
| New Road | DE4 5BX |
| North View | DE4 5BN |
| Oakwell Drive | DE4 5PB |
| Over Croft Lane | DE4 5PA |
| Oxhay Gardens | DE4 5PE |
| Parkhead | DE4 5GY |
| Pit Lane | DE4 5PJ |
| Plaistow Green | DE4 5GX |
| Potters Hill | DE4 5PH |
| Prospect Terrace | DE4 5BL |
| Robin Hood | DE4 5HF |
| Roes Court | DE4 5ED |
| Roes Lane | DE4 5DH |
| Sandy Lane | DE4 5DE |
| School Lane | DE4 5DF |
| Shaws Hill | DE4 5EP |
| Sheldon Gardens | DE4 5NE |
| Sherwood Drive | DE4 5NL |
| Shuckstone Lane | DE4 5GT |
| Snowdrop Valley | DE4 5BT |
| Springfield Close | DE4 5DB |
| St Michaels Close | DE4 5DN |
| Sun Lane | DE4 5BR |
| Surgery Lane | DE4 5BP |
| Tarry Fields Court | DE4 5PP |
| The Beeches | DE4 5DW |
| The Common | DE4 5BH DE4 5BJ DE4 5BW |
| The Fields | DE4 5DQ |
| The Tors | DE4 5EA |
| Thurlow Booth | DE4 5ER |
| Top Lane | DE4 5EN |
| Tors Springs | DE4 5HR |
| Town End | DE4 5DP |
| Wakebridge | DE4 5HD |
| Weaver Close | DE4 5ET |
| Westbank Avenue | DE4 5EB |
| Wheatsheaf Lane | DE4 5HW |
| Woodside | DE4 5FX |
| DE4 5GU |
Transport near Crich
-
Whatstandwell Station
-
Ambergate Station
-
Cromford Station
-
Matlock Bath Station
-
Belper Station
-
Matlock Station
-
Alfreton Station
- FAQ
- Price Paid By Year
- Property Type Price
Frequently asked questions about Crich
What is the average price for a property for sale in Crich?
The average price for a property for sale in Crich is £366,390. This amount is 12% higher than the average price in Matlock. There are 1,025 property listings for sale in Crich.
What streets have the most expensive properties for sale in Crich?
The streets with the most expensive properties for sale in Crich are Over Croft Lane at an average of £1,165,000, Roes Lane at an average of £707,000 and Chadwick Nick Lane at an average of £600,000.
What streets have the most affordable properties for sale in Crich?
The streets with the most affordable properties for sale in Crich are Oakwell Drive at an average of £146,000, Westbank Avenue at an average of £182,000 and Cromford Road at an average of £190,000.
Which train stations are available in or near Crich?
Some of the train stations available in or near Crich are Whatstandwell, Ambergate and Cromford.
Property Price Paid in Crich by Year
The average sold property price by year was:
| Year | Average Sold Price | Price Change |
Sold Properties
|
|---|---|---|---|
| 2025 | £409,537 | 11% |
27 Properties |
| 2024 | £366,358 | 11% |
46 Properties |
| 2023 | £324,837 | -8% |
28 Properties |
| 2022 | £350,139 | 5% |
31 Properties |
| 2021 | £334,281 | -1% |
49 Properties |
| 2020 | £337,693 | 14% |
39 Properties |
| 2019 | £291,011 | 14% |
76 Properties |
| 2018 | £250,786 | -3% |
63 Properties |
| 2017 | £259,552 | 25% |
55 Properties |
| 2016 | £194,405 | -37% |
28 Properties |
| 2015 | £265,402 | 8% |
54 Properties |
| 2014 | £245,291 | 10% |
43 Properties |
| 2013 | £220,981 | 3% |
33 Properties |
| 2012 | £213,705 | 2% |
17 Properties |
| 2011 | £209,850 | -17% |
27 Properties |
| 2010 | £244,666 | 23% |
24 Properties |
| 2009 | £188,641 | -5% |
28 Properties |
| 2008 | £197,665 | -23% |
19 Properties |
| 2007 | £243,860 | 11% |
37 Properties |
| 2006 | £218,058 | 12% |
42 Properties |
| 2005 | £191,343 | -11% |
33 Properties |
| 2004 | £212,018 | 13% |
48 Properties |
| 2003 | £183,868 | 24% |
52 Properties |
| 2002 | £139,437 | 15% |
54 Properties |
| 2001 | £118,994 | 2% |
42 Properties |
| 2000 | £116,497 | 14% |
55 Properties |
| 1999 | £100,540 | 8% |
85 Properties |
| 1998 | £92,072 | 20% |
42 Properties |
| 1997 | £73,297 | -1% |
33 Properties |
| 1996 | £74,287 | -8% |
40 Properties |
| 1995 | £80,550 | - |
28 Properties |
Property Price per Property Type in Crich
Here you can find historic sold price data in order to help with your property search.
The average Property Paid Price for specific property types in the last three years are:
| Property Type | Average Sold Price | Sold Properties |
|---|---|---|
| Semi Detached House | £271,054.00 | 28 Semi Detached Houses |
| Detached House | £487,845.00 | 50 Detached Houses |
| Terraced House | £230,187.00 | 21 Terraced Houses |
| Flat | £94,858.00 | 2 Flats |

