
Houses for sale in Alport, Matlock
House Prices in Alport
Properties in Alport have an average house price of £435k and had 34 Property Transactions within the last 3 years¹.
Alport is an area in Matlock, Derbyshire with 635 households², where the most expensive property was sold for £1.4M.
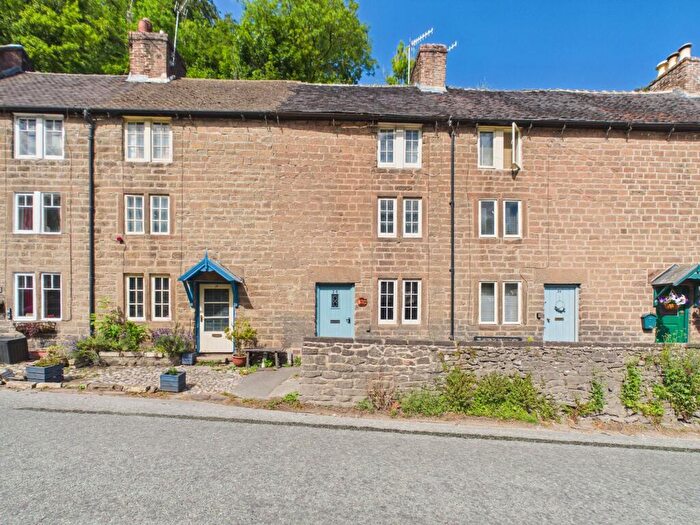
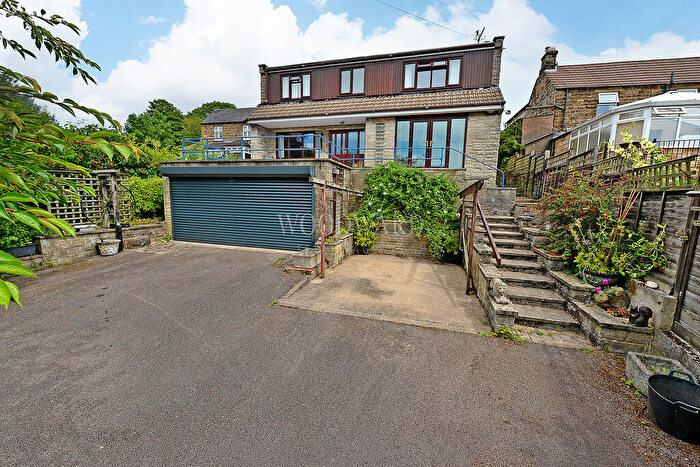
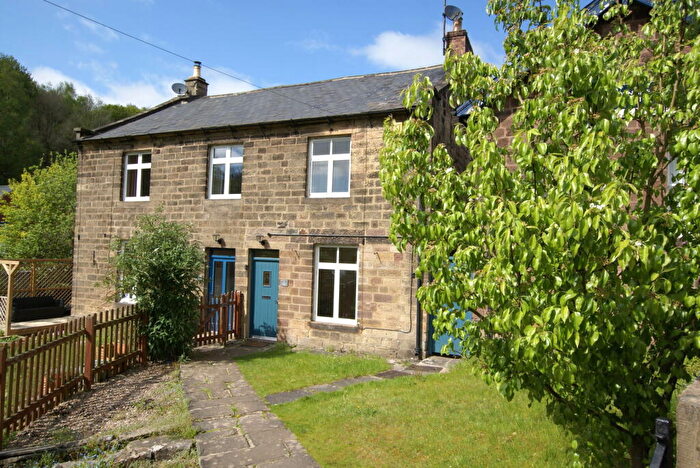
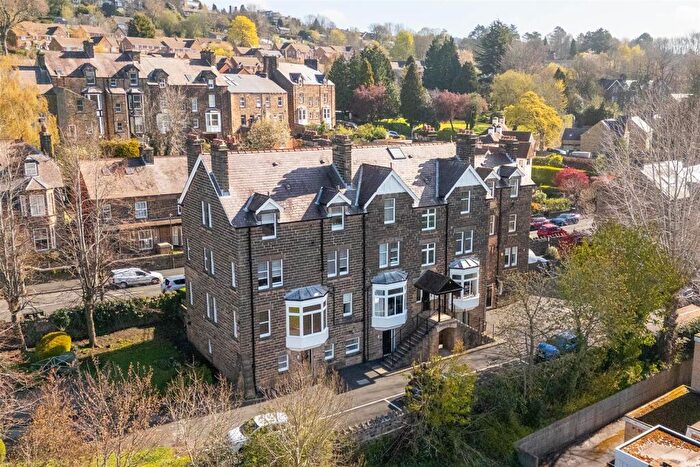
Properties for sale in Alport
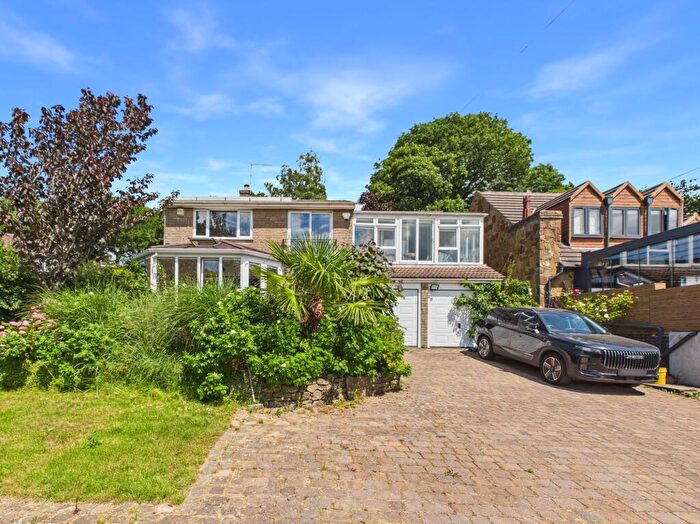

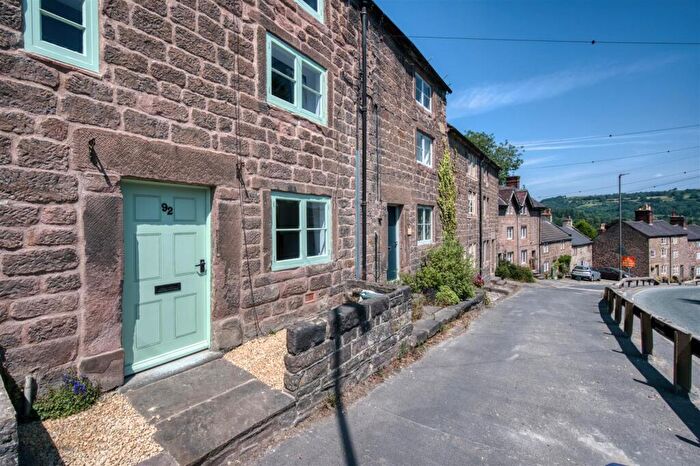
![]()
If you are looking to sell your house, let it out, or receive a property valuation, an expert can help you.
Click the button below to get started.


Roads and Postcodes in Alport
Navigate through our locations to find the location of your next house in Alport, Matlock for sale or to rent.
| Streets | Postcodes |
|---|---|
| Alderwasley Park | DE4 5HP |
| Alsop Lane | DE4 5NT |
| Ashleyhay | DE4 4AG DE4 4AH |
| Beighton Hill | DE4 4AJ |
| Buxton Terrace | DE4 5AW |
| Chapel Lane | DE4 5AU |
| Church Street | DE4 5AY DE4 5JP |
| Cowgate | DE4 5JL |
| Cupola Park | DE4 5HT |
| Derby Road | DE4 5HH |
| Derwent Way | DE4 5PG |
| High Lane | DE4 5HY |
| Hillside | DE4 5AX |
| Hollins Wood Close | DE4 5AD |
| Holme Close | DE4 5BE |
| Holt Lane | DE4 5GQ |
| Ivy Cottages | DE4 5GH |
| Lathkill Lane | DE4 5NP |
| Lea Bridge | DE4 5AF DE4 5JN |
| Lea Lane | DE4 5NU |
| Lea Moor Road | DE4 5GS DE4 5RA |
| Lea Road | DE4 5AH |
| Lea Shaw | DE4 5AT |
| Lea Wood | DE4 5AA |
| Leawood Croft | DE4 5BD |
| Little London | DE4 5AZ |
| Long Lane | DE4 5NX |
| Main Road | DE4 5GJ |
| Mill Lane | DE4 5AQ DE4 5NZ |
| Nightingale Close | DE4 5AJ |
| Post Office Cottages | DE4 5AE |
| Riber Road | DE4 5JQ |
| Shelford Lane | DE4 5GN |
| Sledgegate Lane | DE4 5GL |
| Sunny Ridge | DE4 5AS |
| The Glade | DE4 5JZ |
| The Hollins | DE4 5BA |
| Thorpe Croft | DE4 5BB |
| Upper Lea | DE4 5GR |
| Wirksworth Road | DE4 5HS |
| Wood End | DE4 5AP |
| Yew Tree Hill | DE4 5AR |
| DE4 5GG |
Property price trends in Alport
According to the latest Land Registry data, the average home in Alport sold for £481,121 in 2025. That figure comes from 440 sales logged over the past 30 years.
Prices have continued to climb over the last three years. Compared with 2022, when the typical sale came in around £402,221, that's a rise of roughly 19.6%.
Looking back five years, average prices are up about 9.7% since 2020, a gain of around £42,571 in cash terms.
Zoom out to the past decade for the fuller picture. Back in 2015, homes here averaged £262,588, so the typical sold price has climbed about 83.2% since then, roughly 6.2% a year. Stretch the view to fifteen years and that annual pace eases back to about 3.4%.
Frequently asked questions about Alport
What is the average price for a property for sale in Alport?
The average price for a property for sale in Alport is £434,591. This amount is 33% higher than the average price in Matlock. There are 1,825 property listings for sale in Alport.
What streets have the most expensive properties for sale in Alport?
The streets with the most expensive properties for sale in Alport are Upper Lea at an average of £870,500, Holt Lane at an average of £729,000 and Post Office Cottages at an average of £630,000.
What streets have the most affordable properties for sale in Alport?
The streets with the most affordable properties for sale in Alport are Lea Road at an average of £205,000, The Hollins at an average of £220,000 and Nightingale Close at an average of £227,500.
Which train stations are available in or near Alport?
Some of the train stations available in or near Alport are Whatstandwell, Cromford and Matlock Bath.
Property Price Paid in Alport by Year
The average sold property price by year was:
| Year | Average Sold Price | Price Change |
Sold Properties
|
|---|---|---|---|
| 2025 | £481,121 | 18% |
16 Properties |
| 2024 | £393,128 | -0,1% |
9 Properties |
| 2023 | £393,333 | -2% |
9 Properties |
| 2022 | £402,221 | -2% |
18 Properties |
| 2021 | £409,824 | -7% |
25 Properties |
| 2020 | £438,550 | 32% |
10 Properties |
| 2019 | £297,303 | -24% |
13 Properties |
| 2018 | £369,545 | 28% |
11 Properties |
| 2017 | £266,562 | -36% |
20 Properties |
| 2016 | £363,710 | 28% |
14 Properties |
Property Price per Property Type in Alport
Here you can find historic sold price data in order to help with your property search.
The average Property Paid Price for specific property types in the last three years are:
| Property Type | Average Sold Price | Sold Properties |
|---|---|---|
| Semi Detached House | £307,086.00 | 11 Semi Detached Houses |
| Detached House | £576,508.00 | 18 Detached Houses |
| Terraced House | £204,200.00 | 5 Terraced Houses |
