
Houses for sale in Stanton, Matlock
House Prices in Stanton
Properties in Stanton have an average house price of £346k and had 69 Property Transactions within the last 3 years¹.
Stanton is an area in Matlock, Derbyshire with 780 households², where the most expensive property was sold for £1.4M.
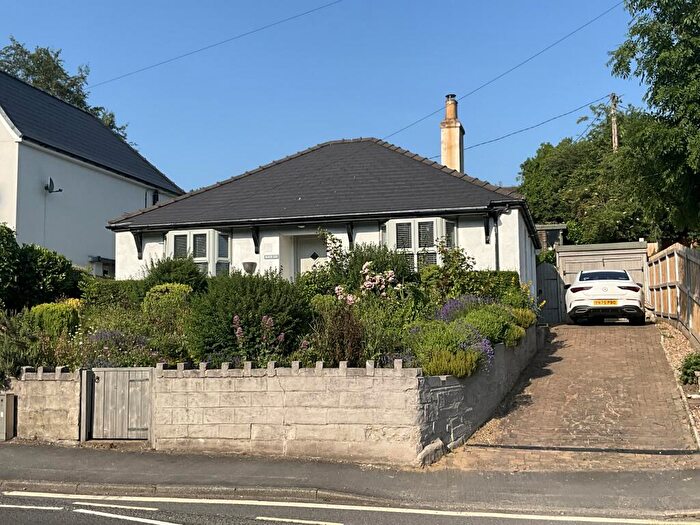
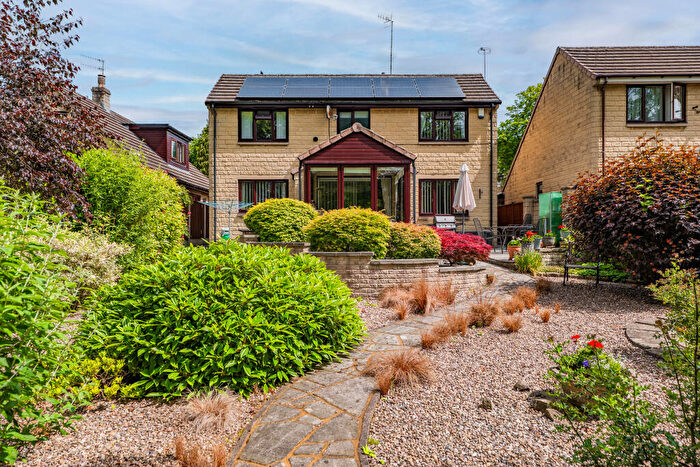
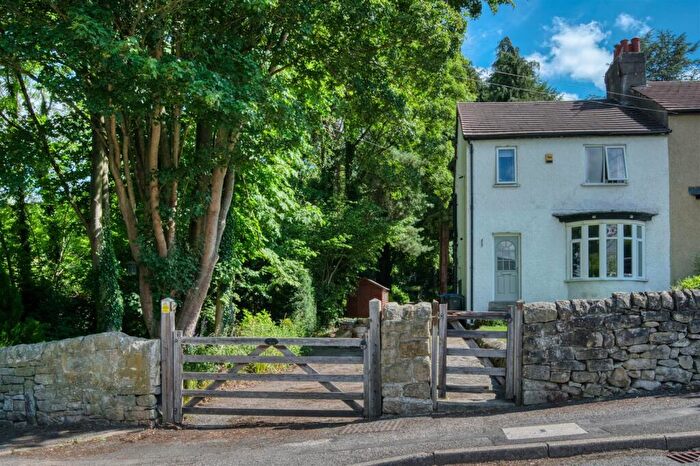
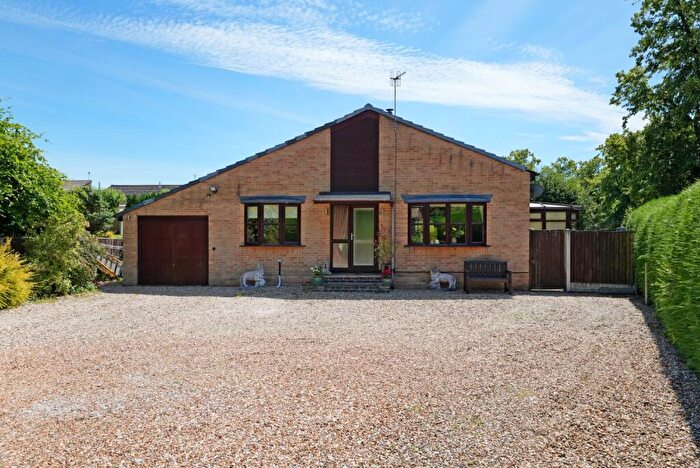
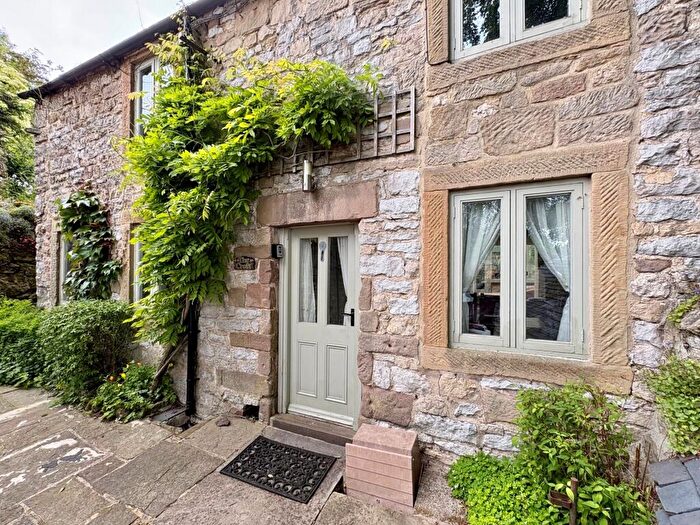
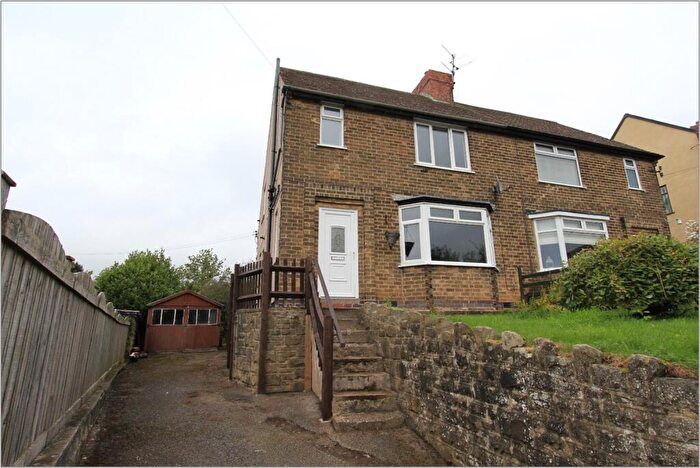
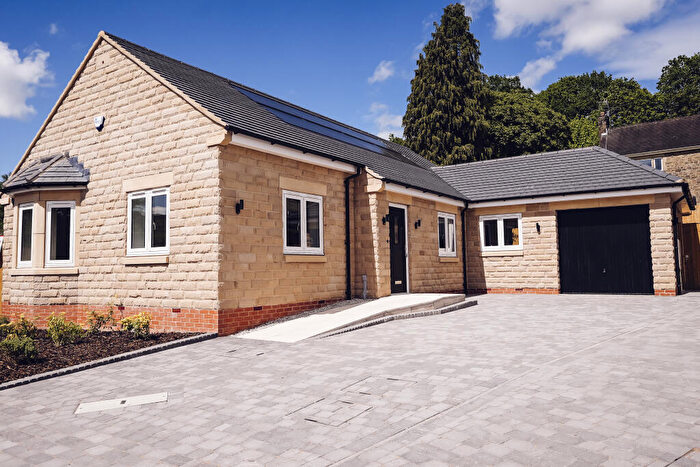
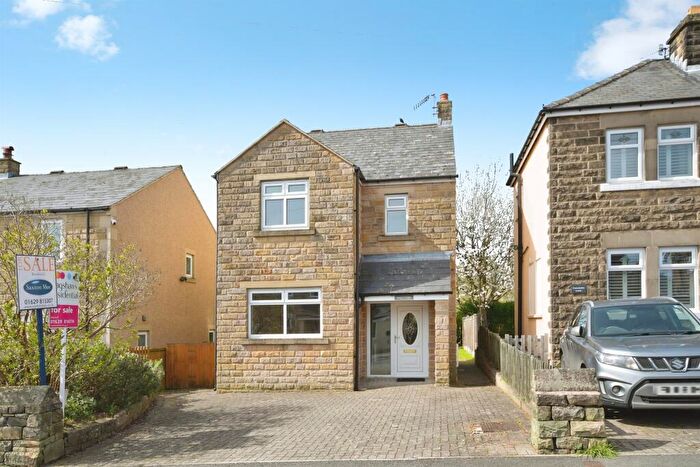
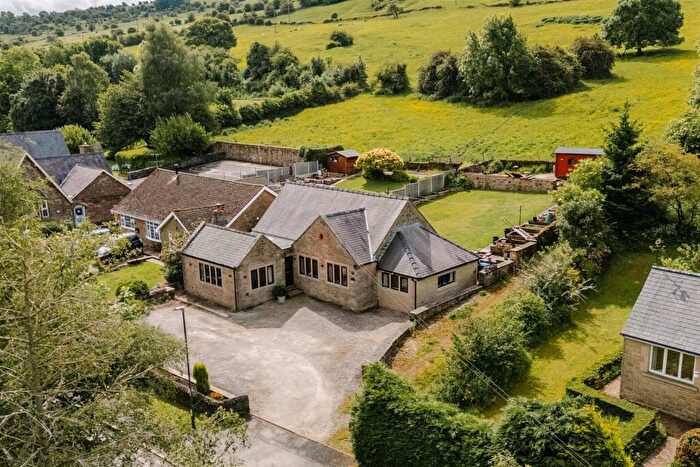
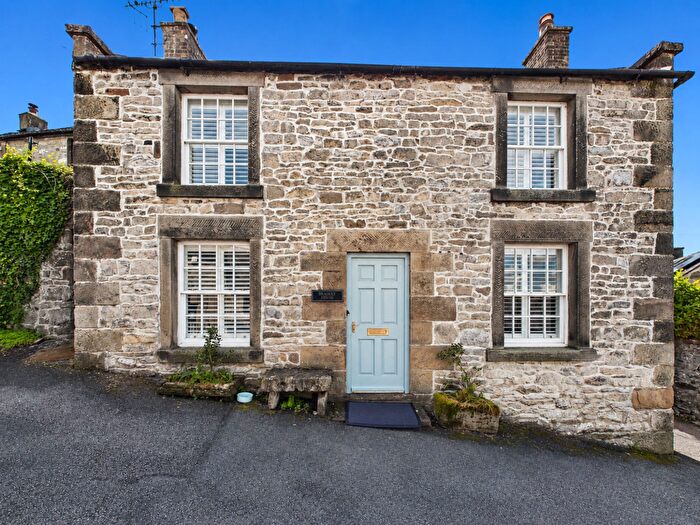
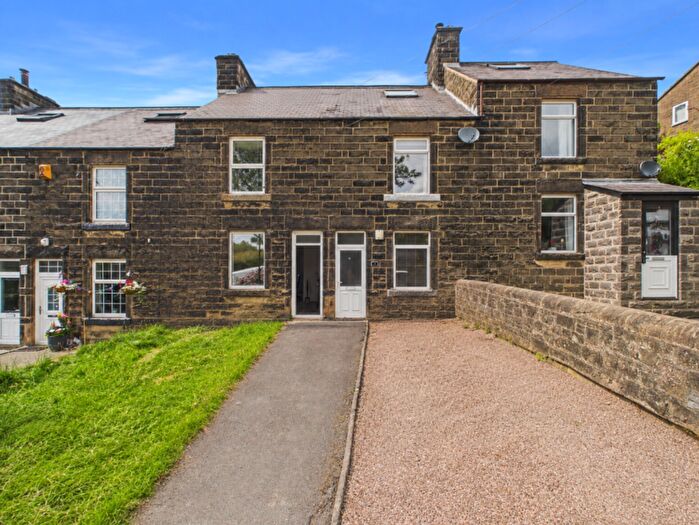
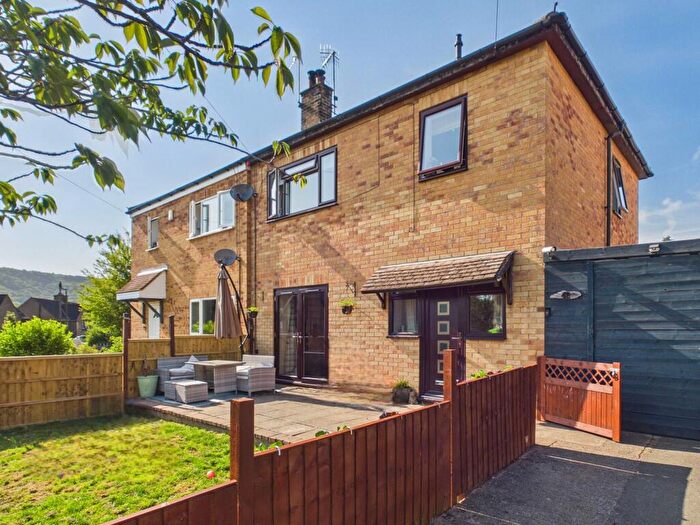
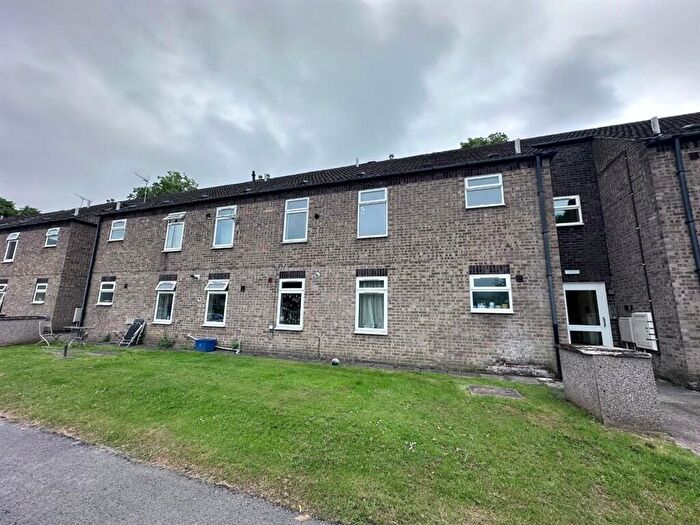
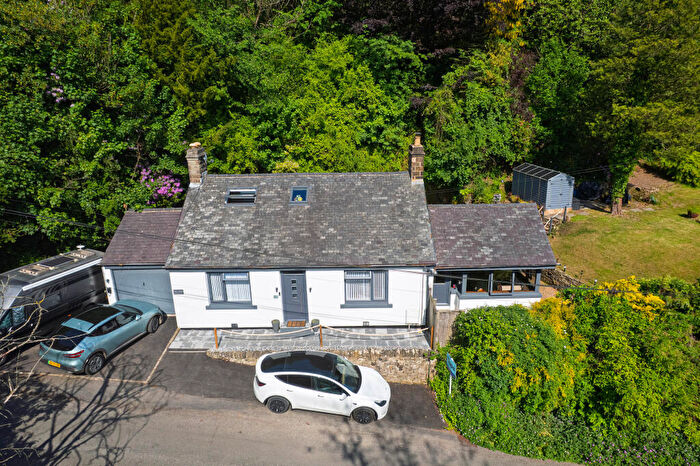
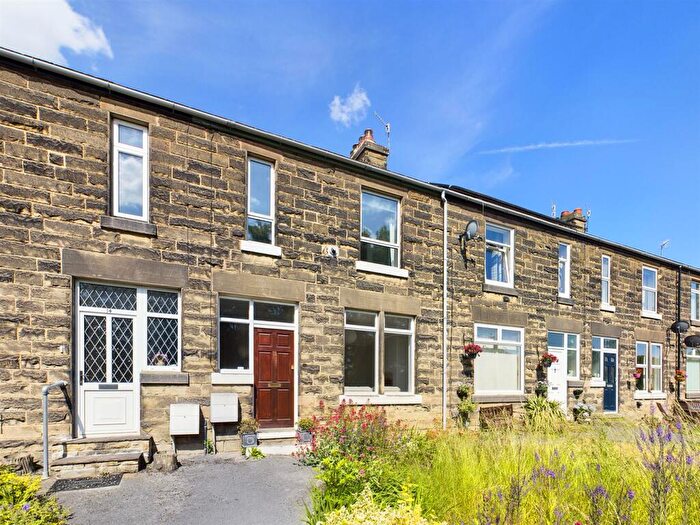
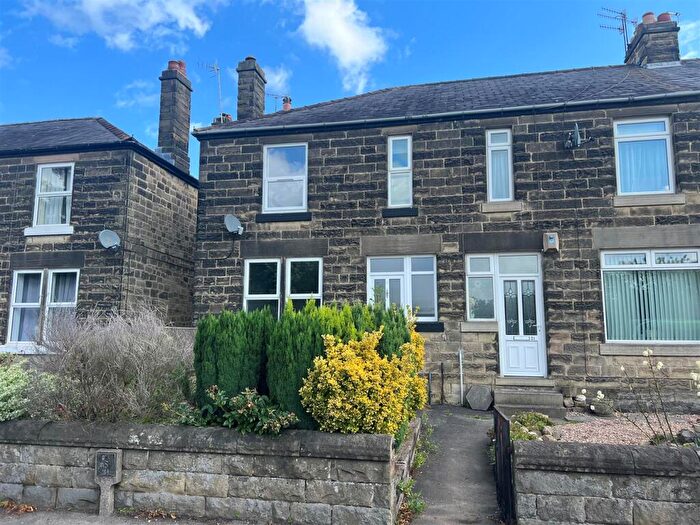
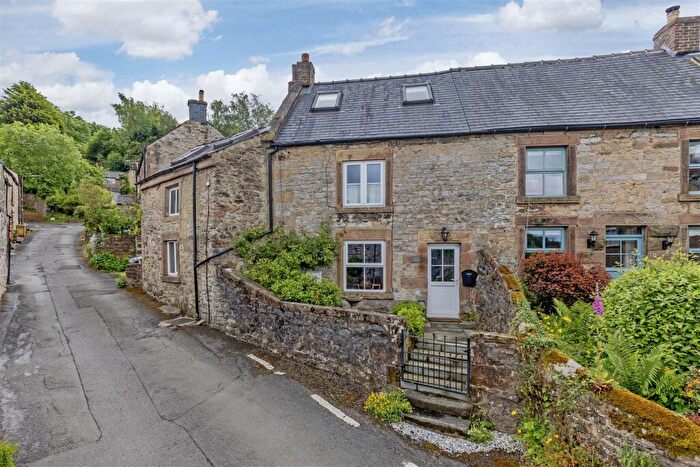
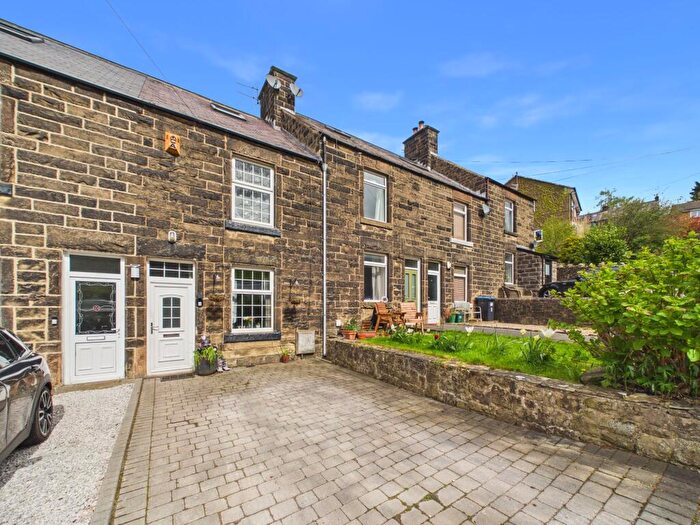
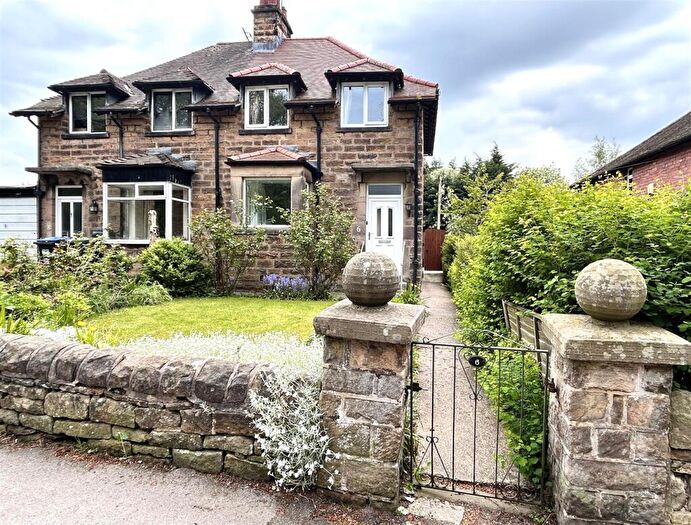
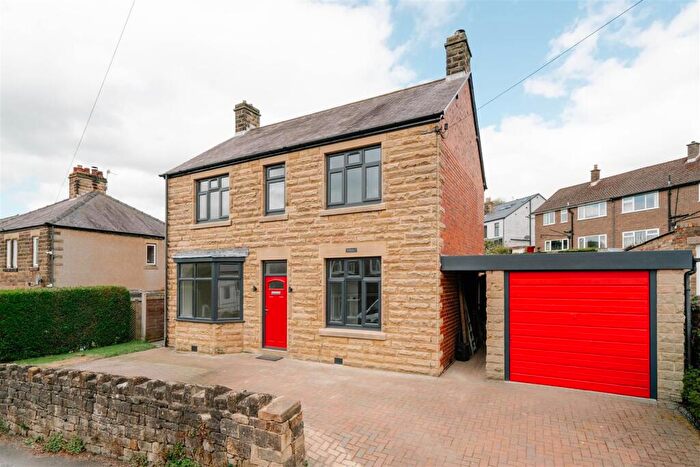
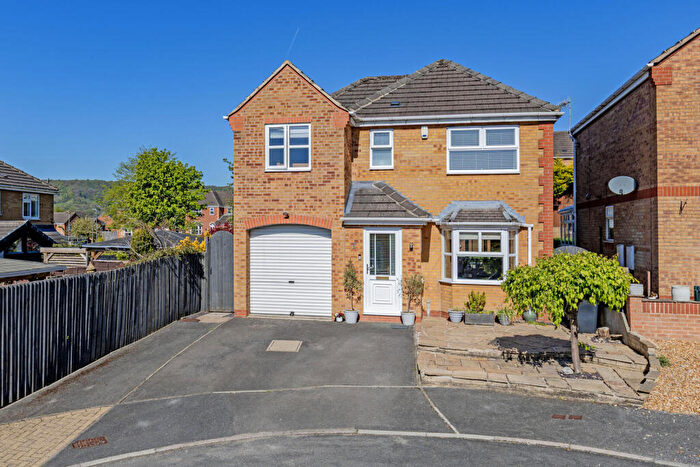
Properties for sale in Stanton
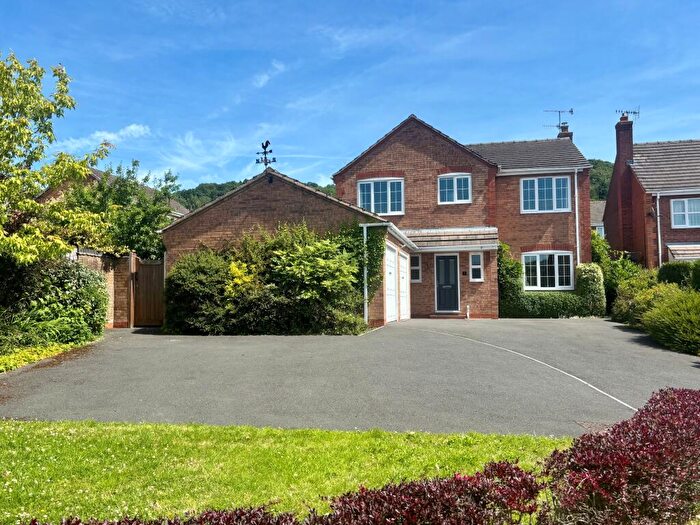
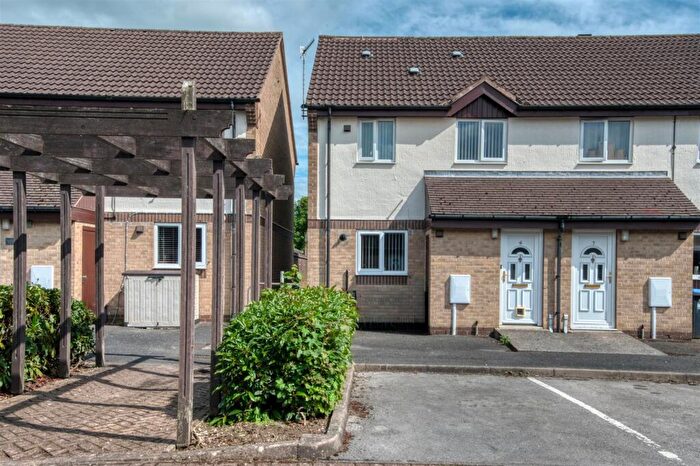
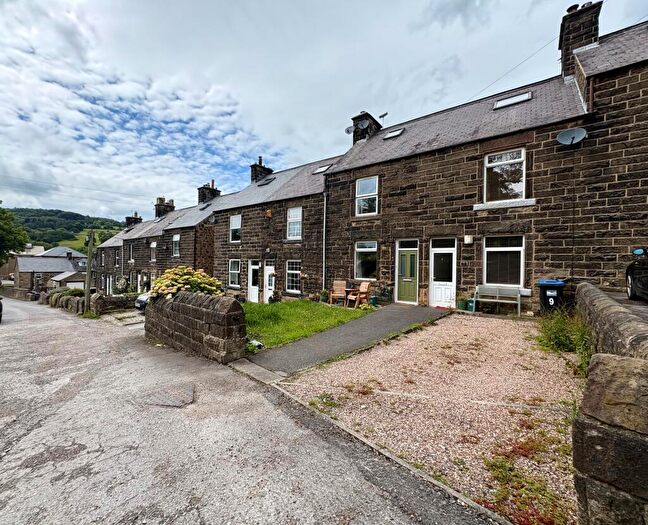
![]()
If you are looking to sell your house, let it out, or receive a property valuation, an expert can help you.
Click the button below to get started.
Roads and Postcodes in Stanton
Navigate through our locations to find the location of your next house in Stanton, Matlock for sale or to rent.
| Streets | Postcodes |
|---|---|
| Annies Close | DE4 2BE |
| Bakewell Road | DE4 2EB |
| Barton Hill Croft | DE4 2DW |
| Birchover Road | DE4 2LR |
| Bradley Close | DE4 2BG |
| Carlton Avenue | DE4 2HW |
| Chatsworth Road | DE4 2JE DE4 2EH DE4 2EJ |
| Chesterfield Road | DE4 2EG DE4 2NL DE4 2NN |
| Church Lane | DE4 2EA |
| Coach Lane | DE4 2NA |
| Congreave | DE4 2NF |
| Dale Road North | DE4 2JB |
| Devonshire Drive | DE4 2HB |
| Dungreave Avenue | DE4 2HZ |
| Eagle Tor | DE4 2LY |
| Grafton Terrace | DE4 2HX |
| Harrison Way | DE4 2LF |
| Hartle Green | DE4 2BJ |
| Hinckley Court | DE4 2DF |
| Keeling Lane | DE4 2BS |
| Keeling Terrace | DE4 2BL |
| Lees Road | DE4 2LS |
| Lumb Lane | DE4 2HP |
| Main Road | DE4 2LW DE4 2LX |
| Main Street | DE4 2BN |
| Matlock Road | DE4 2EF DE4 2NH |
| Middle Street | DE4 2LT |
| Northwood Lane | DE4 2HQ DE4 2HR DE4 2HS |
| Old Station Close | DE4 2EL |
| Park Lane | DE4 2LU |
| Park Terrace | DE4 2HY |
| Pilhough | DE4 2NE |
| Riverbank | DE4 2DY |
| Schofield Court | DE4 2GZ |
| School Lane | DE4 2EE |
| St Katherines Close | DE4 2DZ |
| Stanton Woodhouse | DE4 2NG |
| Sunnybank | DE4 2DX |
| The Avenue | DE4 2HT |
| The Green | DE4 2BP DE4 2LG |
| The Miers | DE4 2BQ |
| Thorncliffe Avenue | DE4 2HU |
| Tinkersley | DE4 2NJ |
| Uppertown | DE4 2BH |
| Warren Carr | DE4 2LN |
| Woodhouse Road | DE4 2ED |
| DE4 2RS DE4 2LQ DE4 2NP |
Property price trends in Stanton
According to the latest Land Registry data, the average home in Stanton sold for £175,175 in 2026. That figure comes from 880 sales logged over the past 31 years.
Prices have fallen back over the last three years. Compared with 2023, when the typical sale came in around £329,113, that's a fall of roughly 46.8%.
Looking back five years, average prices are down about 49.7% since 2021, a drop of around £173,265 in cash terms.
Zoom out to the past decade for the fuller picture. Back in 2016, homes here averaged £216,752, so the typical sold price has fallen about 19.2% since then, around 2.1% a year lower. Stretch the view to fifteen years and that annual pace eases back to about -2.9%.
Frequently asked questions about Stanton
What is the average price for a property for sale in Stanton?
The average price for a property for sale in Stanton is £346,458. This amount is 6% higher than the average price in Matlock. There are 380 property listings for sale in Stanton.
What streets have the most expensive properties for sale in Stanton?
The streets with the most expensive properties for sale in Stanton are Church Lane at an average of £818,750, Lumb Lane at an average of £600,000 and Keeling Terrace at an average of £535,000.
What streets have the most affordable properties for sale in Stanton?
The streets with the most affordable properties for sale in Stanton are Bradley Close at an average of £130,000, Barton Hill Croft at an average of £145,000 and Grafton Terrace at an average of £211,833.
Which train stations are available in or near Stanton?
Some of the train stations available in or near Stanton are Matlock, Matlock Bath and Cromford.
Property Price Paid in Stanton by Year
The average sold property price by year was:
| Year | Average Sold Price | Price Change |
Sold Properties
|
|---|---|---|---|
| 2026 | £175,175 | -70% |
1 Property |
| 2025 | £297,058 | -34% |
17 Properties |
| 2024 | £396,815 | 17% |
28 Properties |
| 2023 | £329,113 | -7% |
23 Properties |
| 2022 | £351,098 | 1% |
27 Properties |
| 2021 | £348,440 | 1% |
44 Properties |
| 2020 | £346,282 | 9% |
23 Properties |
| 2019 | £314,942 | 6% |
26 Properties |
| 2018 | £297,126 | -6% |
23 Properties |
| 2017 | £315,877 | 31% |
35 Properties |
Property Price per Property Type in Stanton
Here you can find historic sold price data in order to help with your property search.
The average Property Paid Price for specific property types in the last three years are:
| Property Type | Average Sold Price | Sold Properties |
|---|---|---|
| Semi Detached House | £274,383.00 | 23 Semi Detached Houses |
| Detached House | £488,967.00 | 28 Detached Houses |
| Terraced House | £215,604.00 | 16 Terraced Houses |
| Flat | £227,000.00 | 2 Flats |
