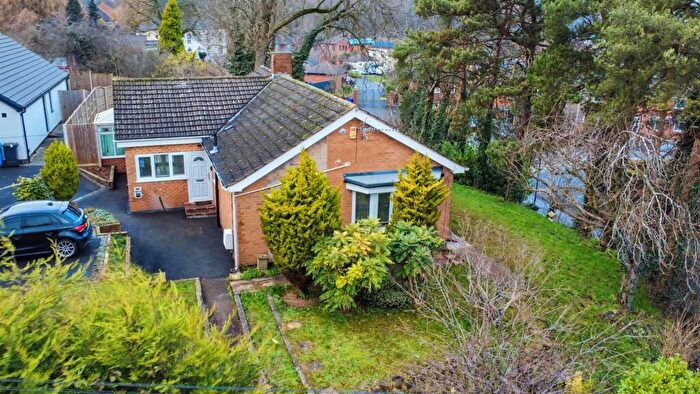
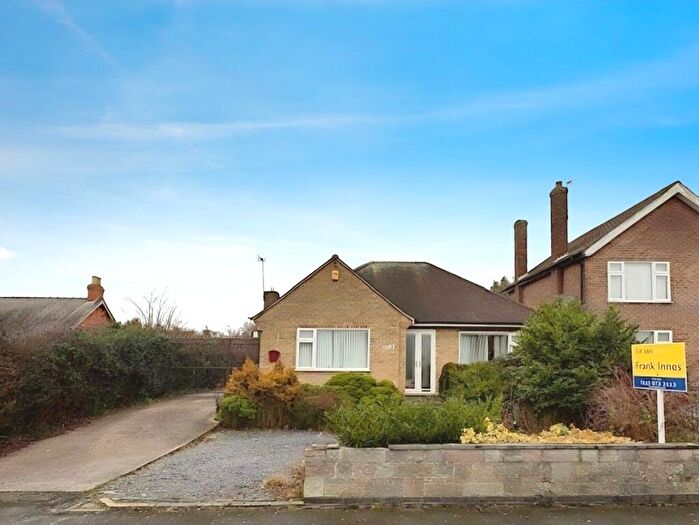
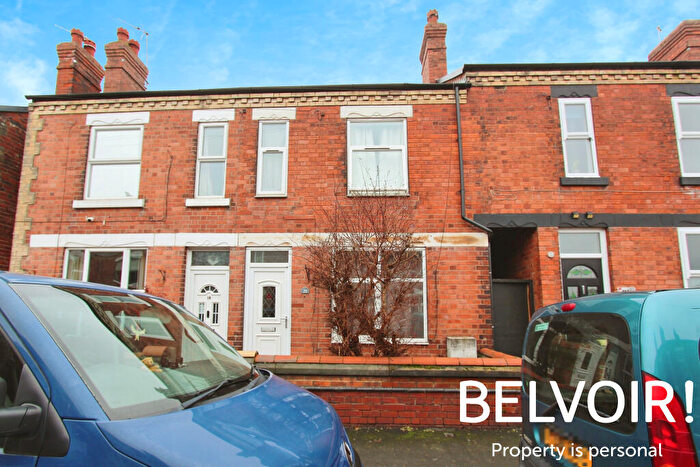
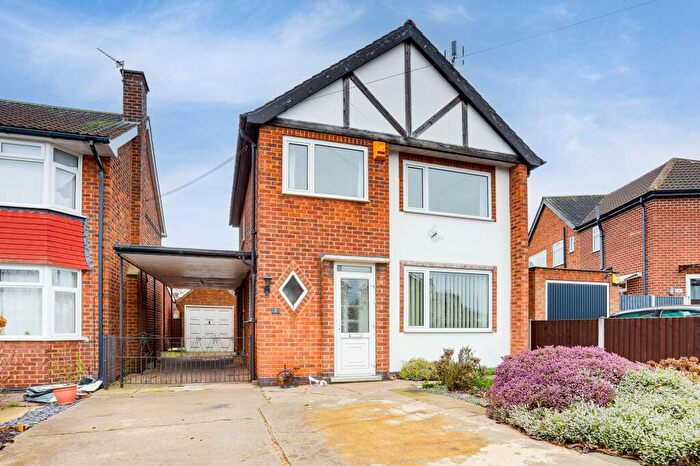
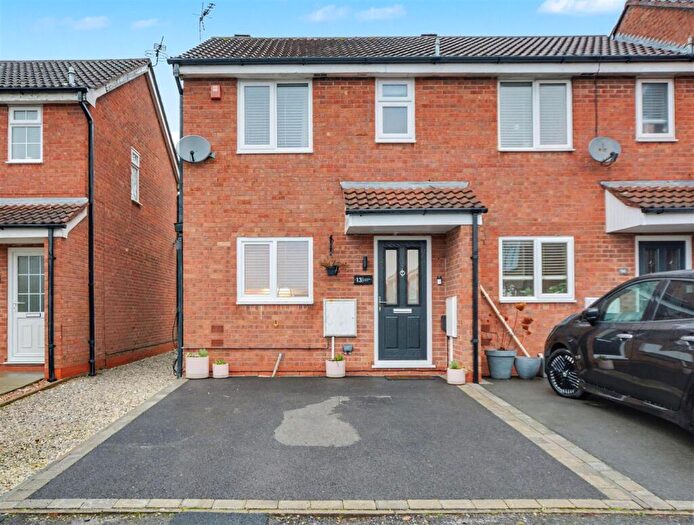
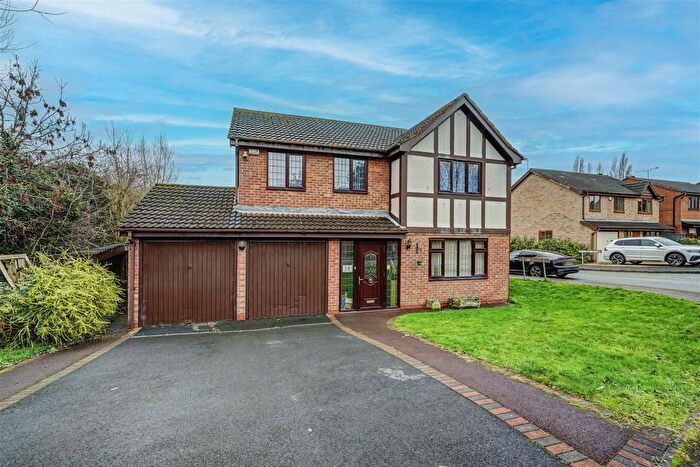
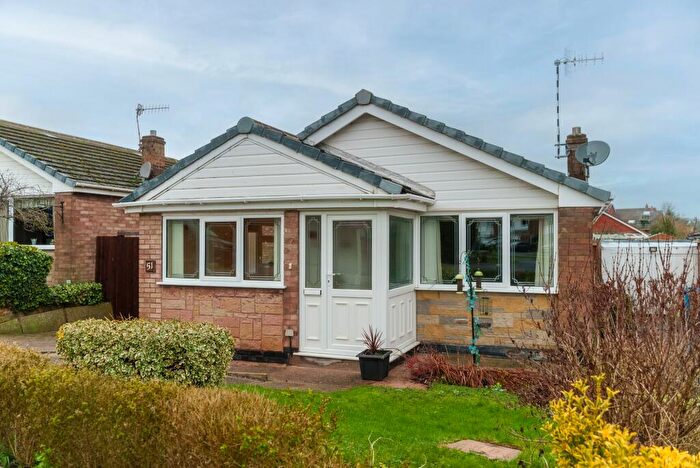
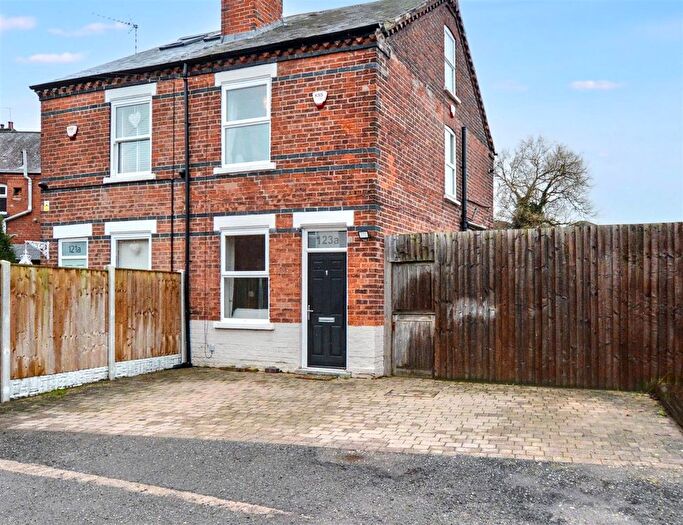
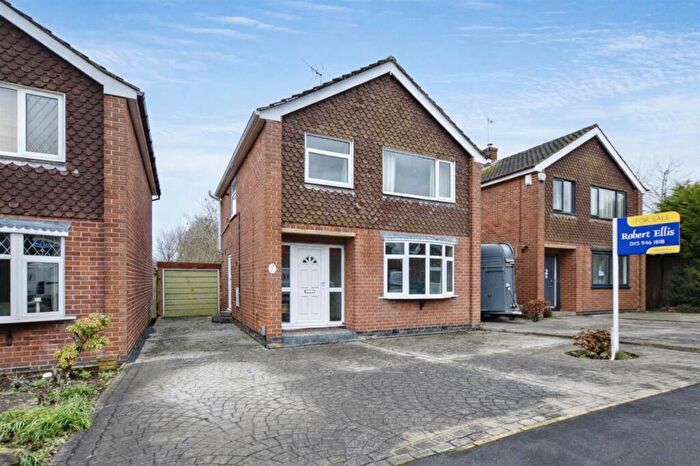
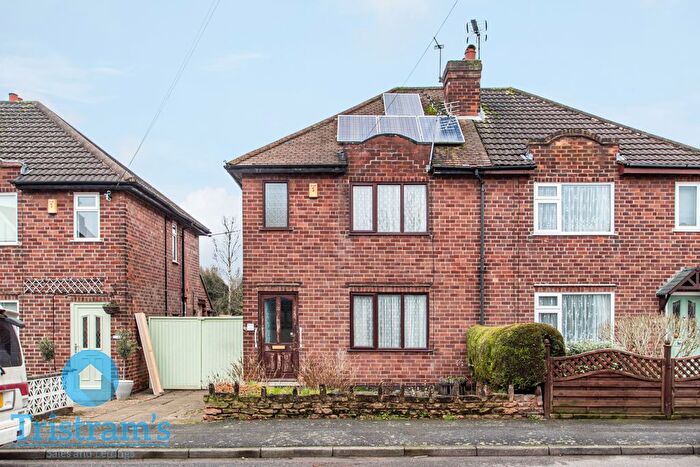
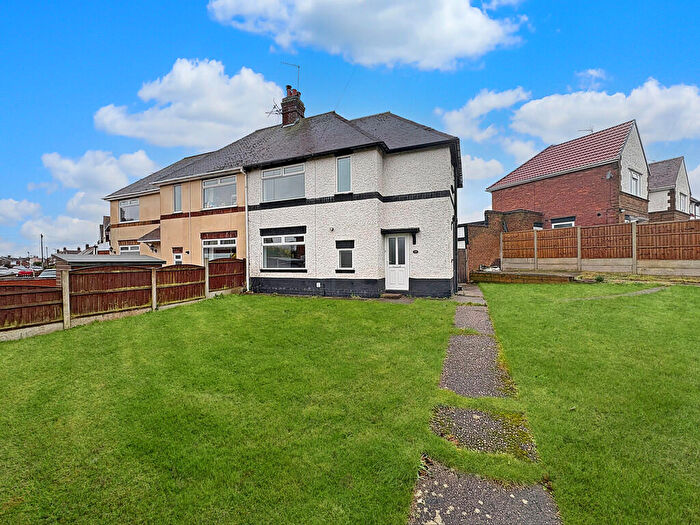
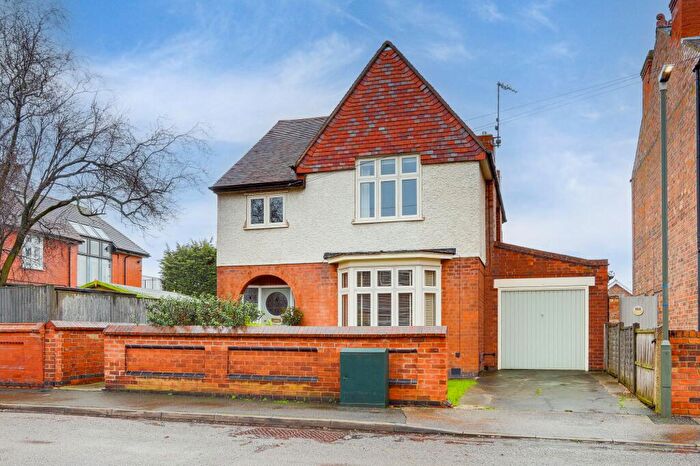
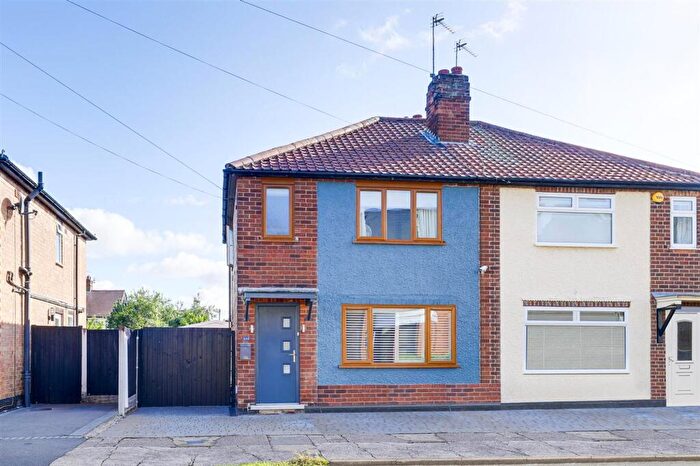
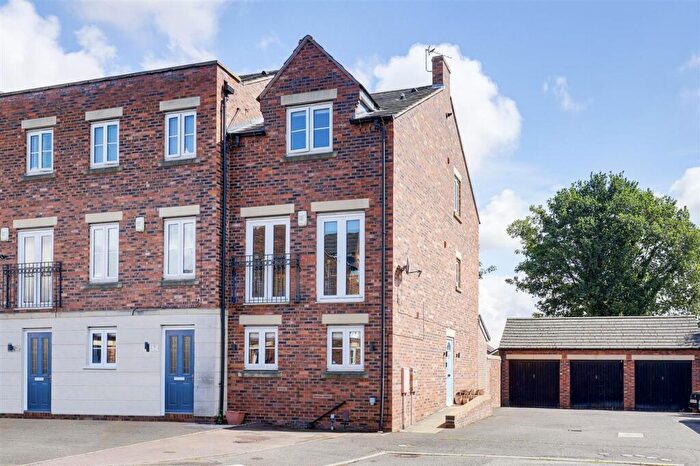
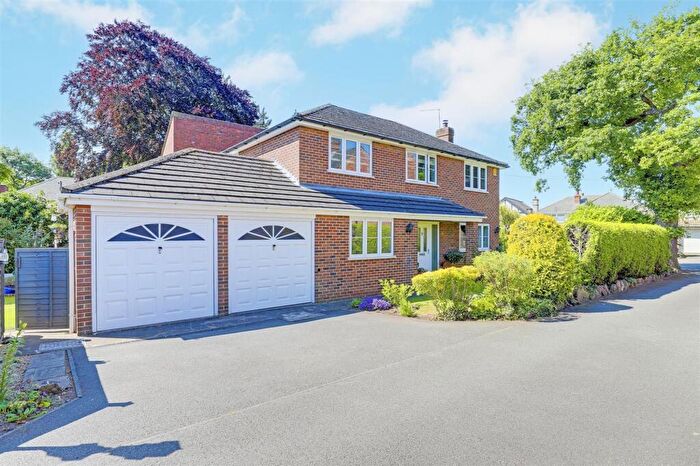
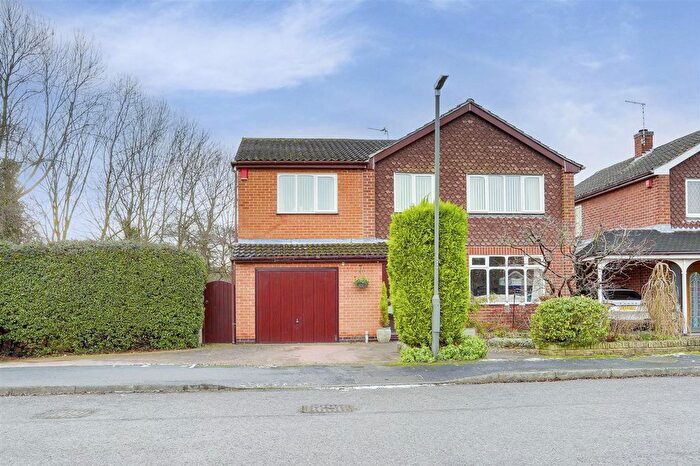
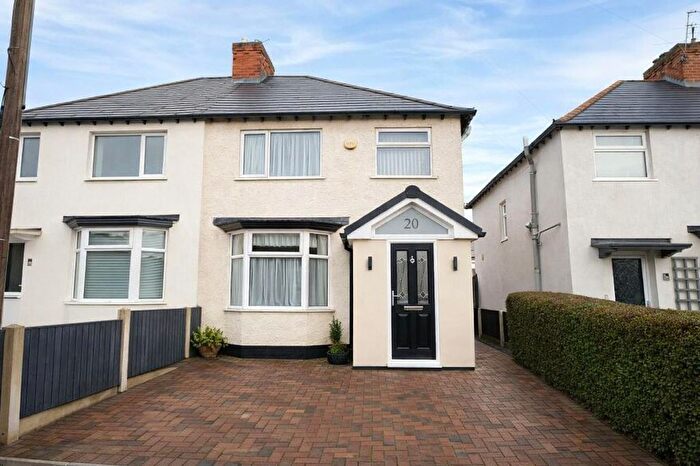
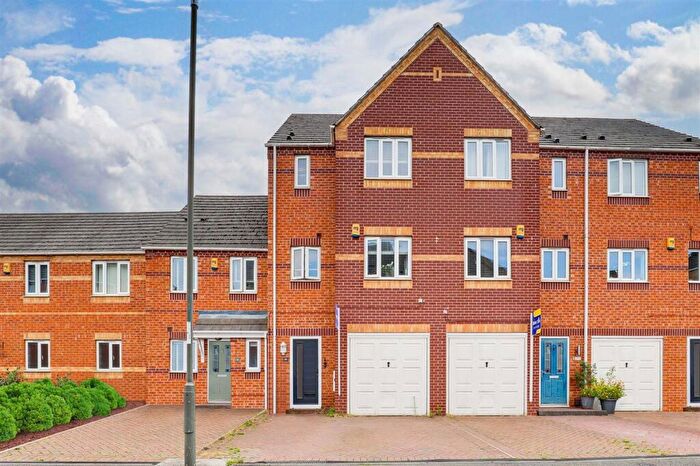
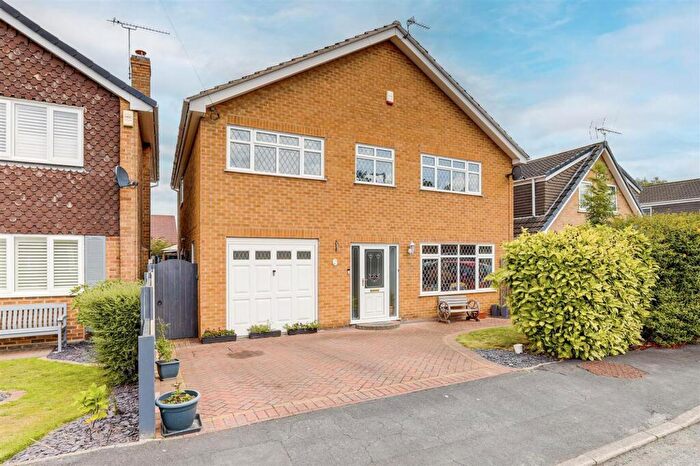
Houses for sale & to rent in Sandiacre South, Nottingham
House Prices in Sandiacre South
Properties in Sandiacre South have an average house price of £246,756.00 and had 153 Property Transactions within the last 3 years¹.
Sandiacre South is an area in Nottingham, Derbyshire with 1,679 households², where the most expensive property was sold for £575,000.00.
Properties for sale in Sandiacre South
Roads and Postcodes in Sandiacre South
Navigate through our locations to find the location of your next house in Sandiacre South, Nottingham for sale or to rent.
| Streets | Postcodes |
|---|---|
| Arundel Close | NG10 5PG |
| Austins Drive | NG10 5JX |
| Balmoral Close | NG10 5LF |
| Belton Close | NG10 5PE |
| Blair Grove | NG10 5PS |
| Blenheim Court | NG10 5PQ |
| Bostocks Lane | NG10 5ND NG10 5NL |
| Bradgate Close | NG10 5PJ |
| Briar Avenue | NG10 5NG |
| Broadlands | NG10 5QE |
| Broomfield Close | NG10 5GQ |
| Buckingham Road | NG10 5PP |
| Charnwood Avenue | NG10 5HD |
| Chatsworth Close | NG10 5PF |
| Cockayne Close | NG10 5NY |
| Collin Avenue | NG10 5JR |
| Derby Road | NG10 5GN NG10 5GT NG10 5HE NG10 5HS NG10 5HU |
| Devon Close | NG10 5NT |
| Dorothy Avenue | NG10 5LH |
| Ellerslie Grove | NG10 5GS |
| Faircroft Avenue | NG10 5HT |
| Far New Close | NG10 5NX |
| Gatcombe Grove | NG10 5PN |
| Gloucester Avenue | NG10 5GX |
| Hadstock Close | NG10 5LQ |
| Hampshire Drive | NG10 5NS |
| Harewood Close | NG10 5PL |
| Hatfield Avenue | NG10 5NZ |
| Hayworth Road | NG10 5LL |
| Hollingworth Avenue | NG10 5LY |
| Huntingdon Walk | NG10 5GG |
| Kensington Road | NG10 5PD |
| Lancaster Avenue | NG10 5GW |
| Lincoln Avenue | NG10 5GZ |
| Lock Lane | NG10 5JL NG10 5LB |
| Longmoor Lane | NG10 5JH NG10 5JJ NG10 5JN NG10 5JP NG10 5JQ NG10 5LJ NG10 5LT NG10 5LW |
| Margaret Avenue | NG10 5JU NG10 5JW |
| Moorfield Crescent | NG10 5GR |
| Mountfield Avenue | NG10 5LS |
| Netherfield Road | NG10 5LN NG10 5LP NG10 5LR |
| Norfolk Walk | NG10 5NW |
| Oakfield Drive | NG10 5NH |
| Orchard Way | NG10 5NF |
| Osborne Close | NG10 5PA |
| Park Drive | NG10 5NB |
| Princess Drive | NG10 5LU |
| Queens Drive | NG10 5LX |
| Richmond Avenue | NG10 5GY |
| Sandringham Road | NG10 5LD NG10 5LE |
| Shaftesbury Avenue | NG10 5GU |
| Springfield Avenue | NG10 5LZ NG10 5NA |
| St James Court | NG10 5NR |
| Station Road | NG10 5AG NG10 5BE |
| Sussex Way | NG10 5NU |
| The Waterway | NG10 5JZ |
| Victor Crescent | NG10 5JS NG10 5JT NG10 5JY |
| Waterside Close | NG10 5PW |
| Willow Rise | NG10 5LG |
| Windsor Court | NG10 5PH |
| Woburn Croft | NG10 5PR |
| Woodside Road | NG10 5GP |
| York Avenue | NG10 5HA NG10 5HB |
Transport near Sandiacre South
-
Long Eaton Station
-
Attenborough Station
-
Beeston Station
-
East Midlands Parkway Station
-
Ilkeston Station
-
Spondon Station
- FAQ
- Price Paid By Year
- Property Type Price
Frequently asked questions about Sandiacre South
What is the average price for a property for sale in Sandiacre South?
The average price for a property for sale in Sandiacre South is £246,756. This amount is 14% higher than the average price in Nottingham. There are 1,300 property listings for sale in Sandiacre South.
What streets have the most expensive properties for sale in Sandiacre South?
The streets with the most expensive properties for sale in Sandiacre South are Buckingham Road at an average of £465,000, Woburn Croft at an average of £400,000 and Harewood Close at an average of £395,000.
What streets have the most affordable properties for sale in Sandiacre South?
The streets with the most affordable properties for sale in Sandiacre South are Lock Lane at an average of £162,333, Margaret Avenue at an average of £177,187 and Victor Crescent at an average of £177,300.
Which train stations are available in or near Sandiacre South?
Some of the train stations available in or near Sandiacre South are Long Eaton, Attenborough and Beeston.
Property Price Paid in Sandiacre South by Year
The average sold property price by year was:
| Year | Average Sold Price | Price Change |
Sold Properties
|
|---|---|---|---|
| 2025 | £254,170 | 2% |
47 Properties |
| 2024 | £248,766 | 5% |
57 Properties |
| 2023 | £237,306 | 2% |
49 Properties |
| 2022 | £232,284 | -1% |
67 Properties |
| 2021 | £234,548 | 15% |
103 Properties |
| 2020 | £199,097 | 1% |
63 Properties |
| 2019 | £197,405 | 7% |
90 Properties |
| 2018 | £184,359 | -1% |
82 Properties |
| 2017 | £186,351 | 18% |
67 Properties |
| 2016 | £153,105 | -11% |
82 Properties |
| 2015 | £170,362 | 6% |
88 Properties |
| 2014 | £159,666 | 10% |
91 Properties |
| 2013 | £142,989 | 4% |
62 Properties |
| 2012 | £137,209 | -6% |
55 Properties |
| 2011 | £145,488 | 5% |
48 Properties |
| 2010 | £138,252 | -6% |
59 Properties |
| 2009 | £146,321 | 4% |
60 Properties |
| 2008 | £139,808 | -15% |
39 Properties |
| 2007 | £160,820 | 8% |
79 Properties |
| 2006 | £148,706 | 3% |
80 Properties |
| 2005 | £143,955 | 7% |
58 Properties |
| 2004 | £133,870 | 14% |
85 Properties |
| 2003 | £115,515 | 15% |
100 Properties |
| 2002 | £98,673 | 17% |
108 Properties |
| 2001 | £82,063 | 16% |
89 Properties |
| 2000 | £68,593 | 11% |
96 Properties |
| 1999 | £61,118 | 8% |
99 Properties |
| 1998 | £56,170 | -1% |
86 Properties |
| 1997 | £56,579 | 22% |
83 Properties |
| 1996 | £44,069 | -18% |
106 Properties |
| 1995 | £51,910 | - |
73 Properties |
Property Price per Property Type in Sandiacre South
Here you can find historic sold price data in order to help with your property search.
The average Property Paid Price for specific property types in the last three years are:
| Property Type | Average Sold Price | Sold Properties |
|---|---|---|
| Semi Detached House | £211,503.00 | 67 Semi Detached Houses |
| Detached House | £307,353.00 | 65 Detached Houses |
| Terraced House | £179,447.00 | 19 Terraced Houses |
| Flat | £97,750.00 | 2 Flats |

