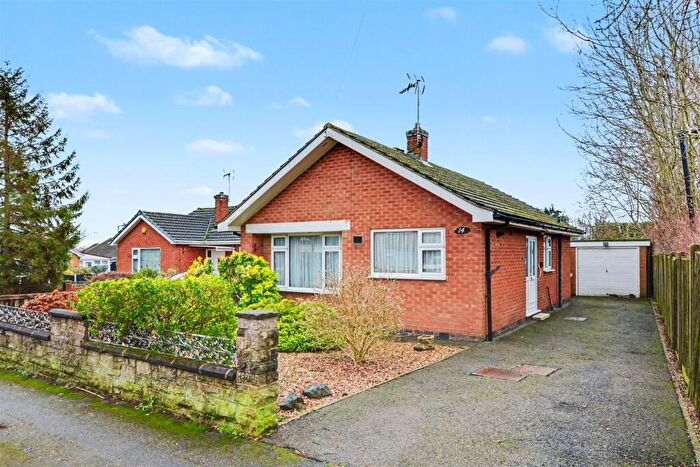
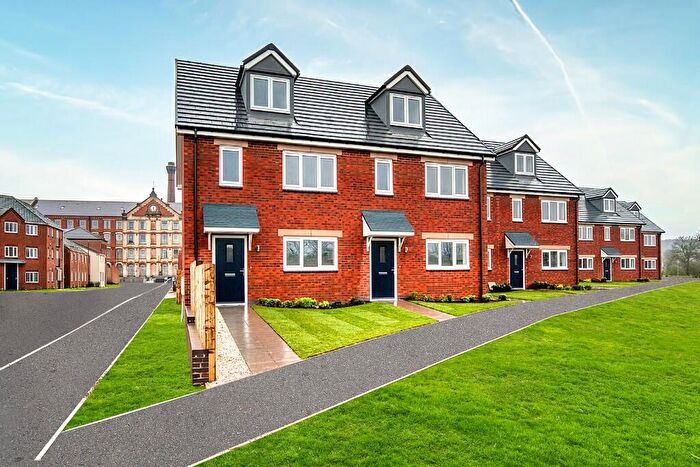
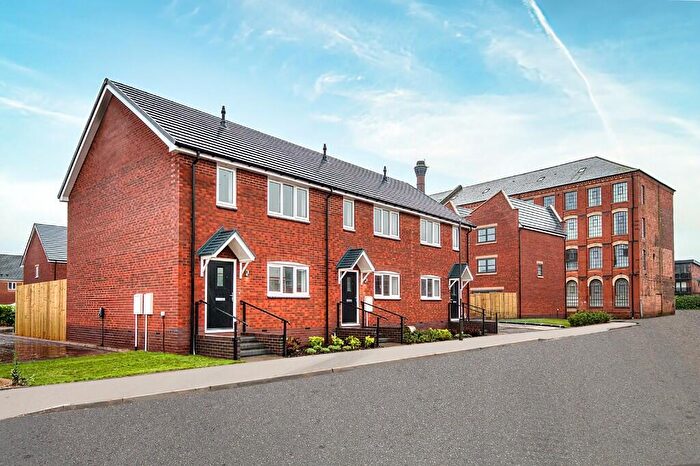
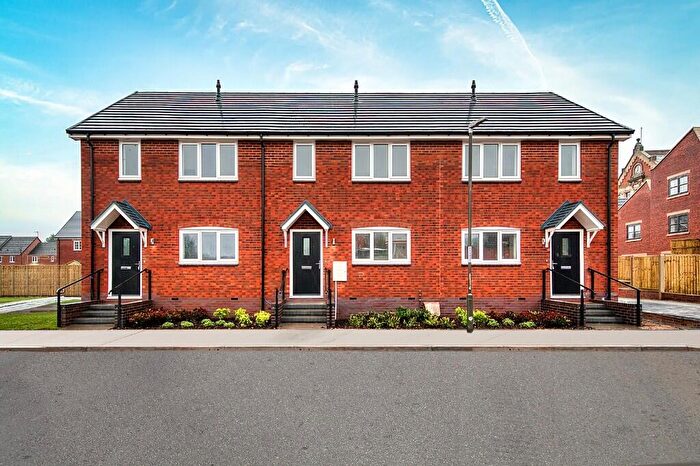
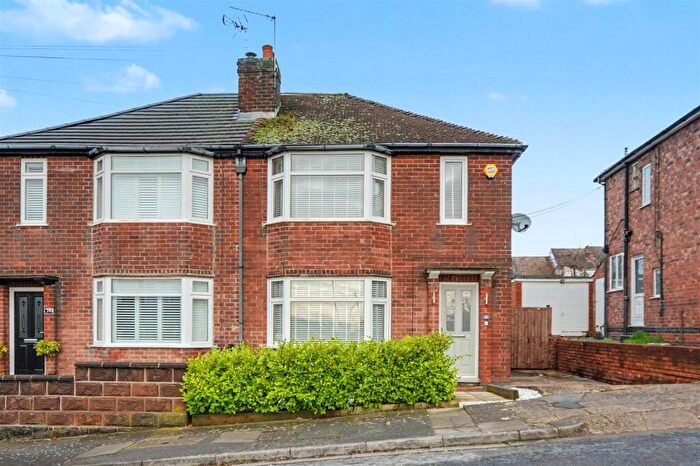
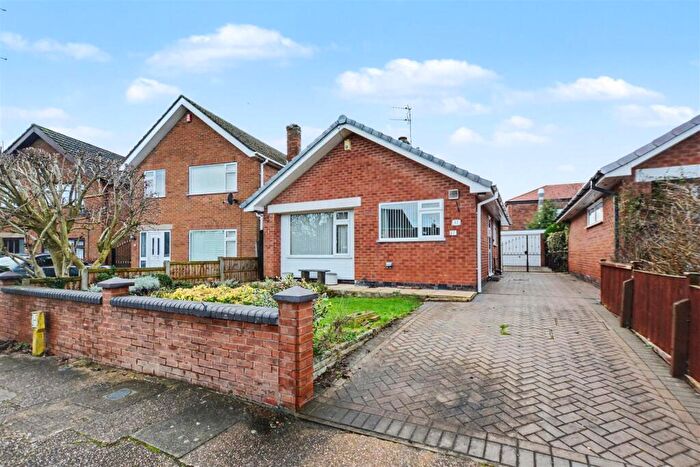
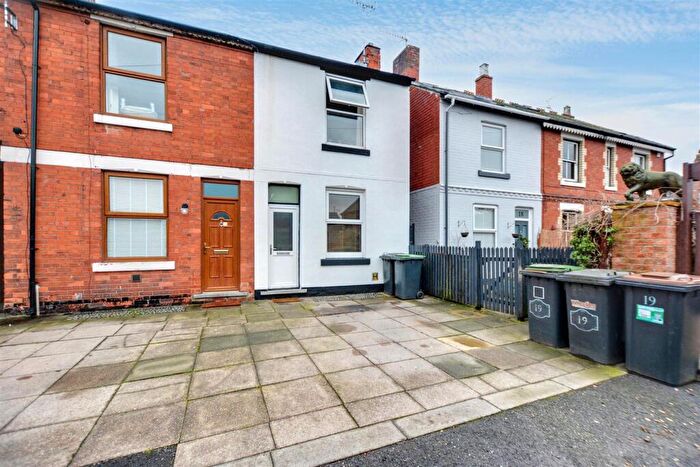
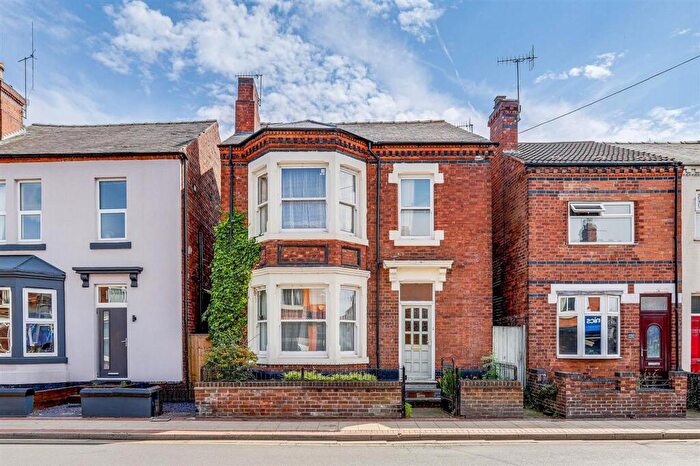
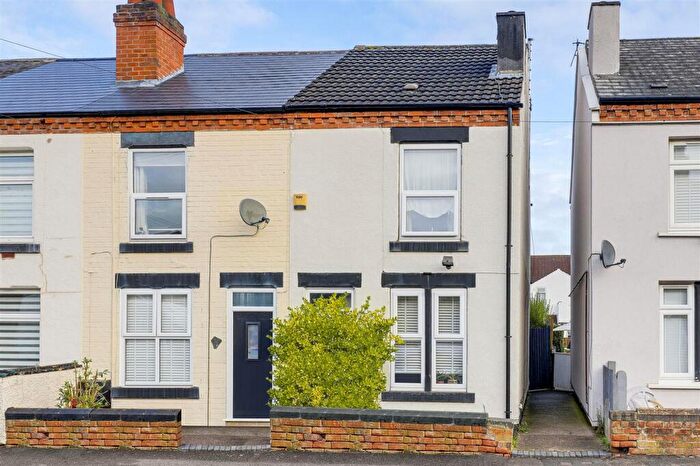
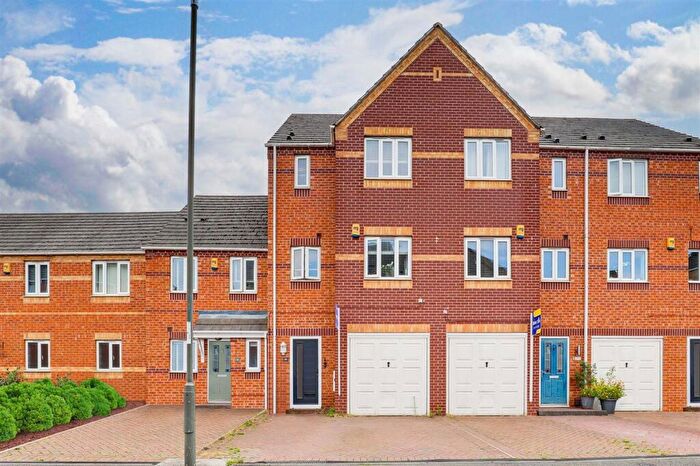
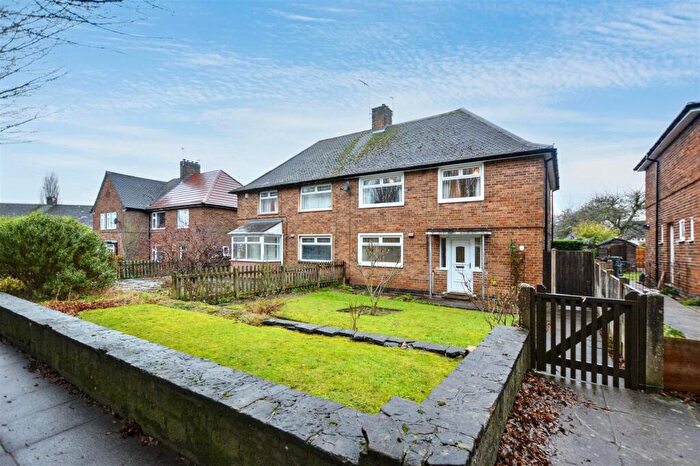
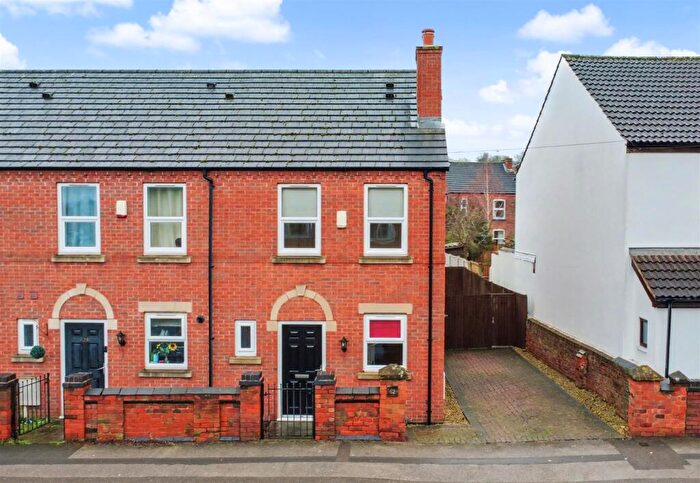
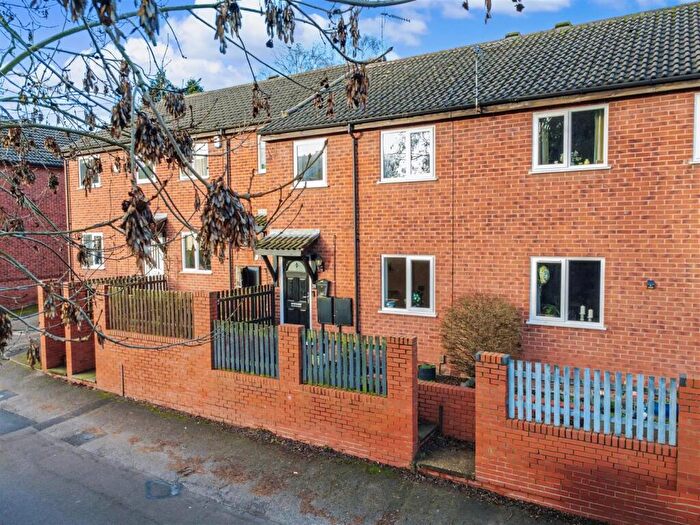
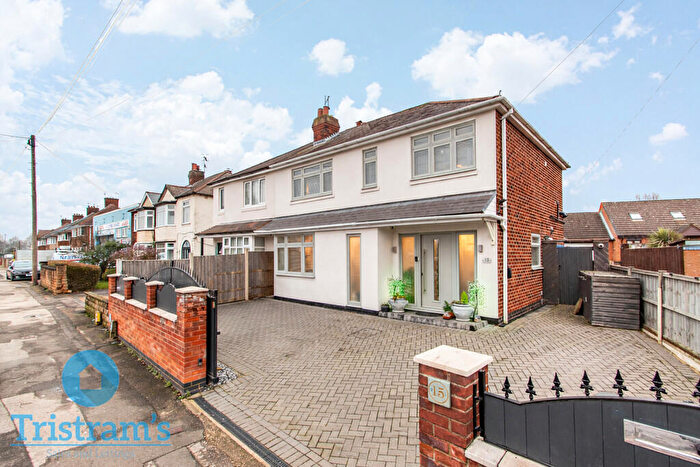
Houses for sale & to rent in Stapleford South West, Nottingham
House Prices in Stapleford South West
Properties in Stapleford South West have an average house price of £186,081.00 and had 260 Property Transactions within the last 3 years¹.
Stapleford South West is an area in Nottingham, Nottinghamshire with 2,334 households², where the most expensive property was sold for £440,000.00.
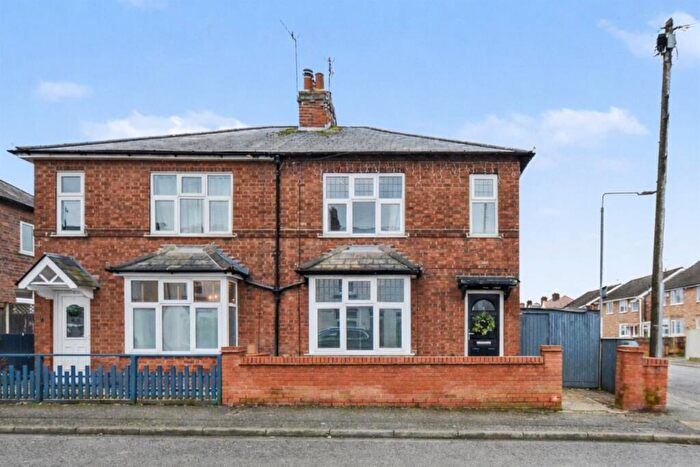
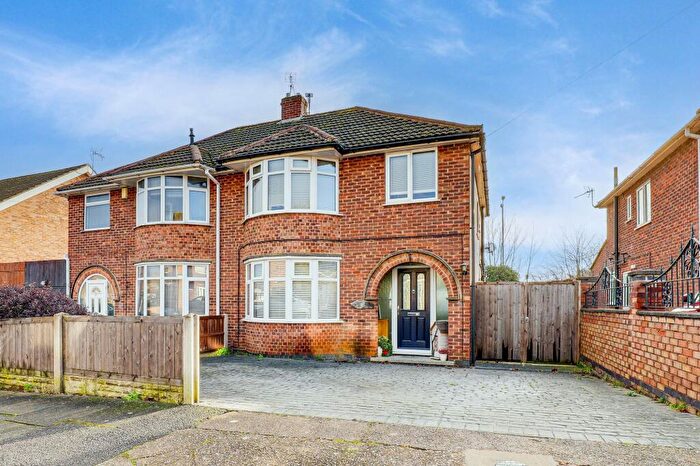
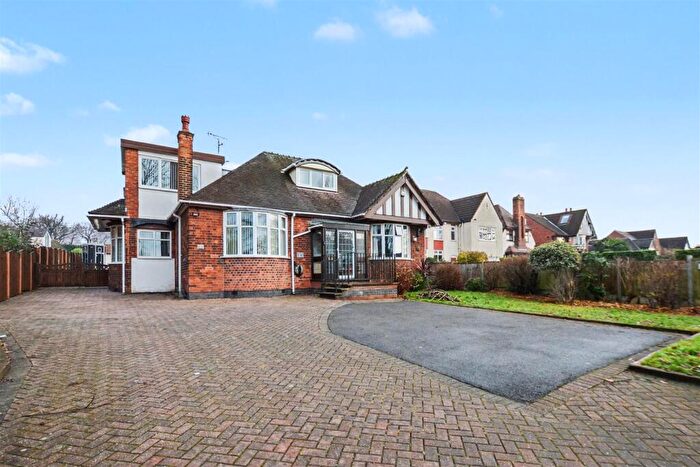
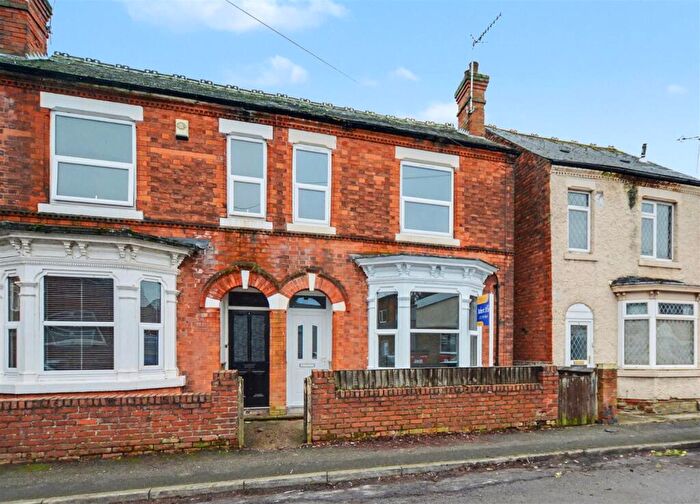
Properties for sale in Stapleford South West
Roads and Postcodes in Stapleford South West
Navigate through our locations to find the location of your next house in Stapleford South West, Nottingham for sale or to rent.
| Streets | Postcodes |
|---|---|
| Albert Avenue | NG9 8ET |
| Alexandra Street | NG9 7ED |
| Antill Street | NG9 7FT |
| Archer Road | NG9 7EP |
| Aria Court | NG9 7AJ |
| Arnside | NG9 7EY |
| Arthur Mee Road | NG9 7EW |
| Ash Grove | NG9 7GL |
| Bailey Street | NG9 7BD NG9 7BF |
| Balfour Road | NG9 7GA |
| Bessell Lane | NG9 7BX |
| Birley Street | NG9 7GE |
| Borlace Crescent | NG9 7EH |
| Bridgend Close | NG9 7BU |
| Broad Oak Drive | NG9 7AU NG9 7AX |
| Brookhill Street | NG9 7BQ NG9 7BS NG9 7GB NG9 7GD NG9 7GG NG9 7GJ NG9 7GN NG9 7GU NG9 7GH |
| Carnforth Close | NG9 7EZ |
| Church Lane | NG9 8GB |
| Church Street | NG9 8GA NG9 8HJ |
| Cyril Avenue | NG9 8FQ |
| Dalton Close | NG9 7FB |
| Deepdale Avenue | NG9 7FW |
| Derby Road | NG9 7AA NG9 7AB NG9 7AD NG9 7AN NG9 7AS NG9 7AY NG9 7AZ NG9 7BG NG9 7AE NG9 7AR |
| Eaton Road | NG9 7EE |
| Eatons Road | NG9 7EA NG9 7EB |
| Edward Street | NG9 8FH NG9 8FJ |
| Frederick Road | NG9 8FL NG9 8FN |
| Gibbons Avenue | NG9 7DQ NG9 7DR NG9 7DS |
| Halls Road | NG9 7FP NG9 7FQ NG9 7FS NG9 7FX |
| Harriett Street | NG9 8FG |
| Hawthorne Avenue | NG9 7GP |
| Horace Avenue | NG9 8FR |
| Isaacs Lane | NG9 8BT |
| Kelvin Close | NG9 7DF |
| Lawrence Street | NG9 7FU |
| Lime Grove | NG9 7GF |
| Linden Grove | NG9 7GQ |
| Lower Park Street | NG9 8EW |
| Midland Avenue | NG9 7BT |
| Mill Road | NG9 8GD |
| Moorland Avenue | NG9 7FY |
| Myrtle Avenue | NG9 7GR |
| New Eaton Road | NG9 7EF NG9 7EL NG9 7EN NG9 7ER |
| Newton Drive | NG9 7GS |
| Oakfield Road | NG9 8FE NG9 8FF NG9 8FP |
| Palmer Drive | NG9 7BW |
| Park Street | NG9 8EU |
| Plowman Court | NG9 7FN |
| Portland Crescent | NG9 7GT |
| Recreation Terrace | NG9 7FR |
| Rossell Drive | NG9 7EG NG9 7EJ |
| Sandiacre Road | NG9 8EX |
| Shanklin Drive | NG9 8EZ |
| Silverdale | NG9 7EX |
| St James Street | NG9 7BA |
| St James Terrace | NG9 7BB |
| The Mount | NG9 7DT |
| The Vista | NG9 7EQ NG9 7ES |
| Thorpe Close | NG9 8FB |
| Toton Lane | NG9 7HA |
| Tudor Court | NG9 7DZ |
| Victoria Street | NG9 7AP |
| Warren Arms Place | NG9 8BW |
| Warren Avenue | NG9 8EY NG9 8FD |
| Wellington Street | NG9 7BE |
| Wellspring Dale | NG9 7ET NG9 7EU |
| West End Street | NG9 7DA |
| William Road | NG9 8ES |
| Willow Avenue | NG9 7FZ |
Transport near Stapleford South West
- FAQ
- Price Paid By Year
- Property Type Price
Frequently asked questions about Stapleford South West
What is the average price for a property for sale in Stapleford South West?
The average price for a property for sale in Stapleford South West is £186,081. This amount is 34% lower than the average price in Nottingham. There are 1,205 property listings for sale in Stapleford South West.
What streets have the most expensive properties for sale in Stapleford South West?
The streets with the most expensive properties for sale in Stapleford South West are Moorland Avenue at an average of £275,000, Dalton Close at an average of £270,000 and Silverdale at an average of £260,566.
What streets have the most affordable properties for sale in Stapleford South West?
The streets with the most affordable properties for sale in Stapleford South West are Church Street at an average of £115,000, Antill Street at an average of £122,050 and The Mount at an average of £124,500.
Which train stations are available in or near Stapleford South West?
Some of the train stations available in or near Stapleford South West are Attenborough, Long Eaton and Beeston.
Property Price Paid in Stapleford South West by Year
The average sold property price by year was:
| Year | Average Sold Price | Price Change |
Sold Properties
|
|---|---|---|---|
| 2025 | £192,563 | 6% |
74 Properties |
| 2024 | £181,898 | -2% |
95 Properties |
| 2023 | £185,177 | -0,3% |
91 Properties |
| 2022 | £185,778 | 6% |
115 Properties |
| 2021 | £174,020 | 11% |
130 Properties |
| 2020 | £155,308 | 2% |
86 Properties |
| 2019 | £151,725 | 9% |
119 Properties |
| 2018 | £138,615 | 7% |
119 Properties |
| 2017 | £129,293 | -63% |
114 Properties |
| 2016 | £210,569 | 43% |
130 Properties |
| 2015 | £120,123 | 9% |
115 Properties |
| 2014 | £109,530 | 4% |
108 Properties |
| 2013 | £104,919 | -2% |
80 Properties |
| 2012 | £107,360 | -6% |
72 Properties |
| 2011 | £114,248 | 6% |
77 Properties |
| 2010 | £107,239 | 5% |
82 Properties |
| 2009 | £101,530 | -14% |
73 Properties |
| 2008 | £115,881 | -3% |
61 Properties |
| 2007 | £118,983 | 2% |
132 Properties |
| 2006 | £116,033 | 7% |
143 Properties |
| 2005 | £107,484 | 1% |
100 Properties |
| 2004 | £106,005 | 18% |
171 Properties |
| 2003 | £86,406 | 22% |
128 Properties |
| 2002 | £67,196 | 21% |
170 Properties |
| 2001 | £52,978 | 18% |
151 Properties |
| 2000 | £43,502 | 1% |
149 Properties |
| 1999 | £43,048 | 9% |
134 Properties |
| 1998 | £39,042 | 3% |
127 Properties |
| 1997 | £37,935 | 14% |
139 Properties |
| 1996 | £32,575 | -7% |
125 Properties |
| 1995 | £34,840 | - |
95 Properties |
Property Price per Property Type in Stapleford South West
Here you can find historic sold price data in order to help with your property search.
The average Property Paid Price for specific property types in the last three years are:
| Property Type | Average Sold Price | Sold Properties |
|---|---|---|
| Semi Detached House | £197,018.00 | 110 Semi Detached Houses |
| Detached House | £244,485.00 | 41 Detached Houses |
| Terraced House | £158,002.00 | 98 Terraced Houses |
| Flat | £109,181.00 | 11 Flats |

