
Houses for sale & to rent in NG10 3TD, Spire View, Sawley, Nottingham
House Prices in NG10 3TD, Spire View, Sawley
Properties in NG10 3TD have no sales history available within the last 3 years. NG10 3TD is a postcode in Spire View located in Sawley, an area in Nottingham, Derbyshire, with 4 households².
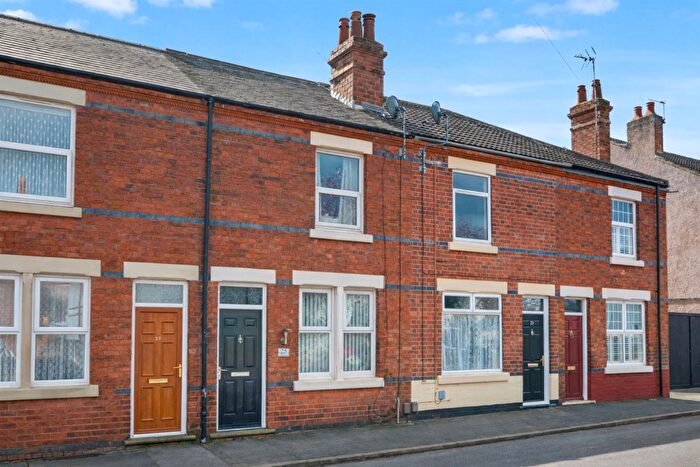
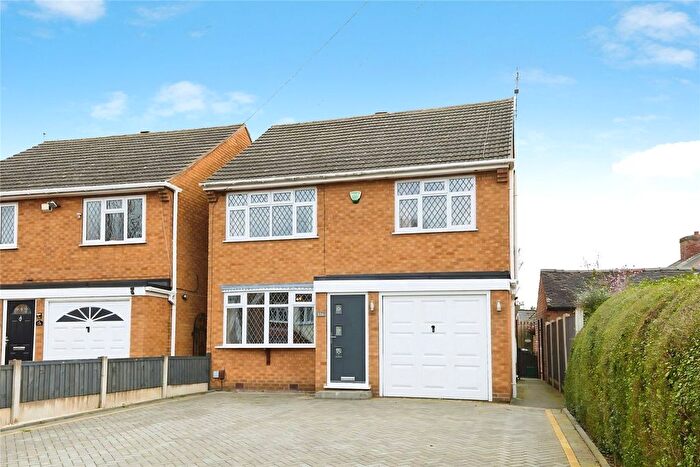
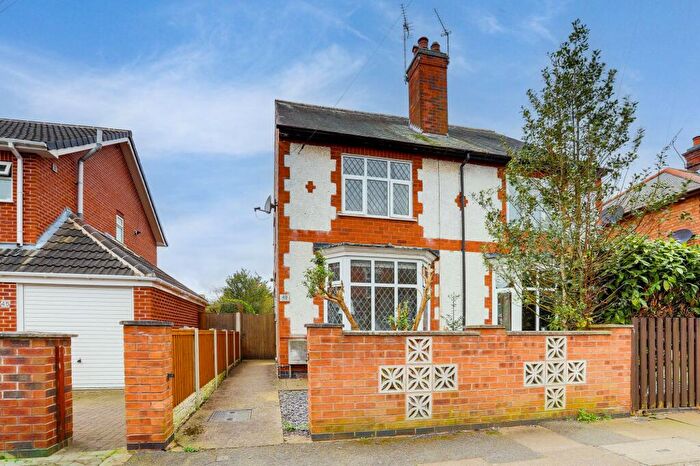
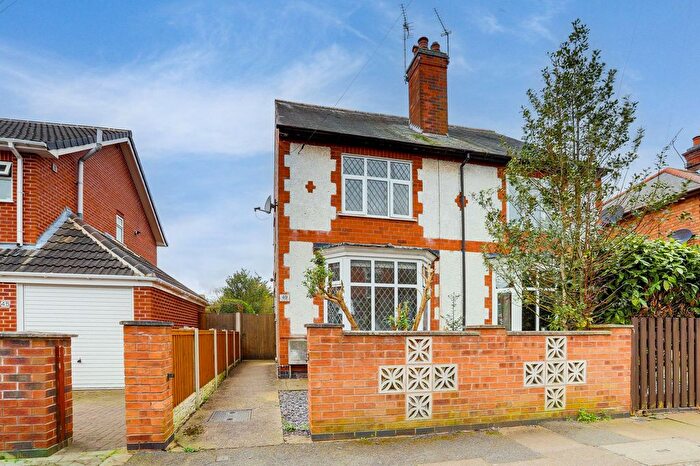
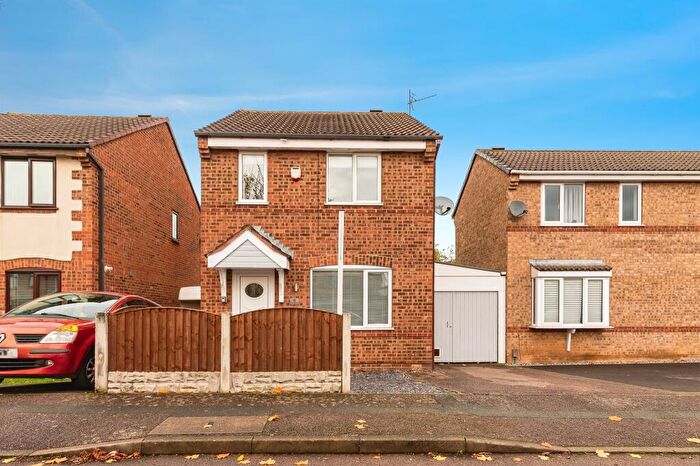
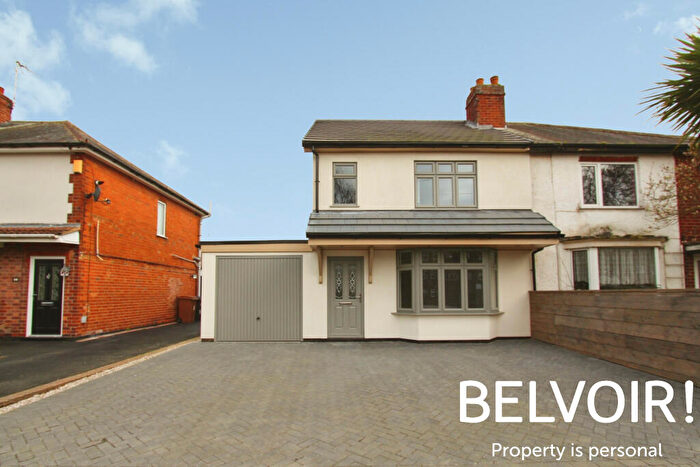
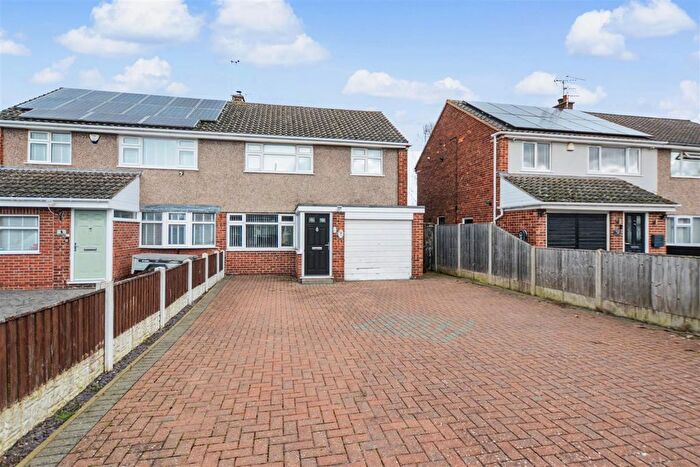
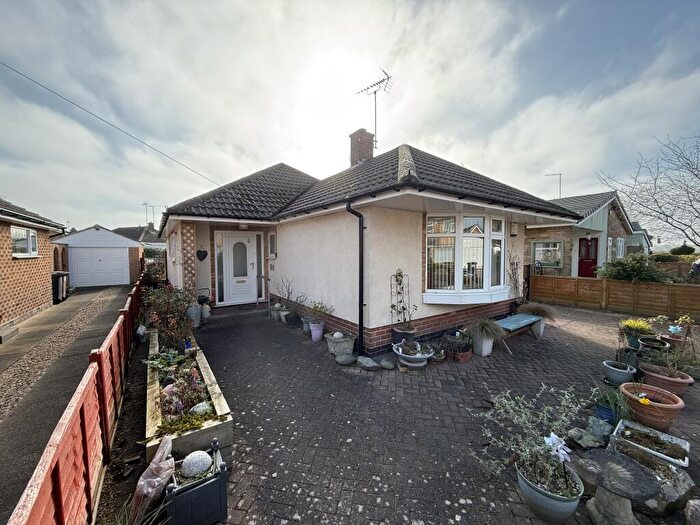
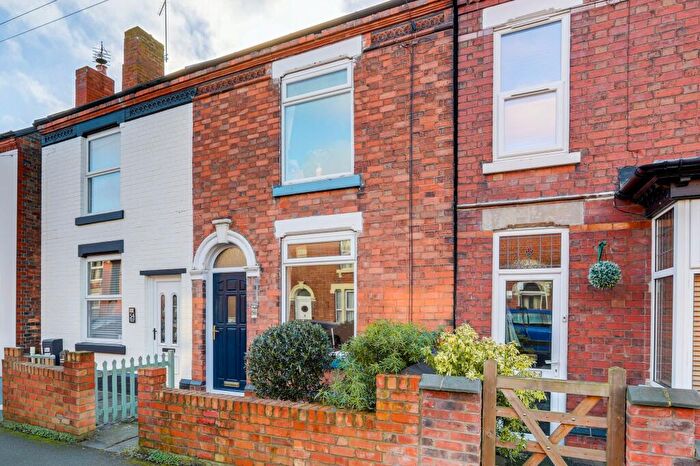
Properties for sale near NG10 3TD, Spire View

![]()
If you are looking to sell your house, let it out, or receive a property valuation, an expert can help you.
Click the button below to get started.


Price Paid in Spire View, NG10 3TD, Sawley
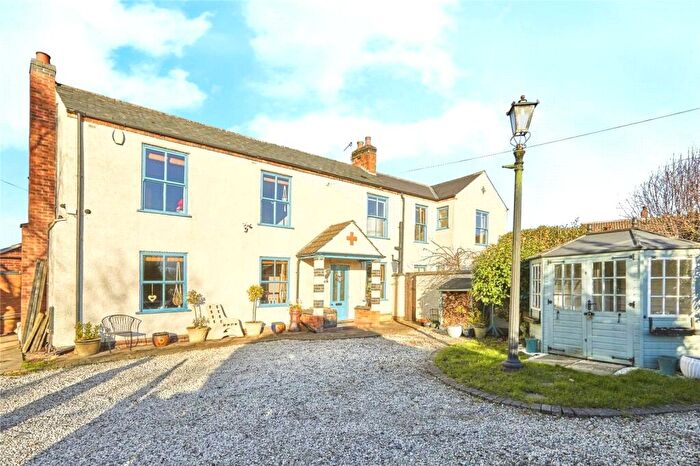
3 Spire View, NG10 3TD, Sawley Nottingham
Property 3 has been sold 2 times. The last time it was sold was in 27/10/2017 and the sold price was £325,000.00.
This detached house, sold as a freehold on 27/10/2017, is a 115 sqm detached house with an EPC rating of C.
| Date | Price | Property Type | Tenure | Classification |
|---|---|---|---|---|
| 27/10/2017 | £325,000.00 | Detached House | freehold | Established Building |
| 01/02/2008 | £275,000.00 | Detached House | freehold | New Build |
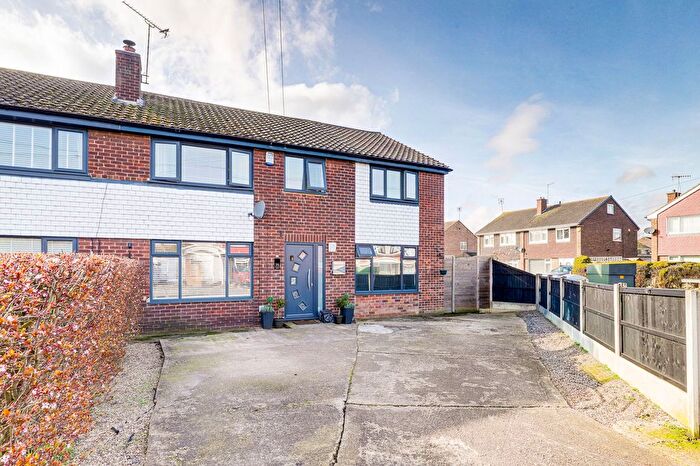
4 Spire View, NG10 3TD, Sawley Nottingham
Property 4 has been sold 1 time. The last time it was sold was in 26/06/2009 and the sold price was £210,000.00.
This detached house, sold as a freehold on 26/06/2009, is a 132 sqm detached house with an EPC rating of C.
| Date | Price | Property Type | Tenure | Classification |
|---|---|---|---|---|
| 26/06/2009 | £210,000.00 | Detached House | freehold | Established Building |
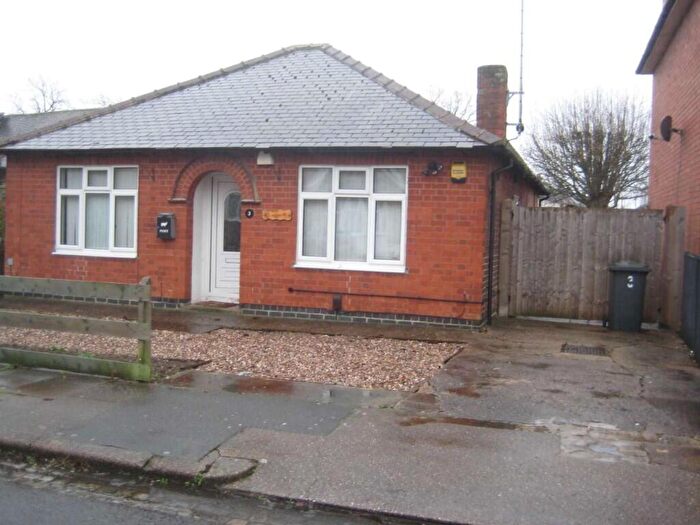
1 Spire View, NG10 3TD, Sawley Nottingham
Property 1 has been sold 1 time. The last time it was sold was in 12/05/2008 and the sold price was £245,000.00.
This semi detached house, sold as a freehold on 12/05/2008, is a 82 sqm detached bungalow with an EPC rating of C.
| Date | Price | Property Type | Tenure | Classification |
|---|---|---|---|---|
| 12/05/2008 | £245,000.00 | Semi Detached House | freehold | Established Building |
Transport near NG10 3TD, Spire View

House price paid reports for NG10 3TD, Spire View
Click on the buttons below to see price paid reports by year or property price:
- Price Paid By Year
Property Price Paid in NG10 3TD, Spire View by Year
The average sold property price by year was:
| Year | Average Sold Price | Price Change |
Sold Properties
|
|---|---|---|---|
| 2017 | £325,000 | 35% |
1 Property |
| 2009 | £210,000 | -24% |
1 Property |
| 2008 | £260,000 | - |
2 Properties |