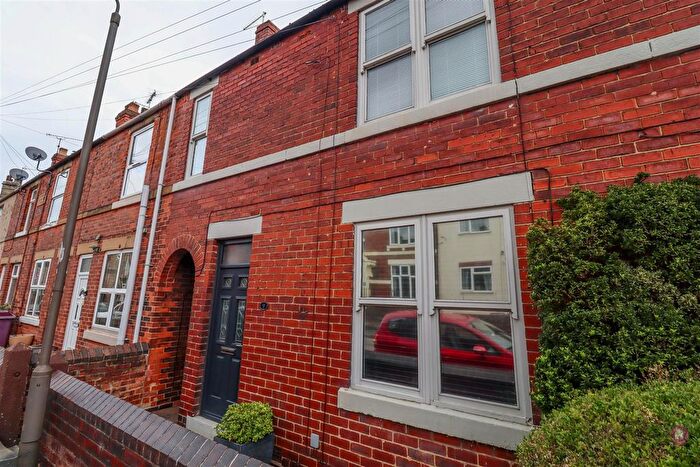
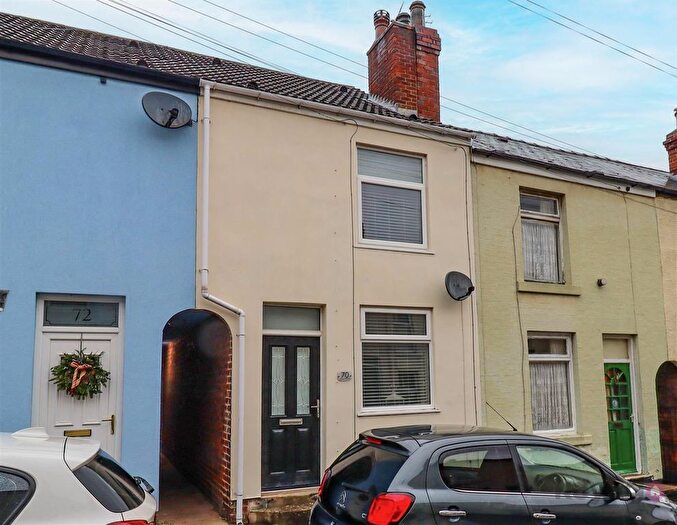
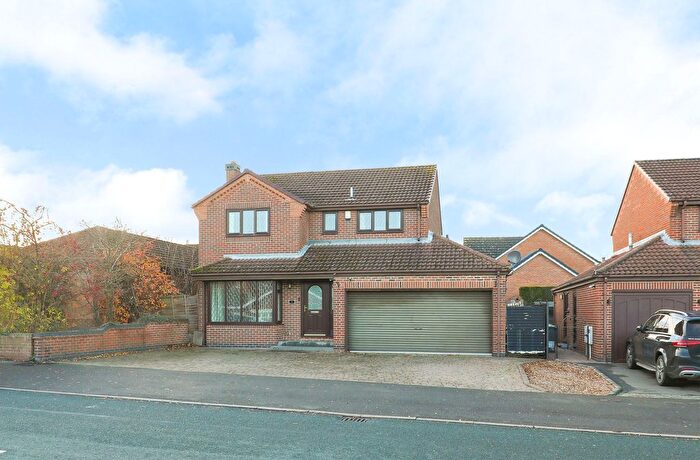
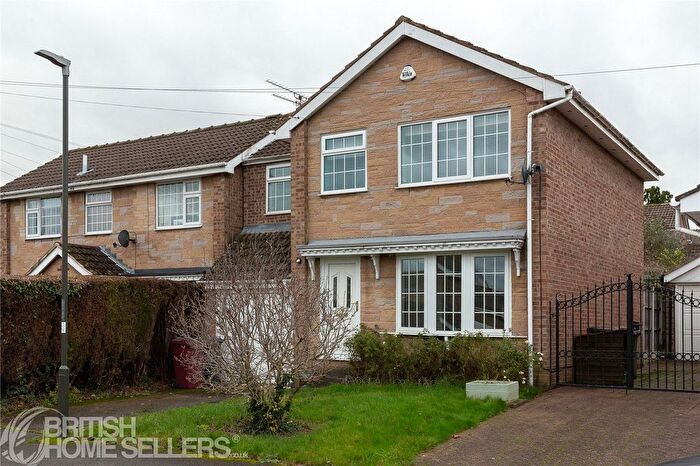
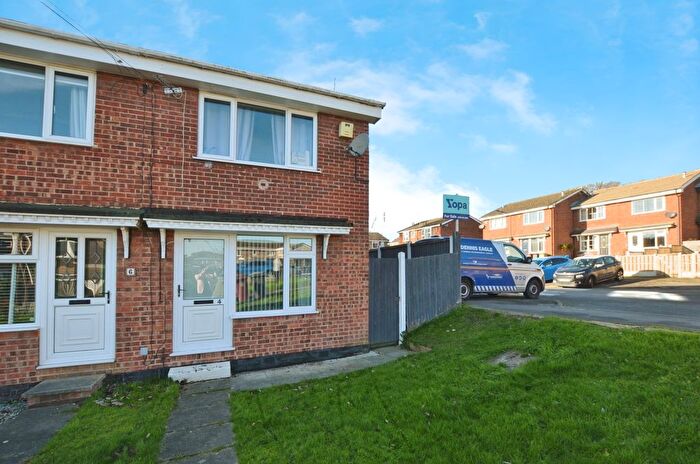
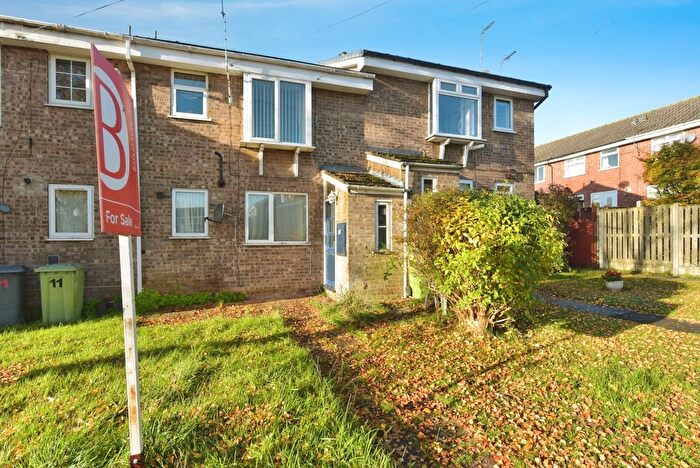
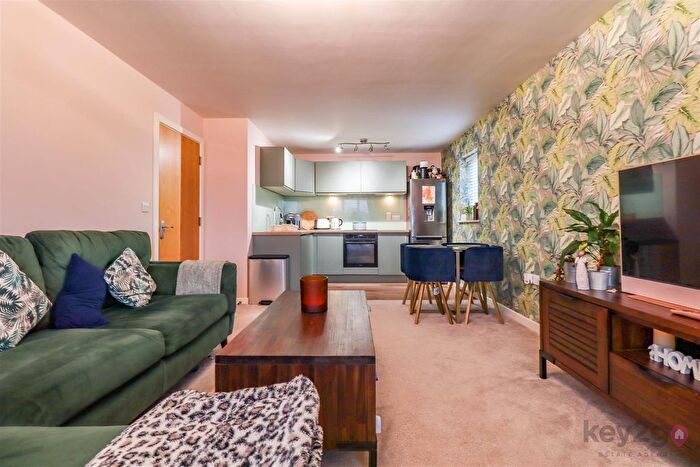
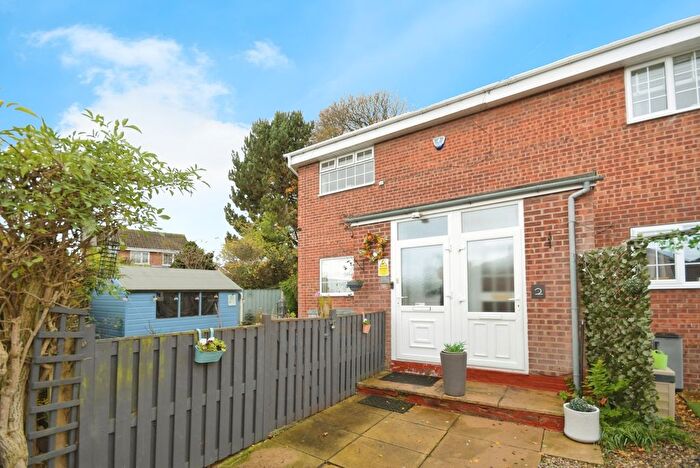
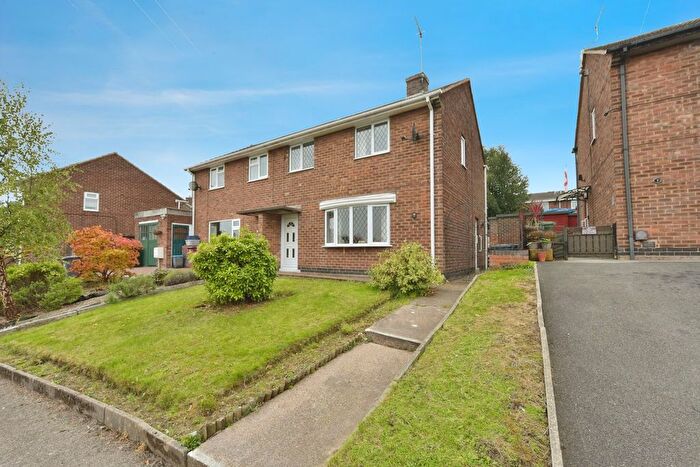
Houses for sale & to rent in Eckington North, Sheffield
House Prices in Eckington North
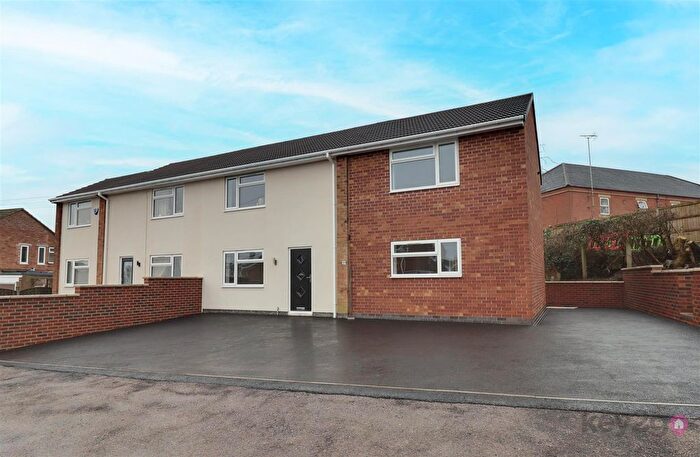
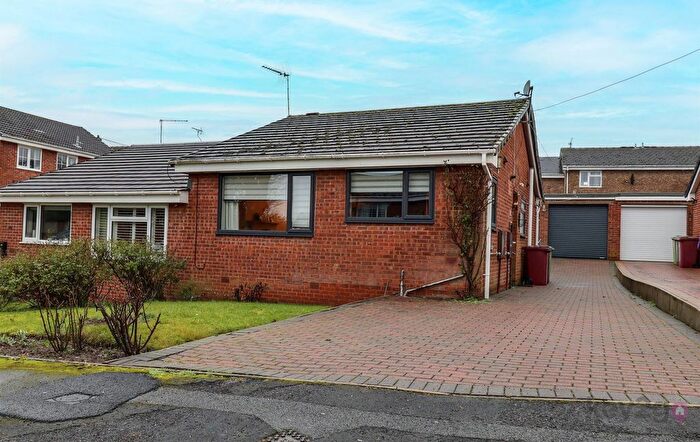
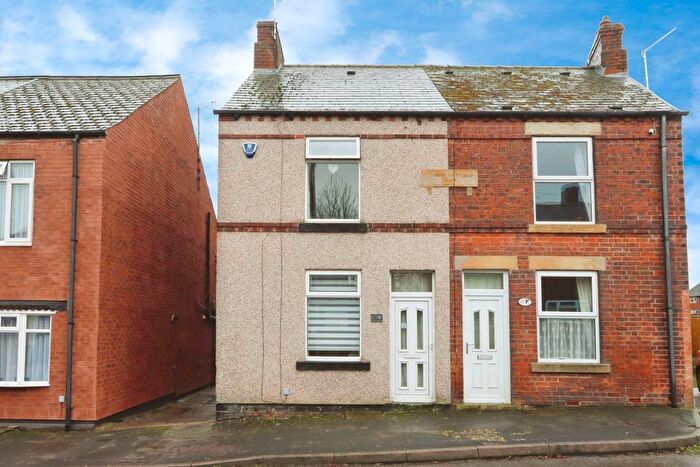
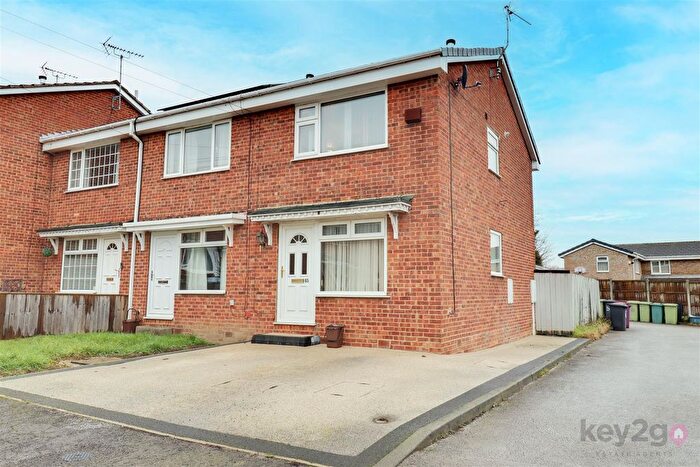
Properties in Eckington North have an average house price of £209,905.00 and had 159 Property Transactions within the last 3 years¹.
Eckington North is an area in Sheffield, Derbyshire with 1,601 households², where the most expensive property was sold for £900,000.00.
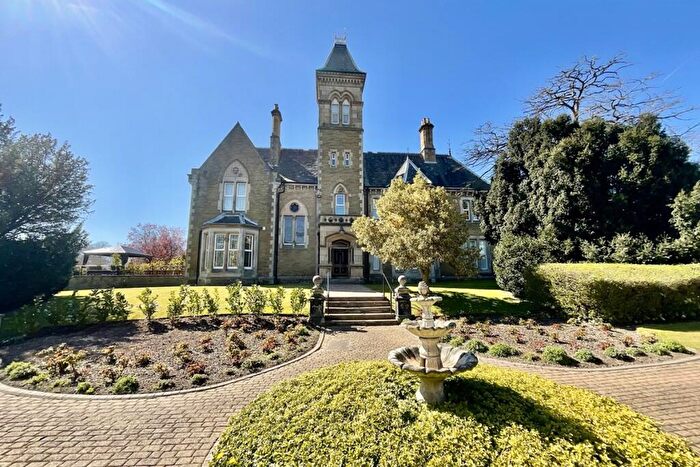
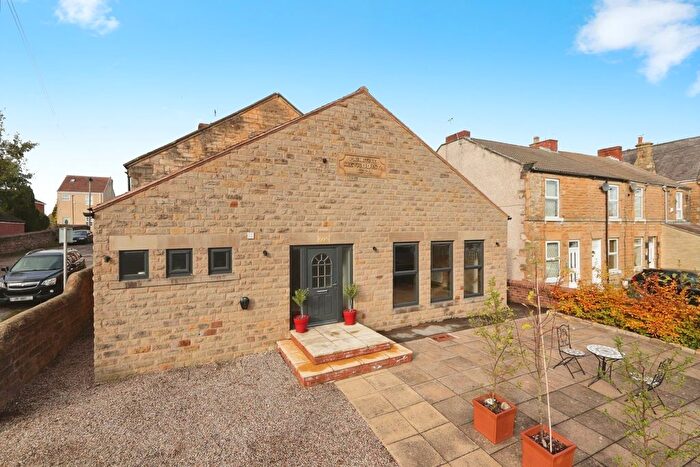
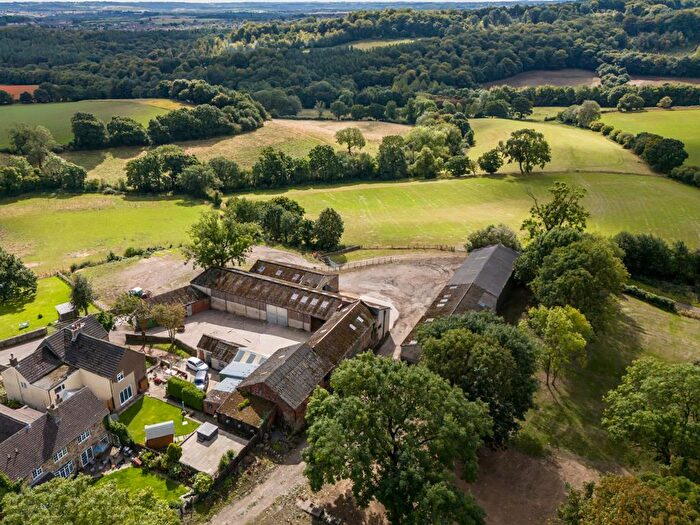
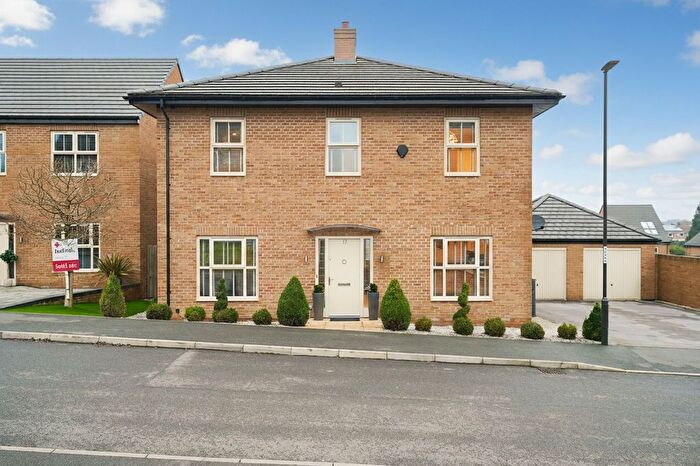
Properties for sale in Eckington North
Previously listed properties in Eckington North
Roads and Postcodes in Eckington North
Navigate through our locations to find the location of your next house in Eckington North, Sheffield for sale or to rent.
| Streets | Postcodes |
|---|---|
| Aintree Avenue | S21 4JA |
| Ashmore Avenue | S21 4AH |
| Back Lane | S21 4AL |
| Berry Avenue | S21 4AR |
| Billam Street | S21 4AS |
| Bolehill Lane | S21 4AT |
| Broomhill Close | S21 4GZ |
| Camms Close | S21 4AU |
| Cary Road | S21 4AW |
| Castle Hill | S21 4AX S21 4AY |
| Castle Hill Close | S21 4BJ |
| Castle View | S21 4AZ |
| Chesterfield Road | S21 4BD |
| Church Street | S21 4BH |
| Curlew Avenue | S21 4HR |
| Darcy Road | S21 4BN S21 4BP |
| Dronfield Road | S21 4BQ S21 4BR S21 4GN |
| Fenton Street | S21 4BX |
| Fern Close | S21 4HE |
| Fern Way | S21 4HF |
| Fernbank Drive | S21 4HG |
| Green Chase | S21 4GY |
| Greenfields | S21 4GW |
| Greenhall Road | S21 4GX |
| Hawksway | S21 4HP |
| Hayfield View | S21 4GU |
| High Street | S21 4DN S21 4DQ S21 4DR S21 4JT |
| Highwood Place | S21 4GP |
| Hunsdon | S21 4GG |
| Idas Road | S21 4DT |
| Kestrel Drive | S21 4HS |
| Lady Bank View | S21 4DZ |
| Market Street | S21 4EH S21 4JH |
| Marsh View | S21 4EL |
| Martin Court | S21 4HJ |
| Martin Rise | S21 4HH |
| Mill Road | S21 4EP |
| Oak View | S21 4LS |
| Osmund Road | S21 4ES S21 4ET |
| Partridge Close | S21 4HQ |
| Pasture Grove | S21 4GT |
| Pinfold Street | S21 4EX |
| Randall Street | S21 4FF |
| Ravencar Road | S21 4JE S21 4JL S21 4JN S21 4JR S21 4JS S21 4JZ |
| Rotherham Road | S21 4FH |
| Rotherside Road | S21 4HL S21 4LN |
| Sandown Close | S21 4HT |
| School Street | S21 4FL |
| Sheffield Road | S21 4FP |
| Sitwell Street | S21 4FR |
| Springfield Close | S21 4GS |
| Staniforth Avenue | S21 4GQ S21 4GR |
| Stead Mews | S21 4YF |
| Stead Street | S21 4FY |
| Watermeade | S21 4HZ |
| West Street | S21 4JW S21 4LE |
| White Hart Corner | S21 4DY |
| Windmill Greenway | S21 4LP |
| Wulfric Road | S21 4GE |
Transport near Eckington North
- FAQ
- Price Paid By Year
- Property Type Price
Frequently asked questions about Eckington North
What is the average price for a property for sale in Eckington North?
The average price for a property for sale in Eckington North is £209,905. This amount is 5% lower than the average price in Sheffield. There are 410 property listings for sale in Eckington North.
What streets have the most expensive properties for sale in Eckington North?
The streets with the most expensive properties for sale in Eckington North are Church Street at an average of £495,000, White Hart Corner at an average of £485,000 and Aintree Avenue at an average of £390,000.
What streets have the most affordable properties for sale in Eckington North?
The streets with the most affordable properties for sale in Eckington North are Castle Hill at an average of £88,666, Berry Avenue at an average of £116,468 and Randall Street at an average of £118,000.
Which train stations are available in or near Eckington North?
Some of the train stations available in or near Eckington North are Woodhouse, Dronfield and Kiveton Bridge.
Property Price Paid in Eckington North by Year
The average sold property price by year was:
| Year | Average Sold Price | Price Change |
Sold Properties
|
|---|---|---|---|
| 2025 | £214,318 | 6% |
44 Properties |
| 2024 | £202,034 | -7% |
64 Properties |
| 2023 | £215,975 | 5% |
51 Properties |
| 2022 | £204,165 | -29% |
55 Properties |
| 2021 | £263,533 | 28% |
80 Properties |
| 2020 | £190,650 | 12% |
55 Properties |
| 2019 | £166,989 | -4% |
53 Properties |
| 2018 | £174,096 | 11% |
54 Properties |
| 2017 | £154,241 | -4% |
59 Properties |
| 2016 | £160,579 | 7% |
62 Properties |
| 2015 | £149,467 | -5% |
47 Properties |
| 2014 | £156,205 | 21% |
59 Properties |
| 2013 | £123,154 | -9% |
47 Properties |
| 2012 | £134,258 | 13% |
31 Properties |
| 2011 | £116,570 | -25% |
22 Properties |
| 2010 | £145,886 | 12% |
48 Properties |
| 2009 | £127,710 | -10% |
31 Properties |
| 2008 | £140,556 | 3% |
39 Properties |
| 2007 | £136,396 | 12% |
76 Properties |
| 2006 | £120,499 | 1% |
91 Properties |
| 2005 | £119,547 | -3% |
69 Properties |
| 2004 | £122,654 | 34% |
81 Properties |
| 2003 | £81,148 | 10% |
84 Properties |
| 2002 | £72,774 | 17% |
118 Properties |
| 2001 | £60,713 | 10% |
88 Properties |
| 2000 | £54,733 | 4% |
76 Properties |
| 1999 | £52,585 | 10% |
77 Properties |
| 1998 | £47,459 | 10% |
65 Properties |
| 1997 | £42,615 | -6% |
77 Properties |
| 1996 | £44,973 | 11% |
80 Properties |
| 1995 | £39,933 | - |
55 Properties |
Property Price per Property Type in Eckington North
Here you can find historic sold price data in order to help with your property search.
The average Property Paid Price for specific property types in the last three years are:
| Property Type | Average Sold Price | Sold Properties |
|---|---|---|
| Semi Detached House | £197,323.00 | 57 Semi Detached Houses |
| Detached House | £282,362.00 | 58 Detached Houses |
| Terraced House | £139,796.00 | 32 Terraced Houses |
| Flat | £106,416.00 | 12 Flats |

