
Houses for sale in Unstone, Sheffield
House Prices in Unstone
Properties in Unstone have an average house price of £653k and had 4 Property Transactions within the last 3 years¹.
Unstone is an area in Sheffield, Derbyshire with 68 households², where the most expensive property was sold for £970k.
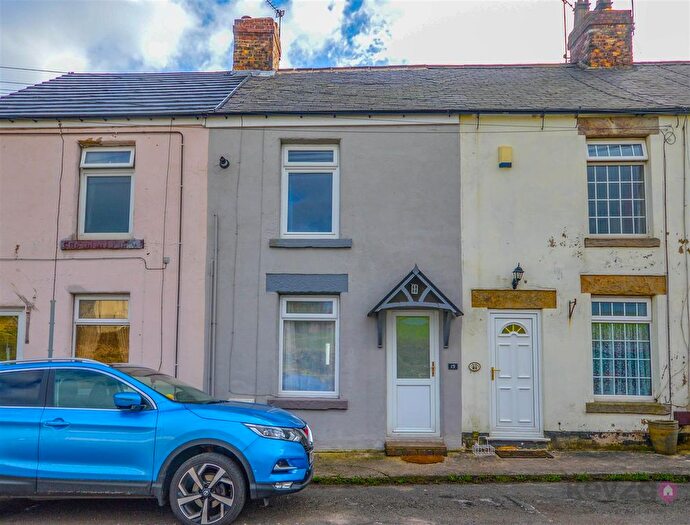
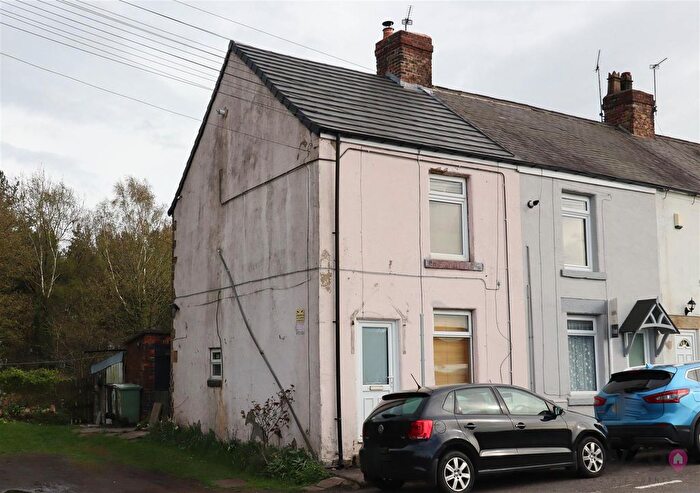
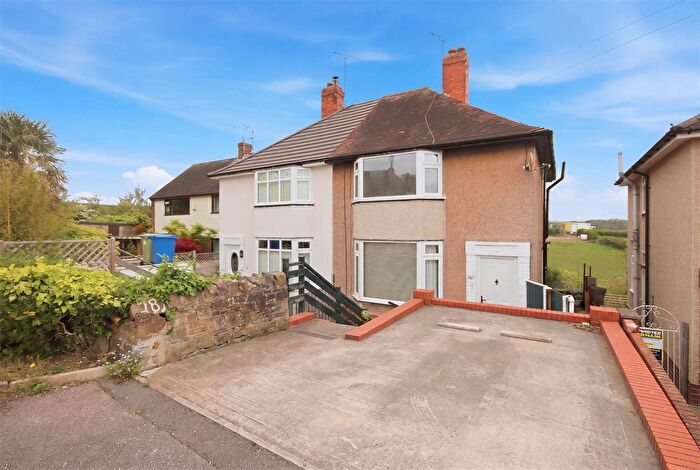
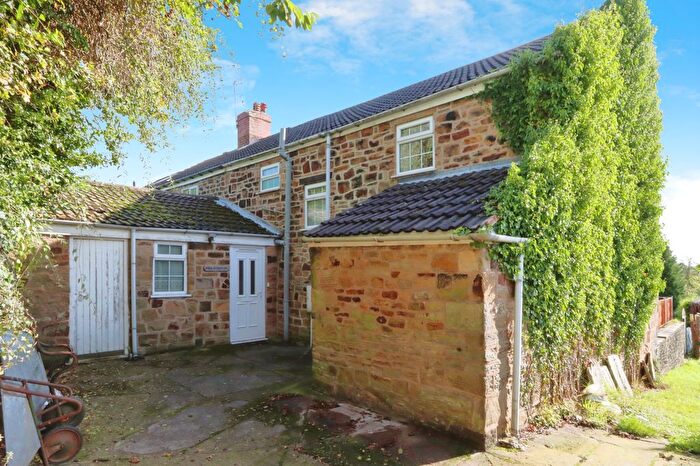
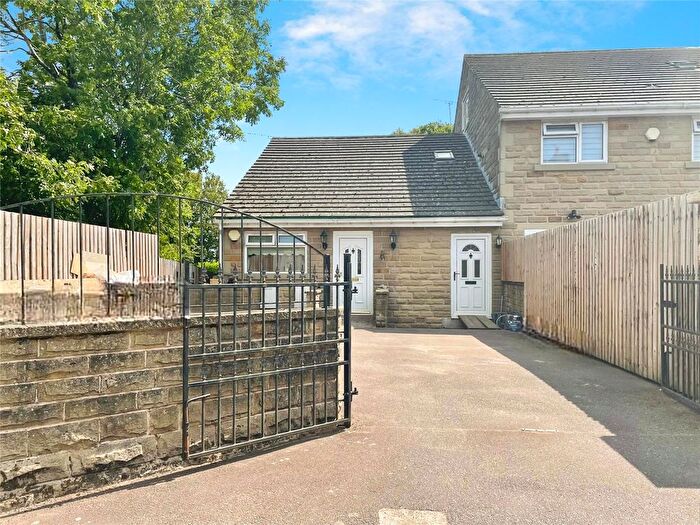
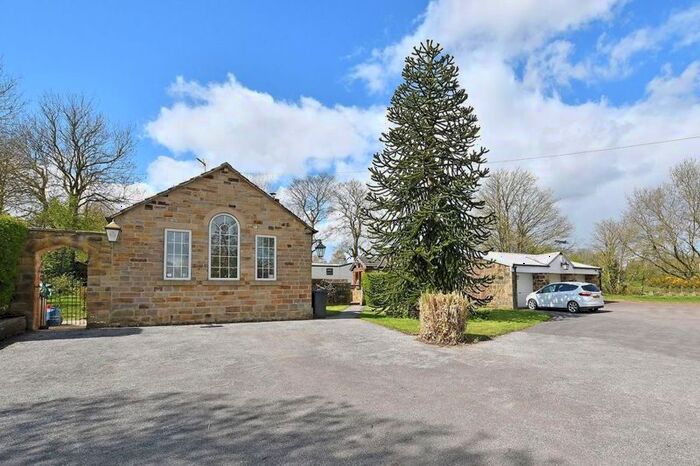
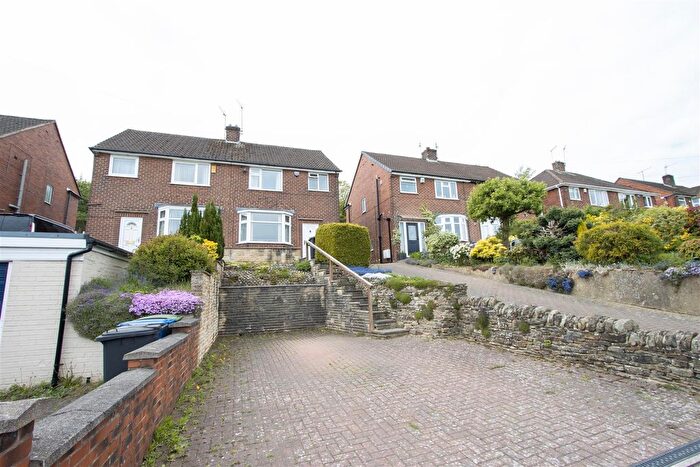
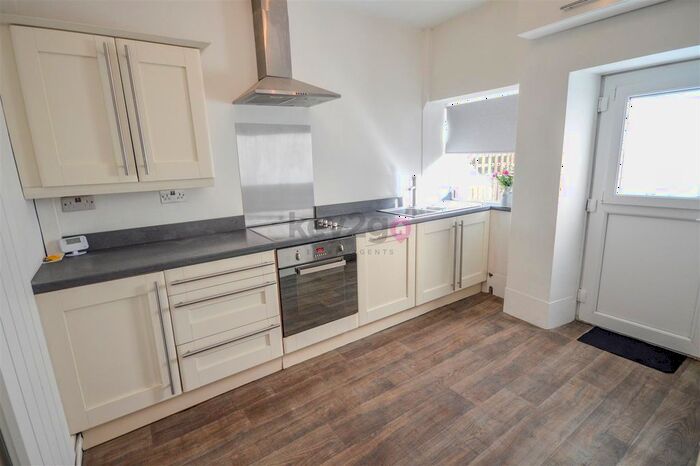
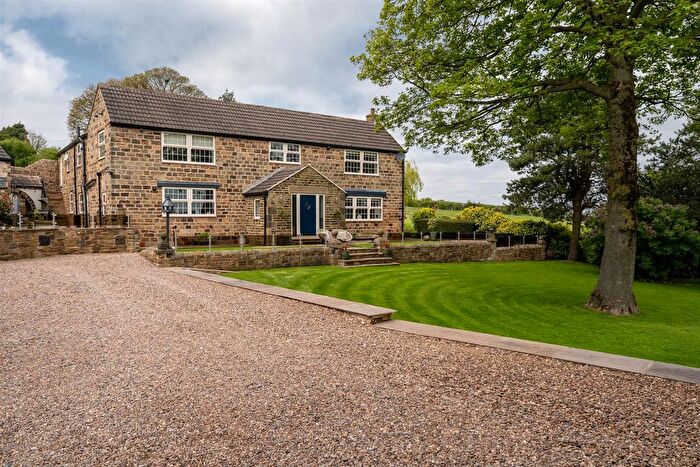
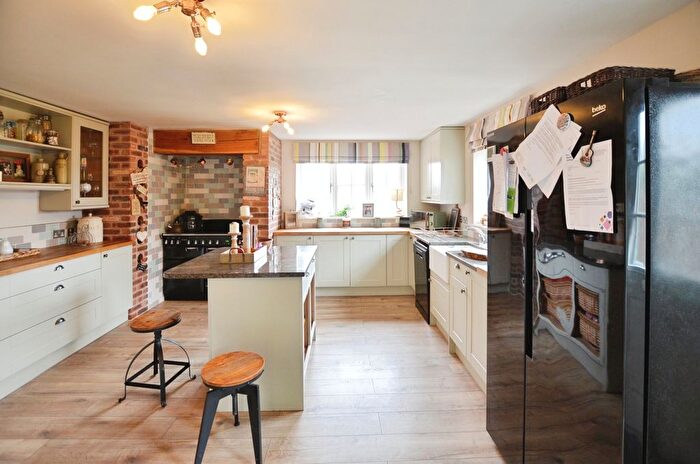
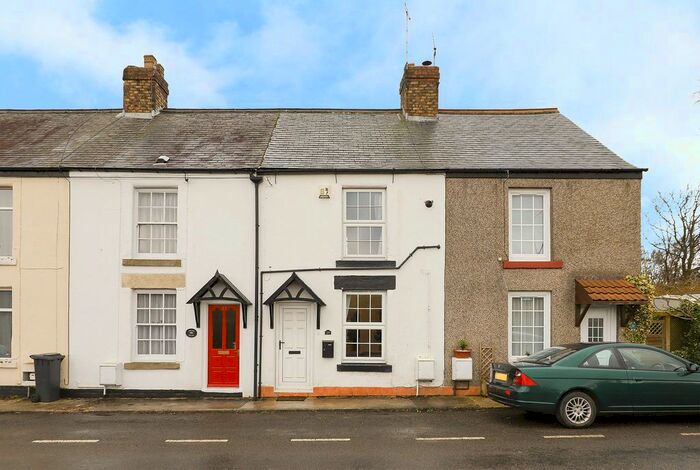
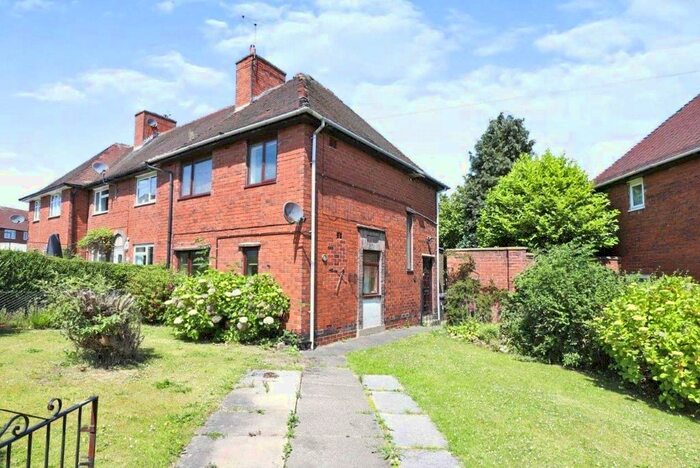
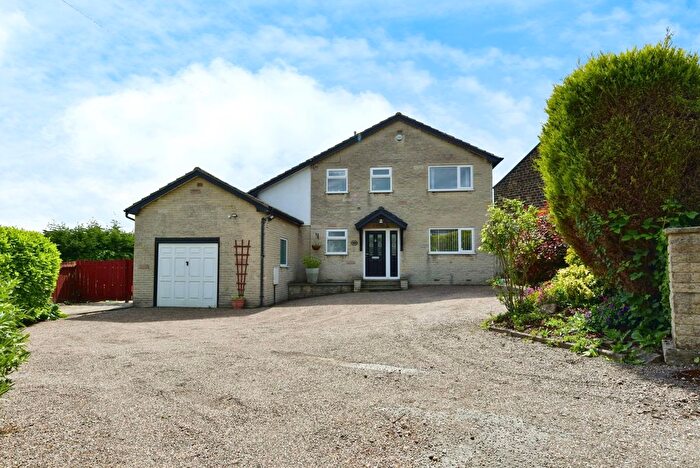
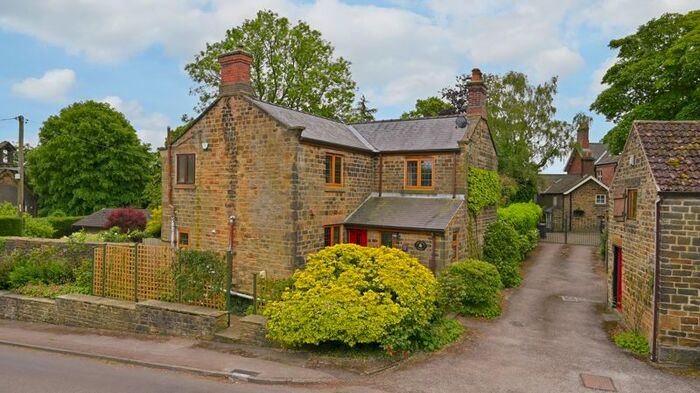
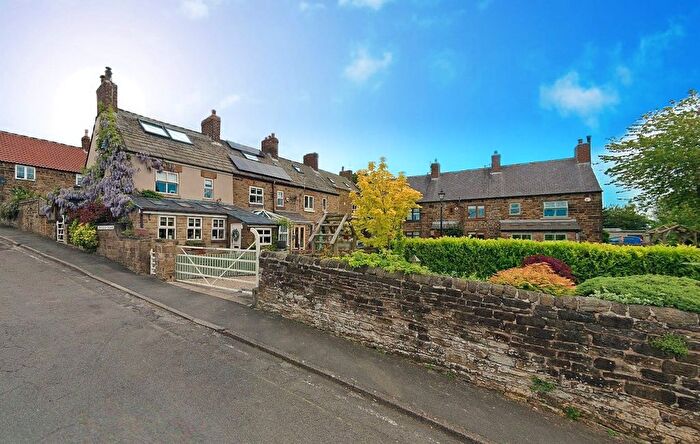
Properties for sale in Unstone
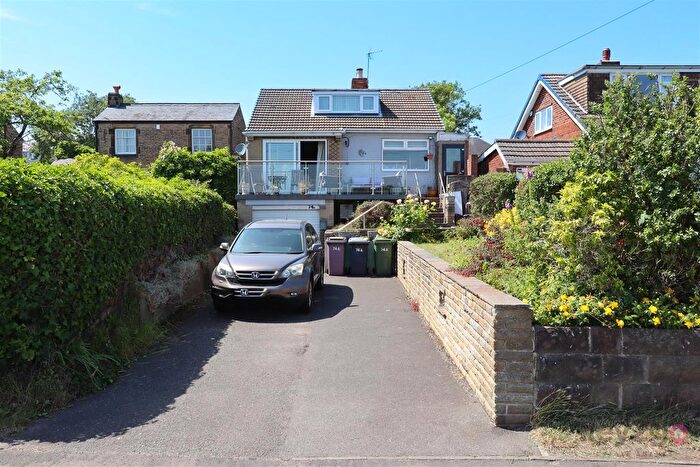

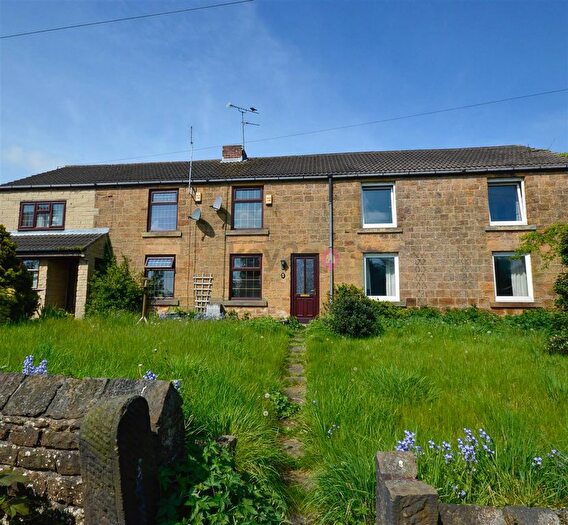
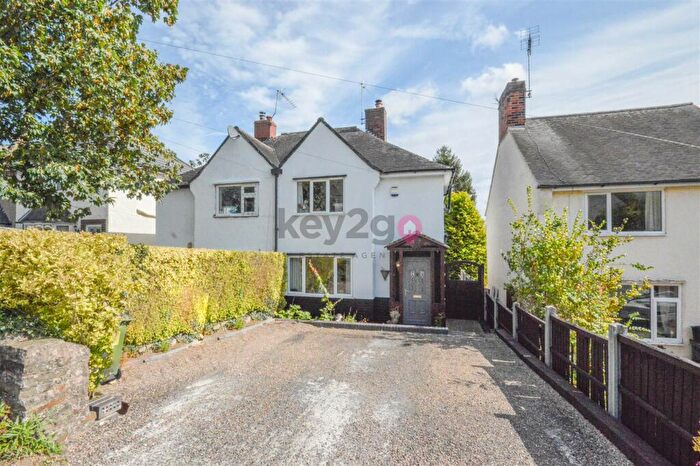
Previously listed properties in Unstone
![]()
If you are looking to sell your house, let it out, or receive a property valuation, an expert can help you.
Click the button below to get started.

Roads and Postcodes in Unstone
Navigate through our locations to find the location of your next house in Unstone, Sheffield for sale or to rent.
| Streets | Postcodes |
|---|---|
| Cavendish Square | S21 5RZ |
| Lightwood Lane | S21 5SD |
| Middle Handley | S21 5RN |
| Nether Handley | S21 5RP |
| Westfield Lane | S21 5RY |
Property price trends in Unstone
According to the latest Land Registry data, the average home in Unstone sold for £970,000 in 2025. That figure comes from 56 sales logged over the past 30 years.
Prices have continued to climb over the last three years. Compared with 2022, when the typical sale came in around £675,000, that's a rise of roughly 43.7%.
Looking back five years, average prices are up about 163.2% since 2020, a gain of around £601,400 in cash terms.
Zoom out to the past decade for the fuller picture. Back in 2015, homes here averaged £525,000, so the typical sold price has climbed about 84.8% since then, roughly 6.3% a year. Stretch the view to fifteen years and that annual pace edges up closer to 6.6%.
Frequently asked questions about Unstone
What is the average price for a property for sale in Unstone?
The average price for a property for sale in Unstone is £652,750. This amount is 193% higher than the average price in Sheffield. There are 44 property listings for sale in Unstone.
What streets have the most expensive properties for sale in Unstone?
The streets with the most expensive properties for sale in Unstone are Lightwood Lane at an average of £970,000 and Middle Handley at an average of £970,000.
What streets have the most affordable properties for sale in Unstone?
The street with the most affordable properties for sale in Unstone is Cavendish Square at an average of £335,500.
Which train stations are available in or near Unstone?
Some of the train stations available in or near Unstone are Dronfield, Chesterfield and Woodhouse.
Property Price Paid in Unstone by Year
The average sold property price by year was:
| Year | Average Sold Price | Price Change |
Sold Properties
|
|---|---|---|---|
| 2025 | £970,000 | 36% |
1 Property |
| 2024 | £622,000 | 36% |
2 Properties |
| 2023 | £397,000 | -70% |
1 Property |
| 2022 | £675,000 | 37% |
2 Properties |
| 2021 | £422,000 | 13% |
6 Properties |
| 2020 | £368,600 | 28% |
2 Properties |
| 2019 | £265,000 | -46% |
1 Property |
| 2018 | £387,650 | 43% |
3 Properties |
| 2017 | £222,500 | -63% |
2 Properties |
| 2016 | £362,700 | -45% |
5 Properties |
Property Price per Property Type in Unstone
Here you can find historic sold price data in order to help with your property search.
The average Property Paid Price for specific property types in the last three years are:
| Property Type | Average Sold Price | Sold Properties |
|---|---|---|
| Detached House | £779,000.00 | 3 Detached Houses |
| Terraced House | £274,000.00 | 1 Terraced House |
