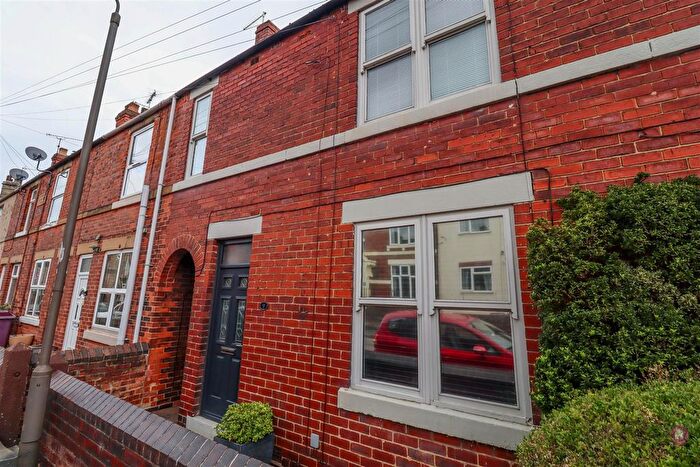
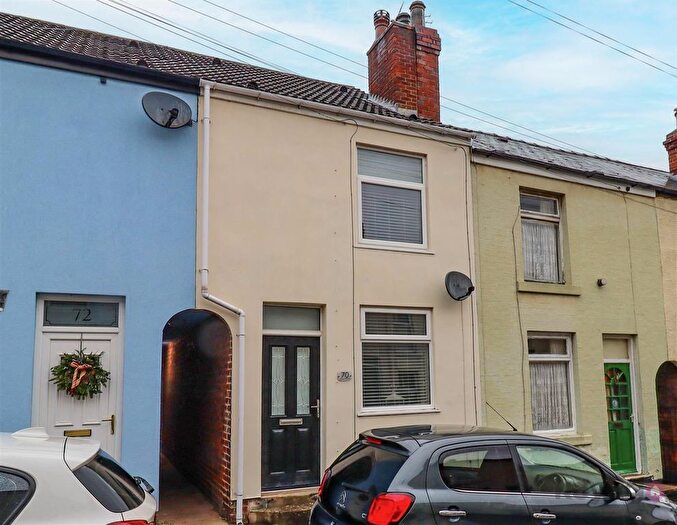
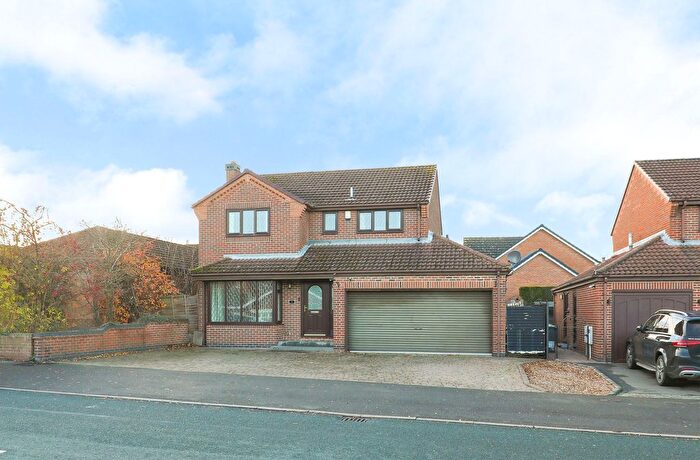
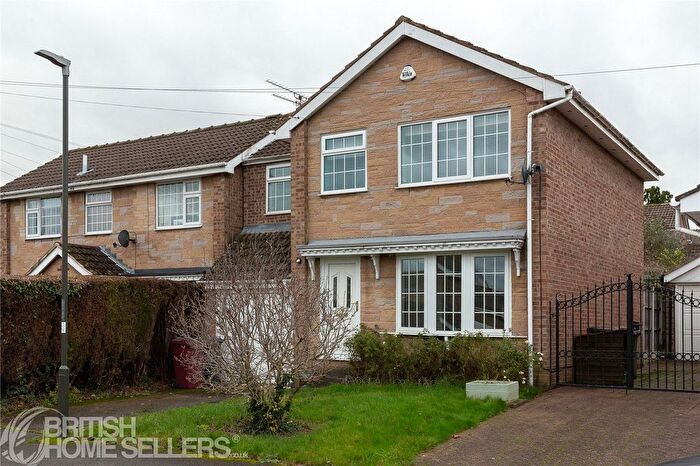
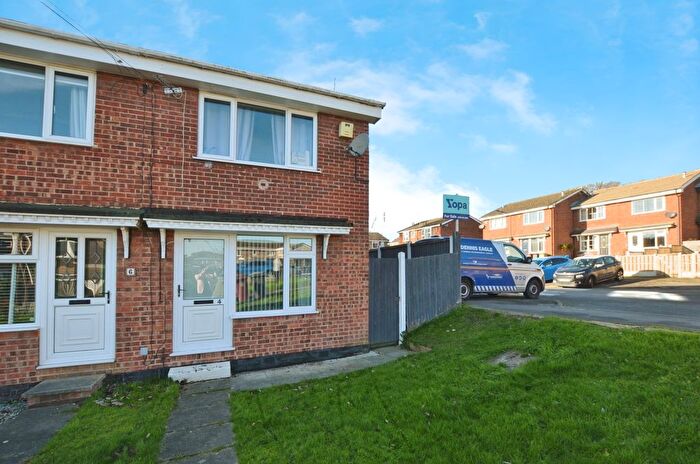
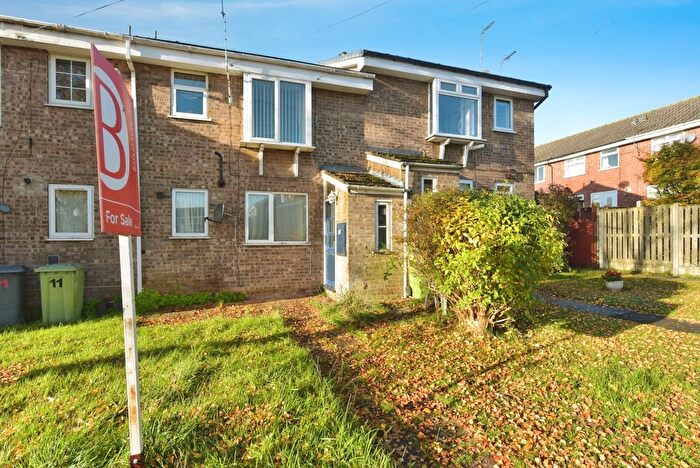
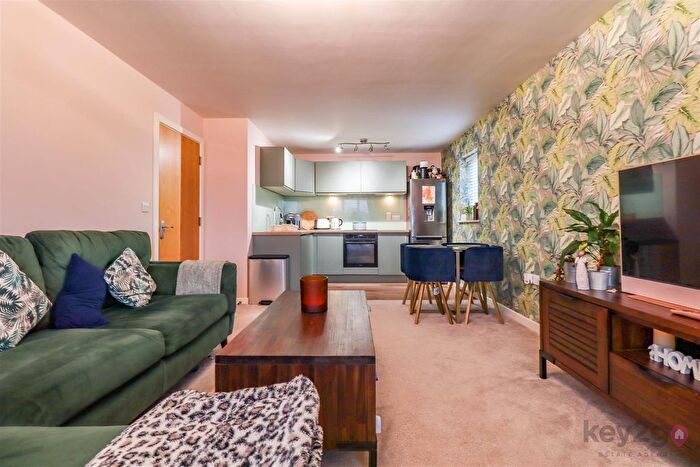
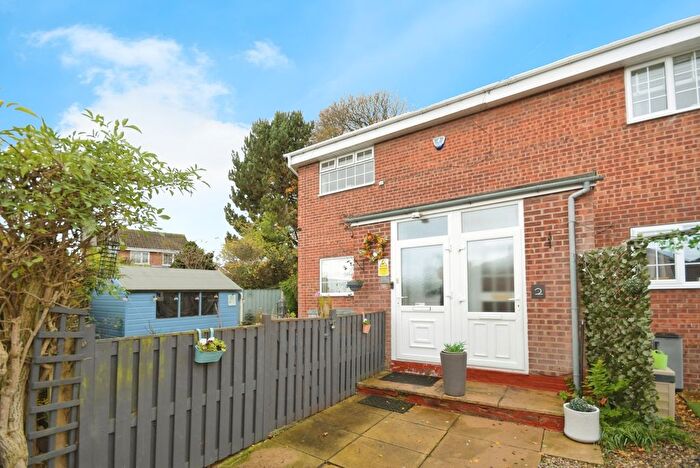
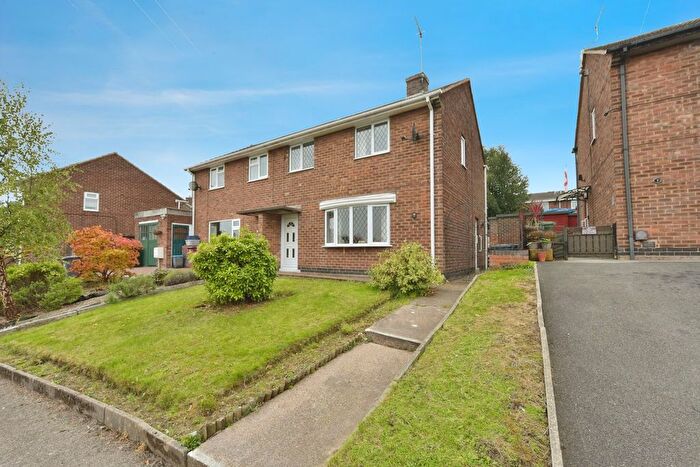
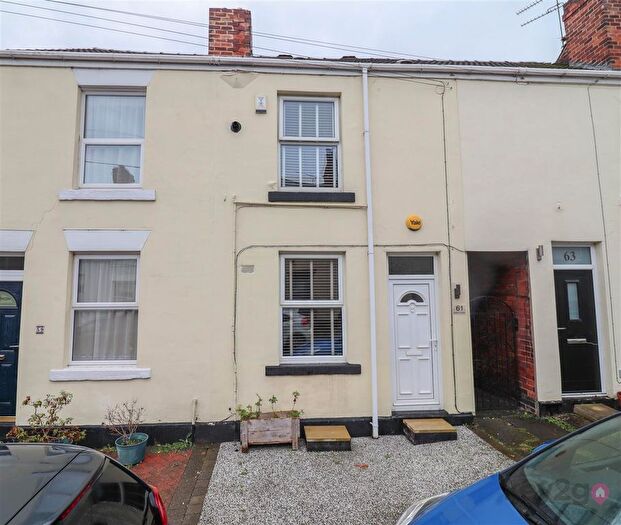
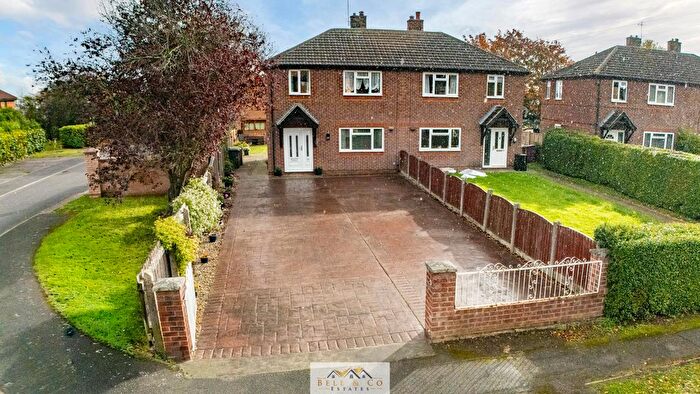
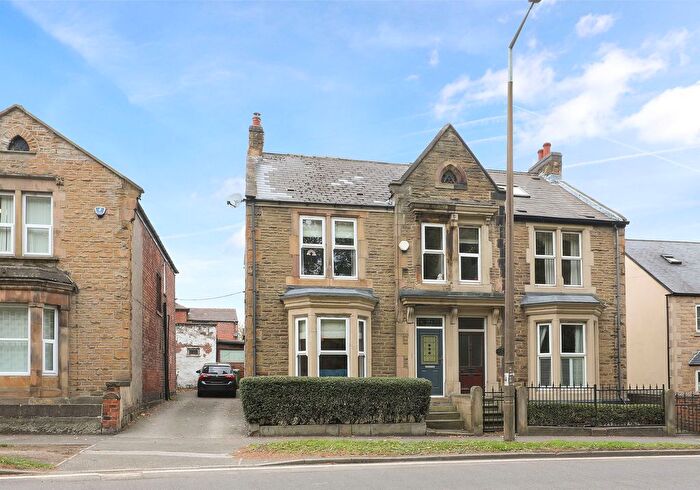
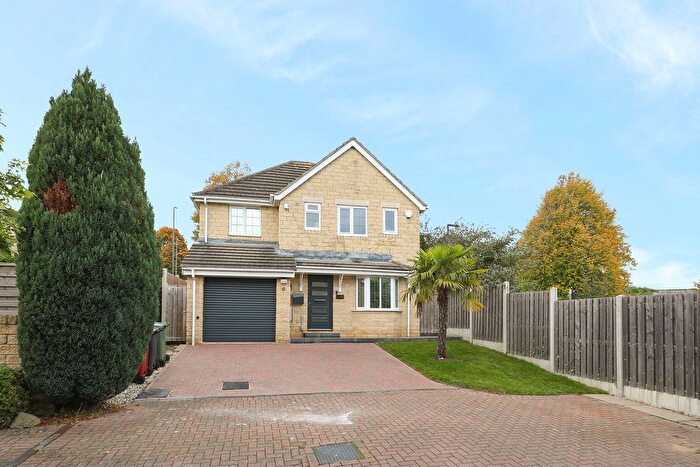
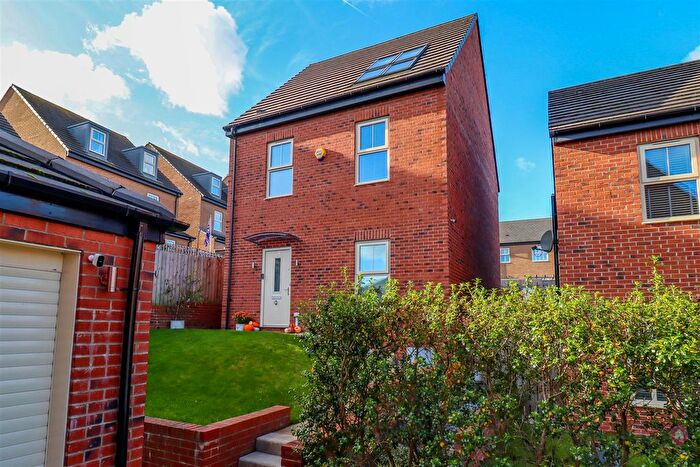
Houses for sale & to rent in Eckington South, Sheffield
House Prices in Eckington South
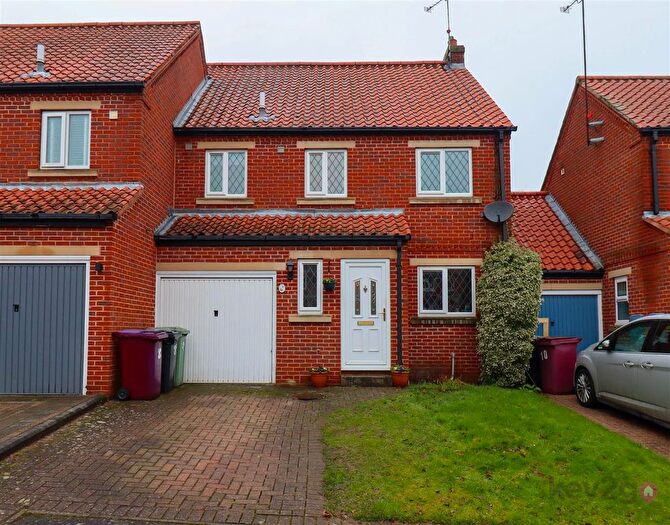
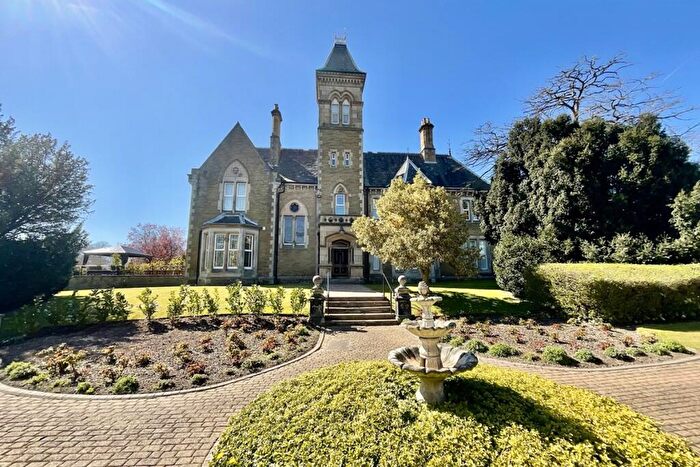
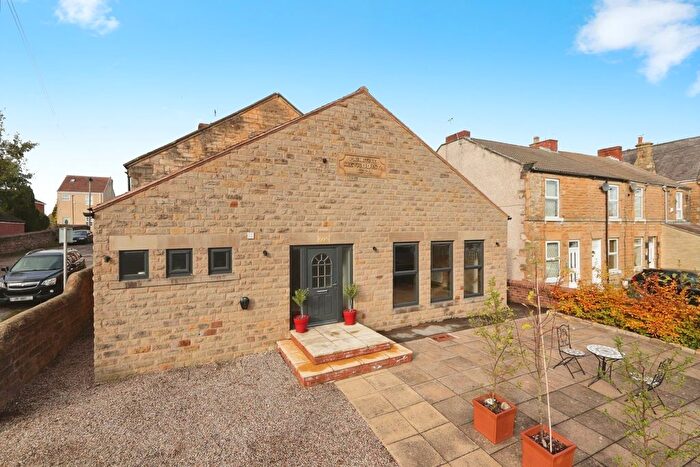
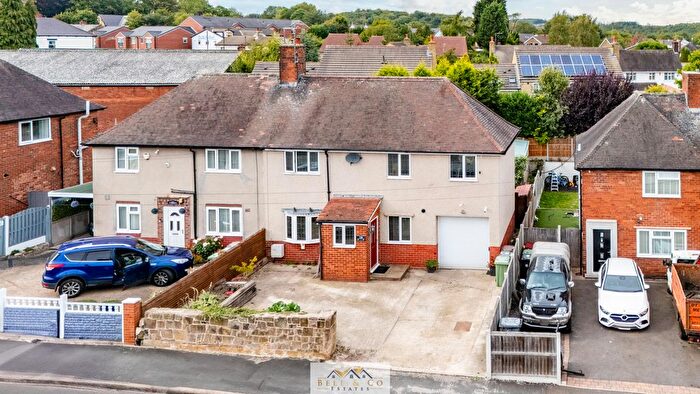
Properties in Eckington South have an average house price of £190,218.00 and had 112 Property Transactions within the last 3 years¹.
Eckington South is an area in Sheffield, Derbyshire with 1,488 households², where the most expensive property was sold for £425,000.00.
Properties for sale in Eckington South
Previously listed properties in Eckington South
Roads and Postcodes in Eckington South
Navigate through our locations to find the location of your next house in Eckington South, Sheffield for sale or to rent.
| Streets | Postcodes |
|---|---|
| Ash Crescent | S21 4AB S21 4AD S21 4AE S21 4AF |
| Ashland Road | S21 4AG |
| Barratt Road | S21 4AN |
| Beech Crescent | S21 4AP S21 4AQ |
| Bramley Mews | S21 4JJ |
| Cedar Close | S21 4BA |
| Chester Court | S21 4JF |
| Chesterfield Road | S21 4BB |
| Chestnut Avenue | S21 4BE |
| Church Street | S21 4BG |
| Ducksett Lane | S21 4BS |
| East View Avenue | S21 4HB |
| Edward Street | S21 4BT |
| Elm Road | S21 4BU |
| Fanshaw Avenue | S21 4HU |
| Fanshaw Close | S21 4HY |
| Fanshaw Drive | S21 4HW |
| Fanshaw Road | S21 4BW |
| Fanshaw Way | S21 4HX |
| Farm Lane | S21 4JU |
| Gosber Road | S21 4BZ |
| Gosber Street | S21 4DA |
| Hardie Street | S21 4DB |
| Hawthorn Road | S21 4DD |
| Hazel Road | S21 4DE |
| Henry Street | S21 4DF |
| High Street | S21 4BL S21 4DG S21 4DH S21 4DJ S21 4DL |
| Hornthorpe Road | S21 4DS |
| John Street | S21 4DU S21 4DW |
| Joseph Street | S21 4DX |
| Kings Mews | S21 4JB |
| Lansbury Court | S21 4GJ |
| Lansbury Road | S21 4EA S21 4EB |
| Laurel Close | S21 4JD |
| Lime Road | S21 4EE |
| Littlemoor | S21 4EF S21 4LF |
| Market Street | S21 4EG |
| Marsh Quarry | S21 4EJ |
| Mary Street | S21 4EN |
| Moss Rise Place | S21 4HA |
| Park Hill | S21 4EU |
| Penny Engine Lane | S21 4BF |
| Peveril Road | S21 4EW |
| Pipworth Lane | S21 4EY |
| Pitt Street | S21 4EZ |
| Poplar Road | S21 4FB |
| Queen Street | S21 4FD S21 4FE |
| Rectory Close | S21 4GL |
| Setcup Lane | S21 4FN |
| Sitwell Street | S21 4FQ |
| Southgate | S21 4FS S21 4FT |
| Southgate Court | S21 4LA |
| Station Road | S21 4FW S21 4FX |
| The Old Wood Yard | S21 4LL |
| Valley View Close | S21 4HD |
| West End View | S21 4FZ |
| West Street | S21 4GA S21 4GB S21 4LB |
| William Street | S21 4GD |
Transport near Eckington South
- FAQ
- Price Paid By Year
- Property Type Price
Frequently asked questions about Eckington South
What is the average price for a property for sale in Eckington South?
The average price for a property for sale in Eckington South is £190,218. This amount is 14% lower than the average price in Sheffield. There are 371 property listings for sale in Eckington South.
What streets have the most expensive properties for sale in Eckington South?
The streets with the most expensive properties for sale in Eckington South are Chester Court at an average of £385,000, Fanshaw Way at an average of £340,000 and Fanshaw Close at an average of £322,500.
What streets have the most affordable properties for sale in Eckington South?
The streets with the most affordable properties for sale in Eckington South are Gosber Road at an average of £95,000, West Street at an average of £98,666 and Sitwell Street at an average of £120,000.
Which train stations are available in or near Eckington South?
Some of the train stations available in or near Eckington South are Woodhouse, Dronfield and Kiveton Bridge.
Property Price Paid in Eckington South by Year
The average sold property price by year was:
| Year | Average Sold Price | Price Change |
Sold Properties
|
|---|---|---|---|
| 2025 | £200,318 | 11% |
29 Properties |
| 2024 | £178,248 | -9% |
41 Properties |
| 2023 | £194,930 | -0,1% |
42 Properties |
| 2022 | £195,132 | 7% |
37 Properties |
| 2021 | £181,153 | -9% |
52 Properties |
| 2020 | £197,352 | 3% |
34 Properties |
| 2019 | £191,320 | 21% |
41 Properties |
| 2018 | £151,140 | -16% |
37 Properties |
| 2017 | £175,666 | 23% |
45 Properties |
| 2016 | £135,704 | 2% |
45 Properties |
| 2015 | £132,748 | -10% |
41 Properties |
| 2014 | £146,017 | 5% |
46 Properties |
| 2013 | £138,393 | 20% |
40 Properties |
| 2012 | £111,246 | -9% |
22 Properties |
| 2011 | £120,865 | -31% |
25 Properties |
| 2010 | £157,733 | 20% |
27 Properties |
| 2009 | £126,743 | -11% |
40 Properties |
| 2008 | £140,756 | 7% |
35 Properties |
| 2007 | £130,859 | -9% |
56 Properties |
| 2006 | £142,040 | 25% |
52 Properties |
| 2005 | £106,410 | -22% |
44 Properties |
| 2004 | £129,780 | 29% |
55 Properties |
| 2003 | £92,245 | 20% |
68 Properties |
| 2002 | £74,063 | 19% |
75 Properties |
| 2001 | £60,315 | -14% |
54 Properties |
| 2000 | £68,771 | 32% |
46 Properties |
| 1999 | £46,801 | -16% |
43 Properties |
| 1998 | £54,251 | -11% |
49 Properties |
| 1997 | £60,147 | 10% |
51 Properties |
| 1996 | £53,847 | 7% |
58 Properties |
| 1995 | £50,315 | - |
49 Properties |
Property Price per Property Type in Eckington South
Here you can find historic sold price data in order to help with your property search.
The average Property Paid Price for specific property types in the last three years are:
| Property Type | Average Sold Price | Sold Properties |
|---|---|---|
| Semi Detached House | £178,648.00 | 54 Semi Detached Houses |
| Detached House | £291,187.00 | 16 Detached Houses |
| Terraced House | £170,826.00 | 36 Terraced Houses |
| Flat | £141,458.00 | 6 Flats |

