
Houses for sale & to rent in S80 4UE, Calf Croft, Whitwell, Worksop
House Prices in S80 4UE, Calf Croft, Whitwell
Properties in S80 4UE have no sales history available within the last 3 years. S80 4UE is a postcode in Calf Croft located in Whitwell, an area in Worksop, Derbyshire, with 15 households².
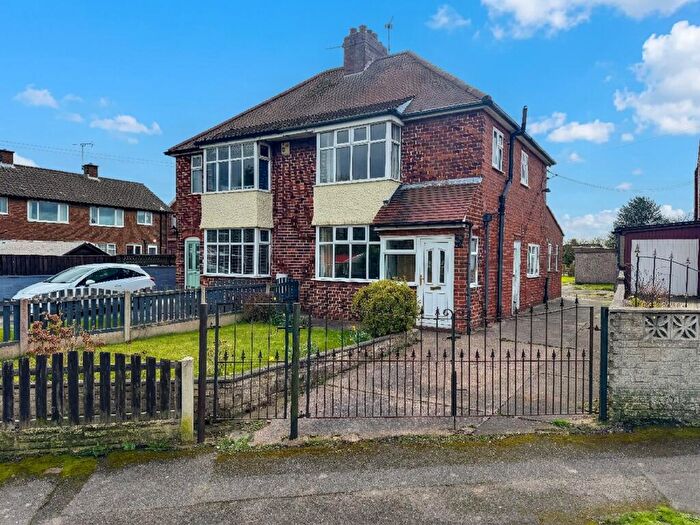
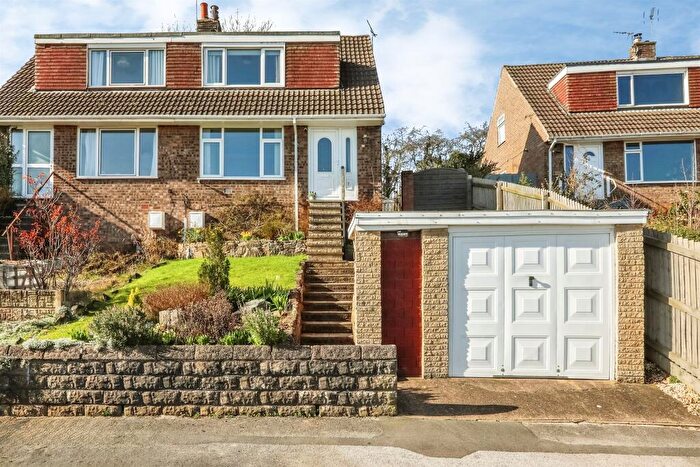
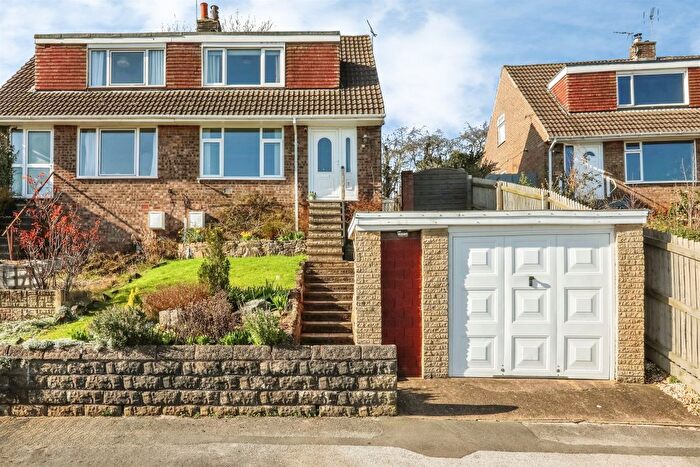
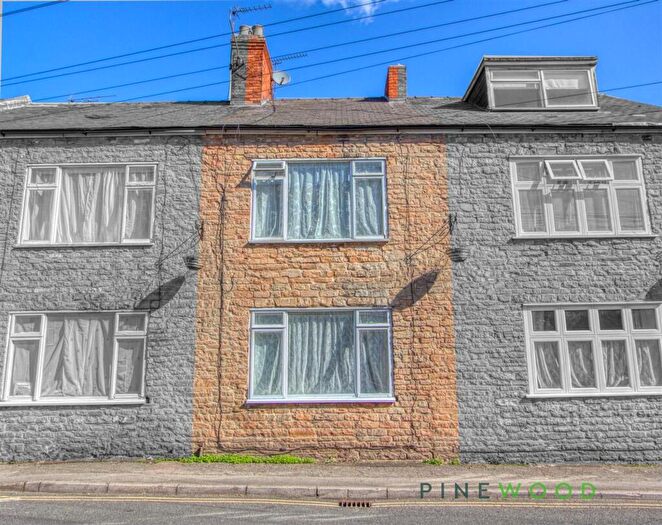
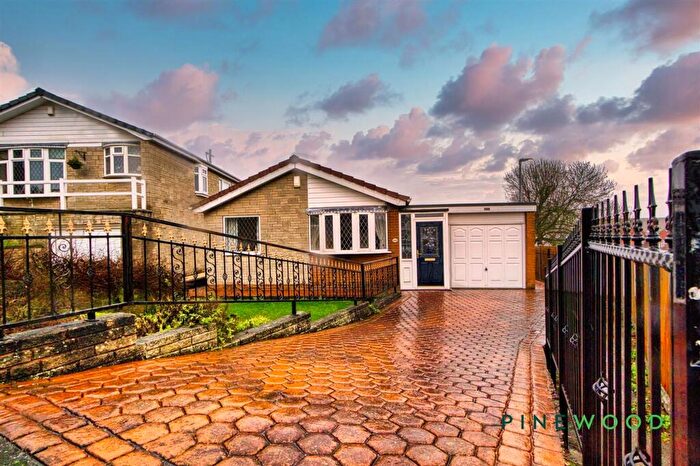
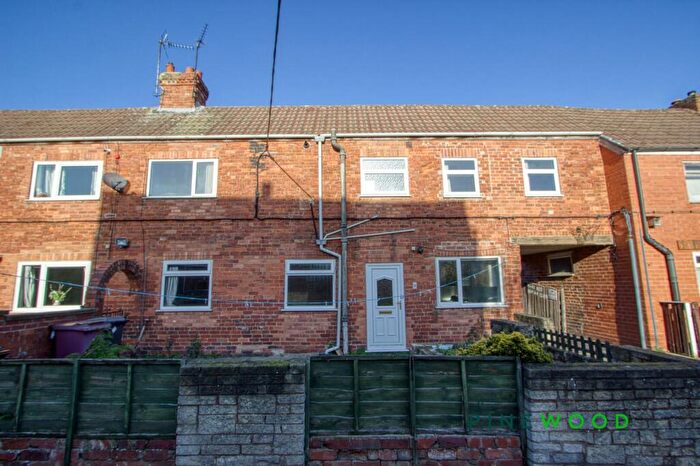
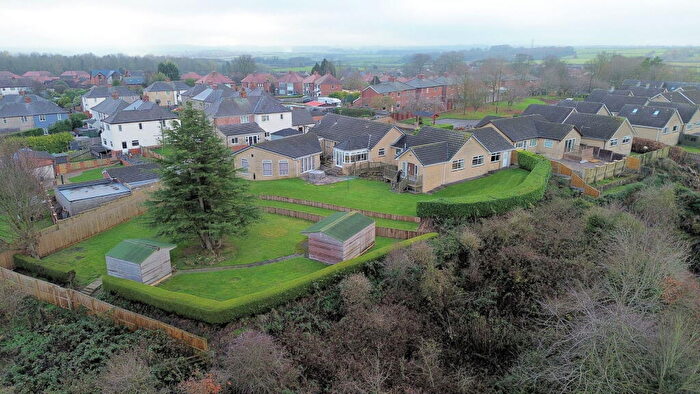
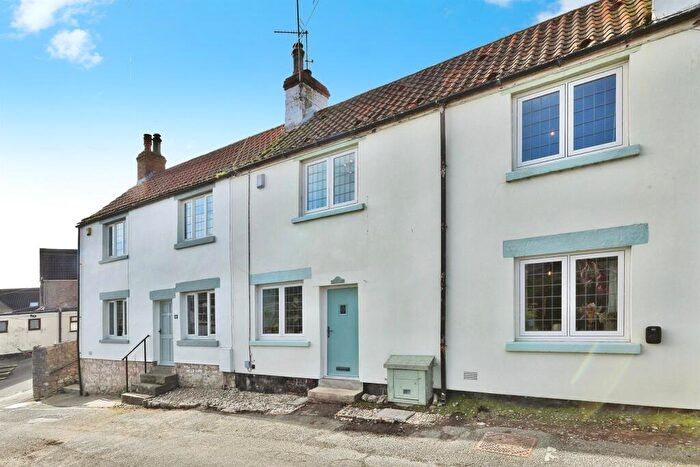
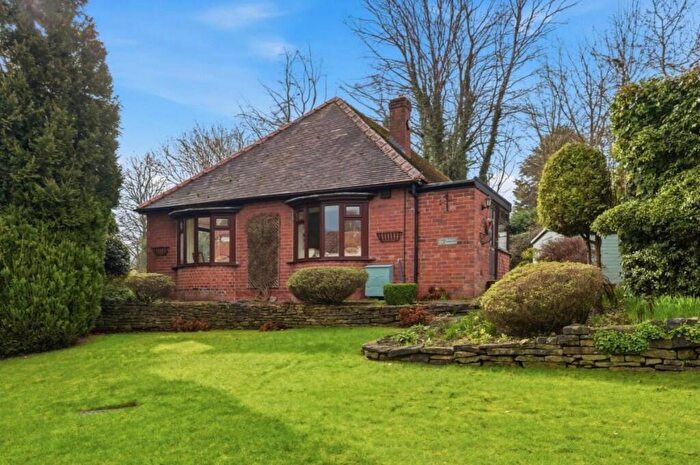
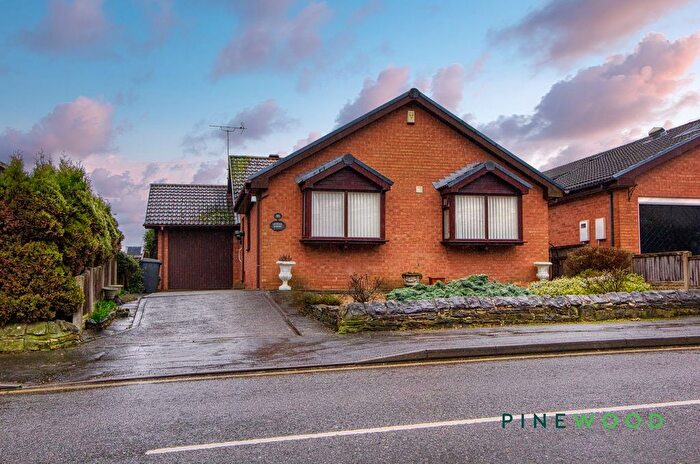
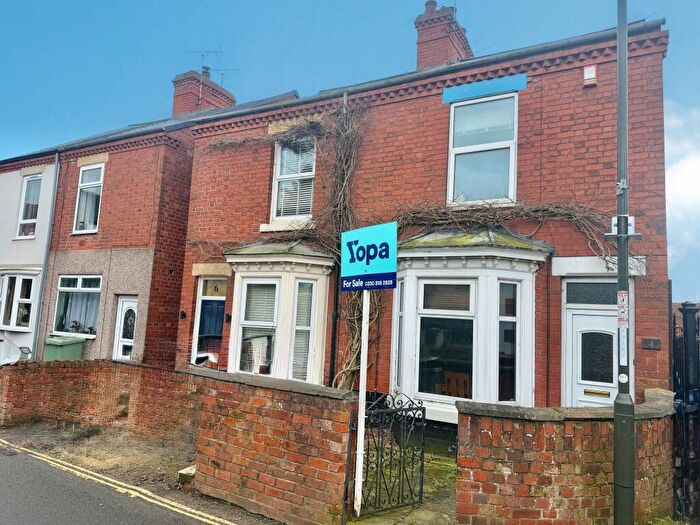
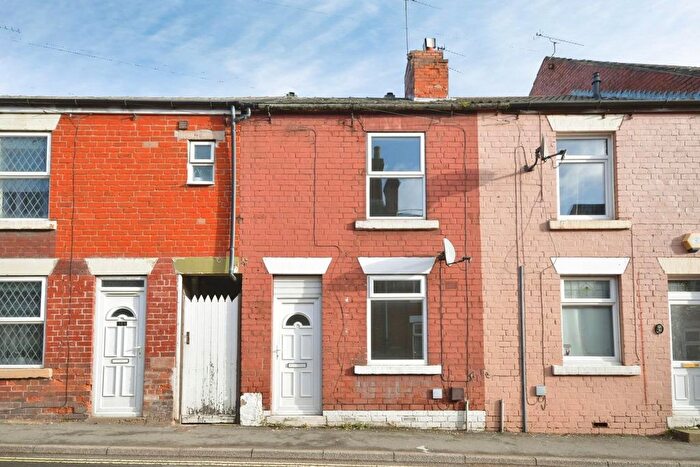
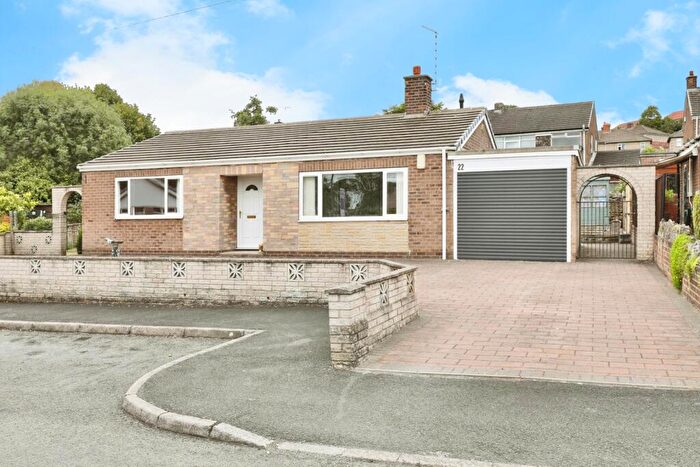
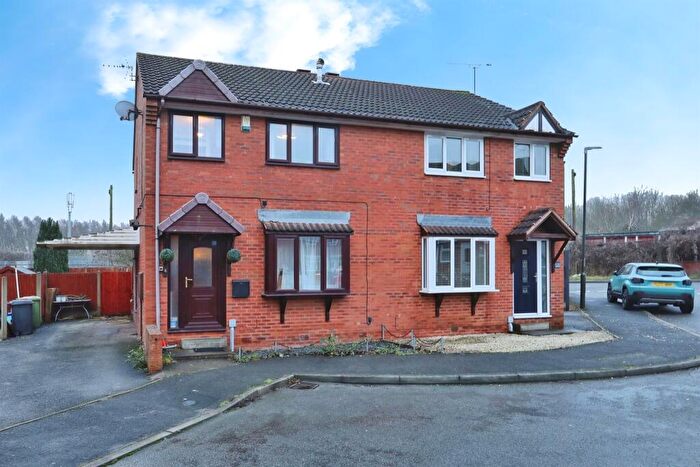
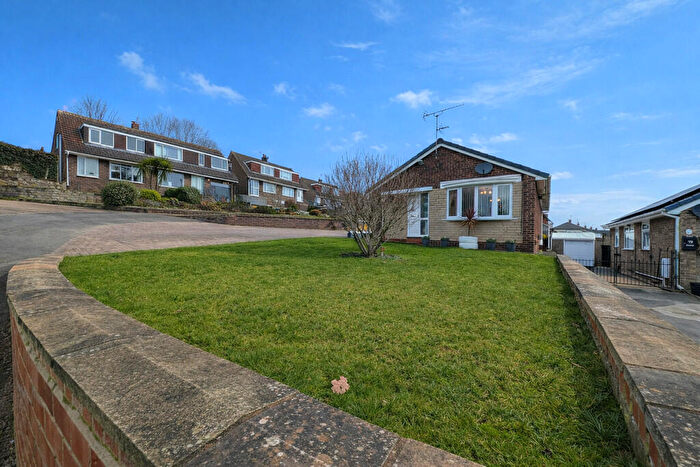
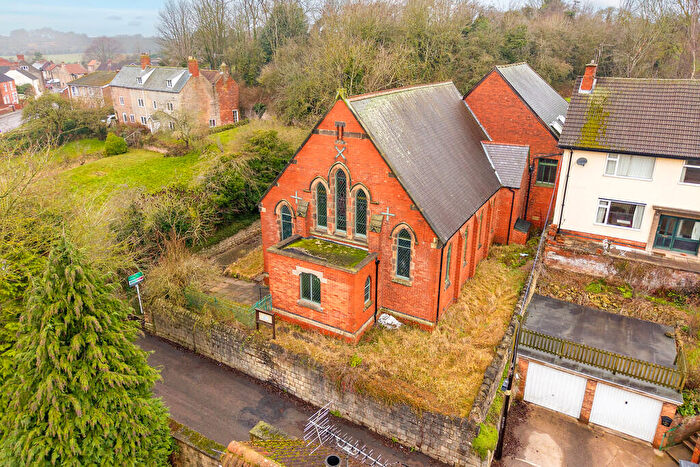
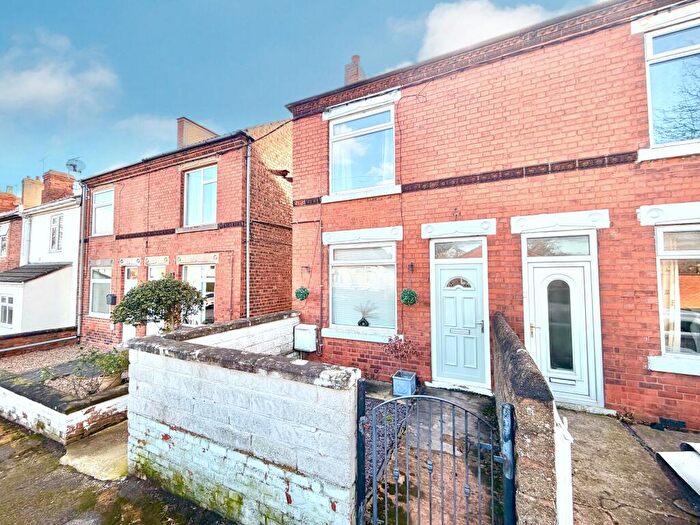
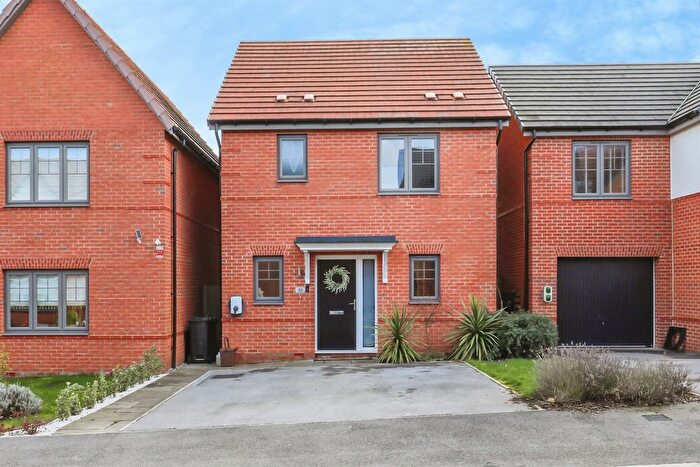
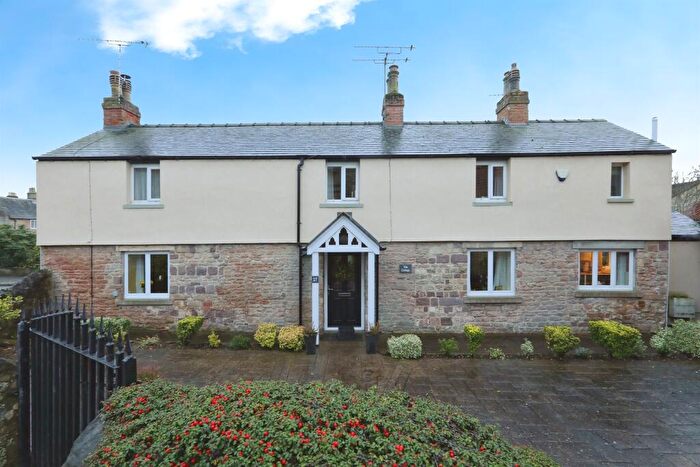
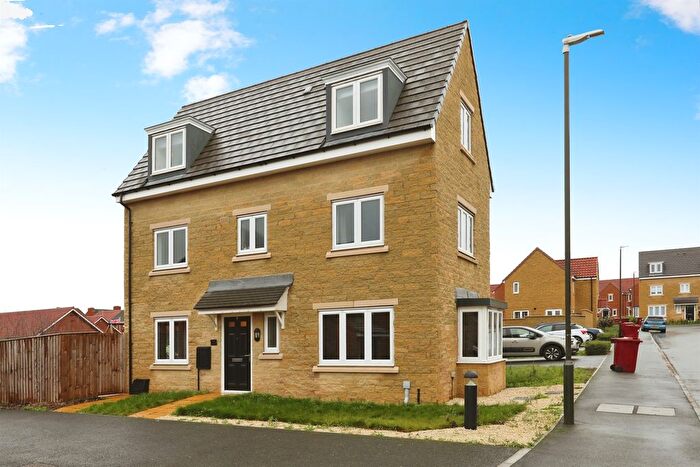
Properties for sale near S80 4UE, Calf Croft

![]()
If you are looking to sell your house, let it out, or receive a property valuation, an expert can help you.
Click the button below to get started.


Price Paid in Calf Croft, S80 4UE, Whitwell
11A Calf Croft, S80 4UE, Whitwell Worksop
Property 11A has been sold 2 times. The last time it was sold was in 05/02/2020 and the sold price was £145,000.00.
This terraced house, sold as a freehold on 05/02/2020, is a 66 sqm semi-detached bungalow with an EPC rating of D.
| Date | Price | Property Type | Tenure | Classification |
|---|---|---|---|---|
| 05/02/2020 | £145,000.00 | Terraced House | freehold | Established Building |
| 27/04/2007 | £107,500.00 | Terraced House | freehold | Established Building |
11 Calf Croft, S80 4UE, Whitwell Worksop
Property 11 has been sold 2 times. The last time it was sold was in 18/08/2011 and the sold price was £80,000.00.
This semi detached house, sold as a freehold on 18/08/2011, is a 61 sqm semi-detached bungalow with an EPC rating of D.
| Date | Price | Property Type | Tenure | Classification |
|---|---|---|---|---|
| 18/08/2011 | £80,000.00 | Semi Detached House | freehold | Established Building |
| 03/10/2005 | £84,950.00 | Semi Detached House | freehold | Established Building |
9 CALF CROFT WHITWELL, S80 4UE, Whitwell Worksop
This is a 54 square meter Semi-detached Bungalow with an EPC rating of C. Currently, there is no transaction history available for this property.
Transport near S80 4UE, Calf Croft
-
 Whitwell (Derbys) Station
 -
Creswell (Derbys) Station
-
Shireoaks Station
-
Langwith Station
-
Worksop Station
-
Kiveton Park Station
-
Kiveton Bridge Station
House price paid reports for S80 4UE, Calf Croft
Click on the buttons below to see price paid reports by year or property price:
- Price Paid By Year
Property Price Paid in S80 4UE, Calf Croft by Year
The average sold property price by year was:
| Year | Average Sold Price | Price Change |
Sold Properties
|
|---|---|---|---|
| 2020 | £145,000 | 45% |
1 Property |
| 2011 | £80,000 | -34% |
1 Property |
| 2007 | £107,500 | 21% |
1 Property |
| 2005 | £84,950 | - |
1 Property |