
Houses for sale in EX39 3RJ, Southbank Drive, Bideford North, Bideford
House Prices in EX39 3RJ, Southbank Drive, Bideford North
Properties in EX39 3RJ have no sales history available within the last 3 years. EX39 3RJ is a postcode in Southbank Drive located in Bideford North, an area in Bideford, Devon, with 7 households².
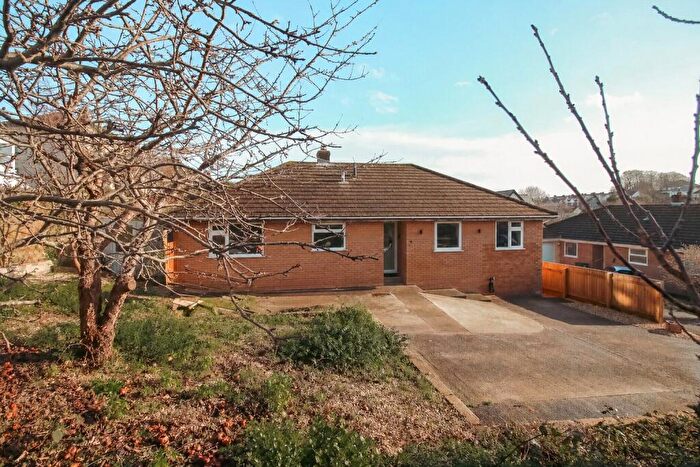
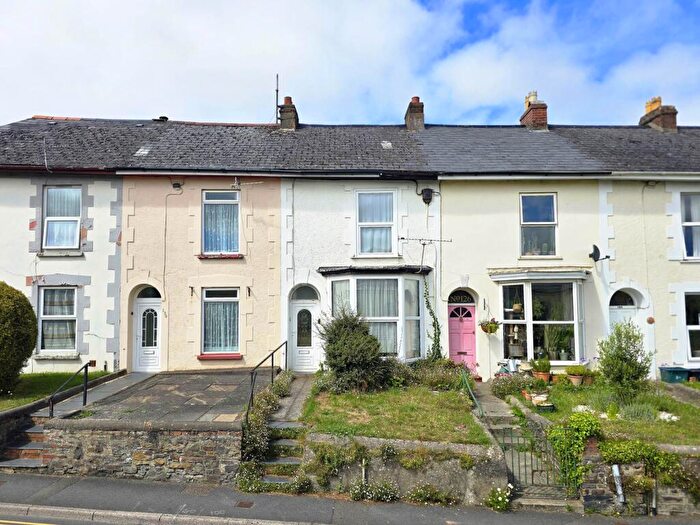
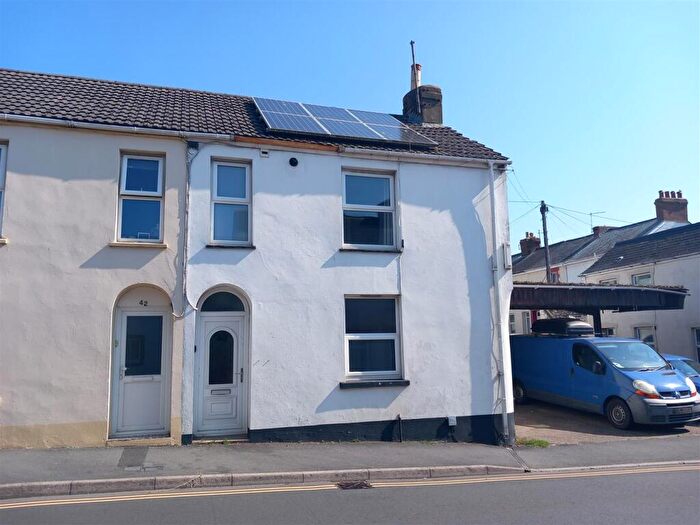
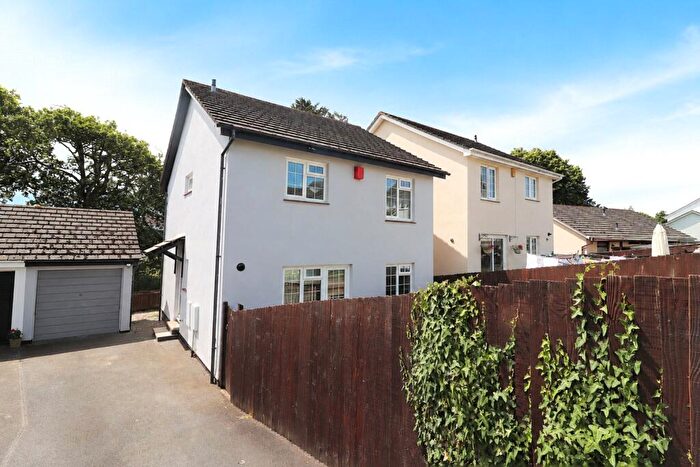
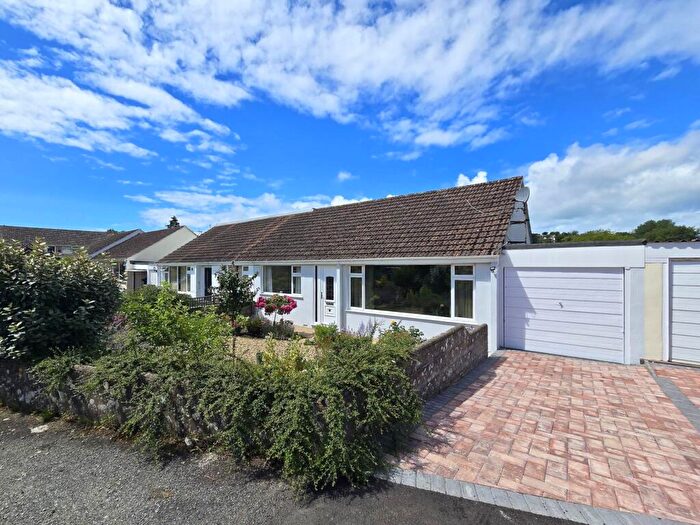
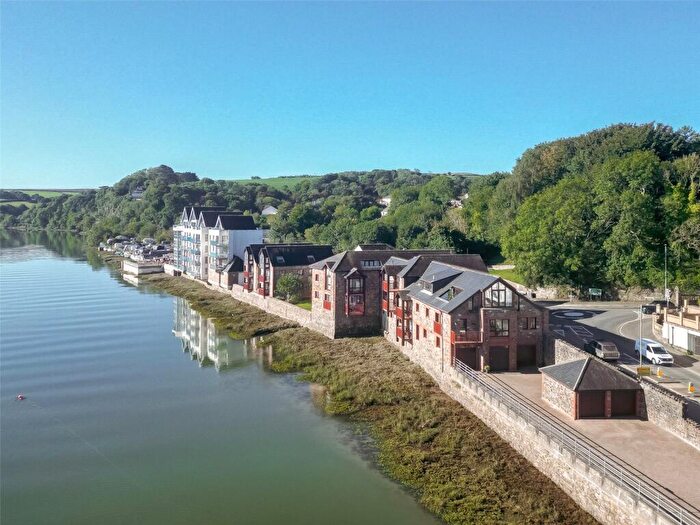
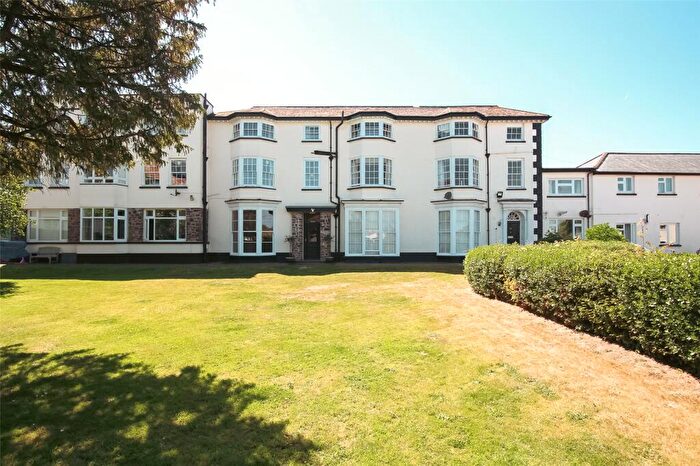
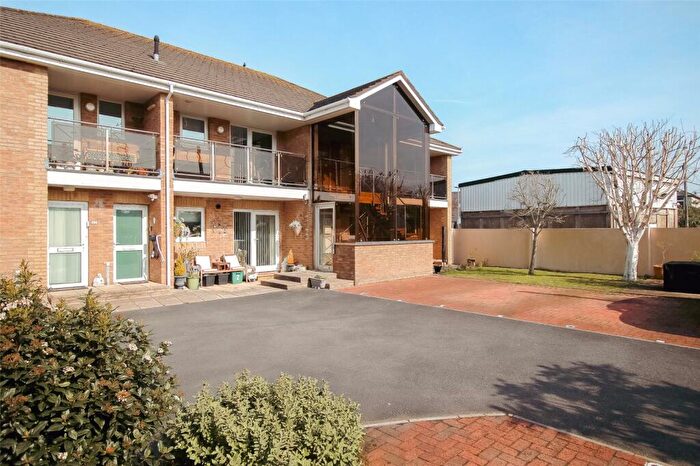
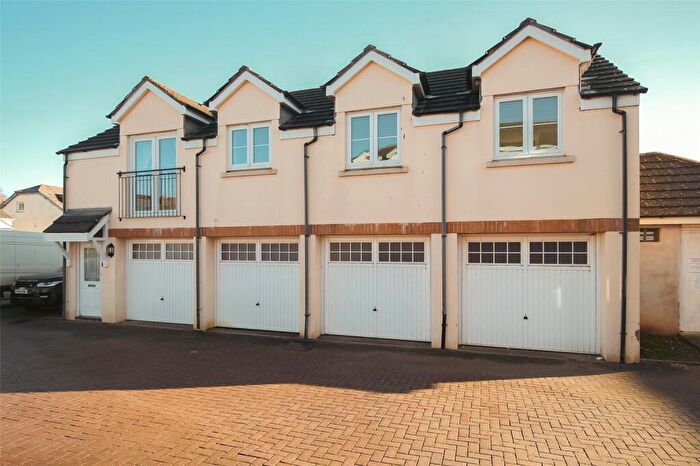
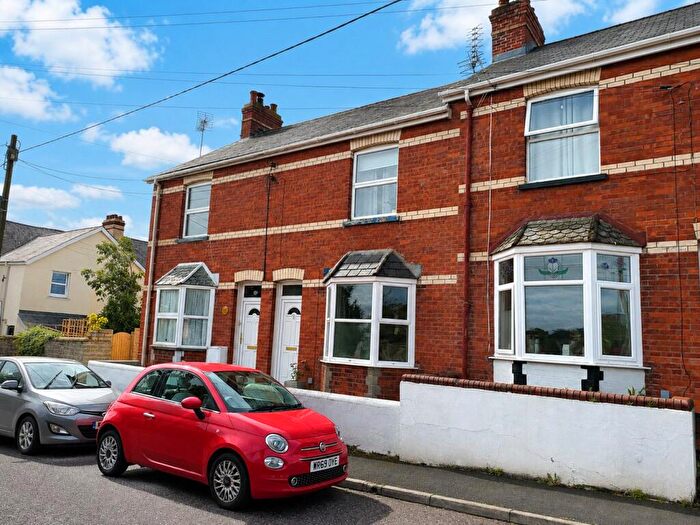
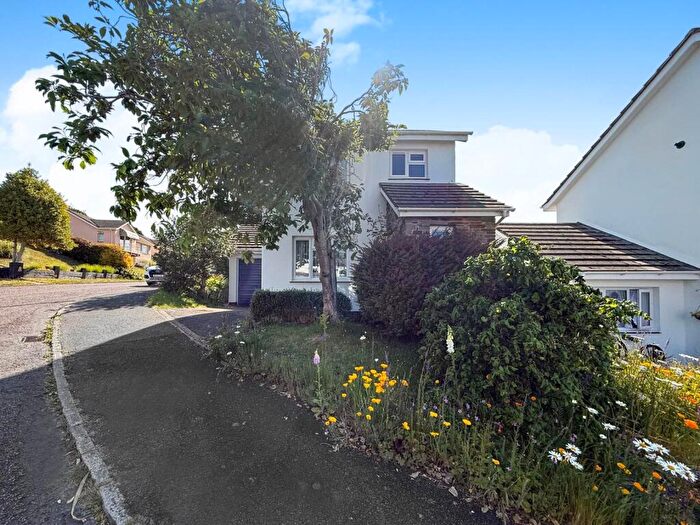
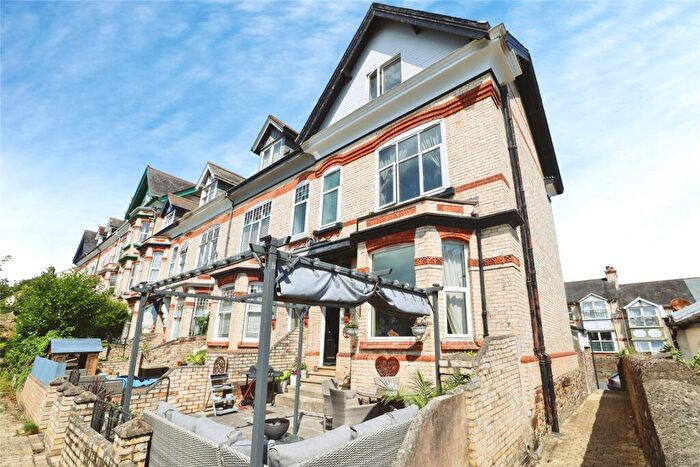
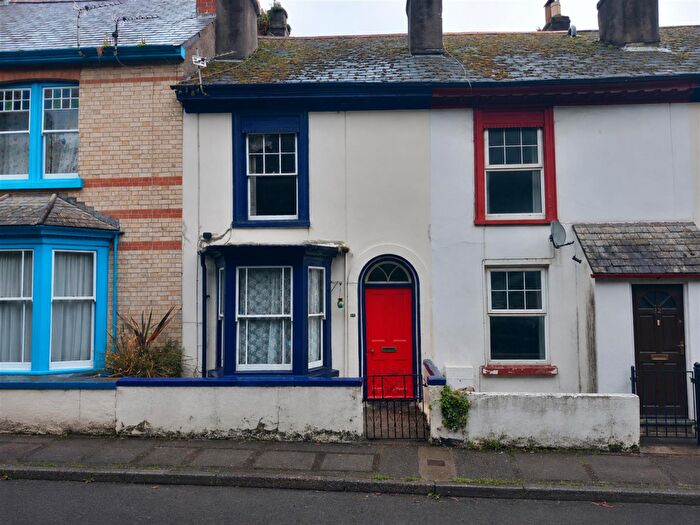
Properties for sale near EX39 3RJ, Southbank Drive
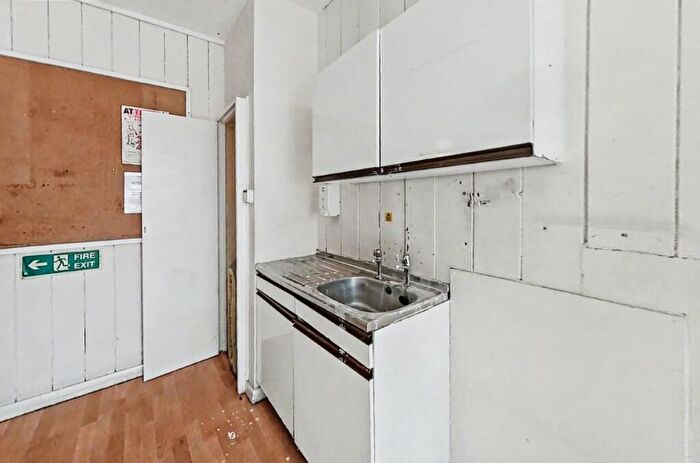
![]()
If you are looking to sell your house, let it out, or receive a property valuation, an expert can help you.
Click the button below to get started.

Price Paid in Southbank Drive, EX39 3RJ, Bideford North
4 Southbank Drive, EX39 3RJ, Bideford North Bideford
Property 4 has been sold 2 times. The last time it was sold was in 22/03/2021 and the sold price was £330,000.00.
This detached house, sold as a freehold on 22/03/2021, is a 85 sqm detached bungalow with an EPC rating of D.
| Date | Price | Property Type | Tenure | Classification |
|---|---|---|---|---|
| 22/03/2021 | £330,000.00 | Detached House | freehold | Established Building |
| 31/07/2009 | £210,000.00 | Detached House | freehold | Established Building |
6 Southbank Drive, EX39 3RJ, Bideford North Bideford
Property 6 has been sold 1 time. The last time it was sold was in 05/02/2020 and the sold price was £275,000.00.
This detached house, sold as a freehold on 05/02/2020, is a 86 sqm detached bungalow with an EPC rating of D.
| Date | Price | Property Type | Tenure | Classification |
|---|---|---|---|---|
| 05/02/2020 | £275,000.00 | Detached House | freehold | Established Building |
3 Southbank Drive, EX39 3RJ, Bideford North Bideford
Property 3 has been sold 3 times. The last time it was sold was in 17/09/2015 and the sold price was £389,950.00.
This detached house, sold as a freehold on 17/09/2015, is a 155 sqm detached house with an EPC rating of C.
| Date | Price | Property Type | Tenure | Classification |
|---|---|---|---|---|
| 17/09/2015 | £389,950.00 | Detached House | freehold | Established Building |
| 06/02/2014 | £360,000.00 | Detached House | freehold | Established Building |
| 12/01/2004 | £289,950.00 | Detached House | freehold | Established Building |
CARNOUSTIE, 7 Southbank Drive, EX39 3RJ, Bideford North Bideford
Property CARNOUSTIE, 7 has been sold 2 times. The last time it was sold was in 29/04/2015 and the sold price was £289,950.00.
This is a Detached House which was sold as a freehold in 29/04/2015
| Date | Price | Property Type | Tenure | Classification |
|---|---|---|---|---|
| 29/04/2015 | £289,950.00 | Detached House | freehold | Established Building |
| 09/03/2012 | £245,000.00 | Detached House | freehold | Established Building |
1 Southbank Drive, EX39 3RJ, Bideford North Bideford
Property 1 has been sold 2 times. The last time it was sold was in 23/01/2015 and the sold price was £400,000.00.
This detached house, sold as a freehold on 23/01/2015, is a 130 sqm detached house with an EPC rating of C.
| Date | Price | Property Type | Tenure | Classification |
|---|---|---|---|---|
| 23/01/2015 | £400,000.00 | Detached House | freehold | Established Building |
| 03/11/2006 | £325,000.00 | Detached House | freehold | Established Building |
5 Southbank Drive, EX39 3RJ, Bideford North Bideford
Property 5 has been sold 1 time. The last time it was sold was in 09/04/2009 and the sold price was £220,000.00.
This detached house, sold as a freehold on 09/04/2009, is a 99 sqm detached bungalow with an EPC rating of D.
| Date | Price | Property Type | Tenure | Classification |
|---|---|---|---|---|
| 09/04/2009 | £220,000.00 | Detached House | freehold | Established Building |
Property price trends in EX39 3RJ, Southbank Drive
According to the latest Land Registry data, the average home in EX39 3RJ, Southbank Drive sold for £330,000 in 2021. That figure comes from 11 sales logged over the past 17 years.
Looking back five years, average prices are down about 8.3% since 2015, a drop of around £29,966 in cash terms.
Zoom out to the past decade for the fuller picture. Back in 2012, homes here averaged £245,000, so the typical sold price has climbed about 34.7% since then, roughly 3.4% a year. Stretch the view to fifteen years and that annual pace eases back to about 0.1%.
Property Price Paid in EX39 3RJ, Southbank Drive by Year
The average sold property price by year was:
| Year | Average Sold Price | Price Change |
Sold Properties
|
|---|---|---|---|
| 2021 | £330,000 | 17% |
1 Property |
| 2020 | £275,000 | -31% |
1 Property |
| 2015 | £359,966 | - |
3 Properties |
| 2014 | £360,000 | 32% |
1 Property |
| 2012 | £245,000 | 12% |
1 Property |
| 2009 | £215,000 | -51% |
2 Properties |
| 2006 | £325,000 | 11% |
1 Property |
| 2004 | £289,950 | - |
1 Property |
