
Houses for sale in Orchard Hill, Bideford
House Prices in Orchard Hill
Properties in Orchard Hill have an average house price of £372k and had 73 Property Transactions within the last 3 years¹.
Orchard Hill is an area in Bideford, Devon with 725 households², where the most expensive property was sold for £840k.
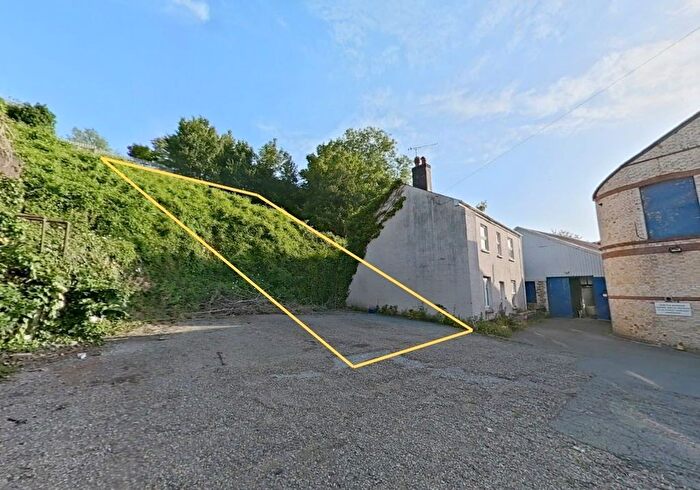
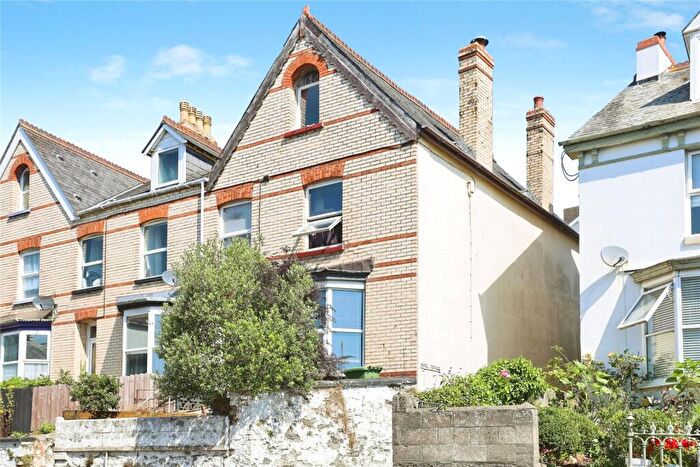
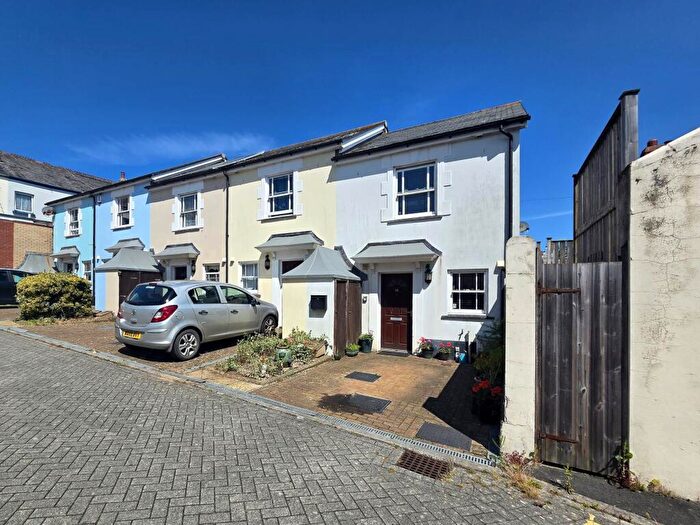
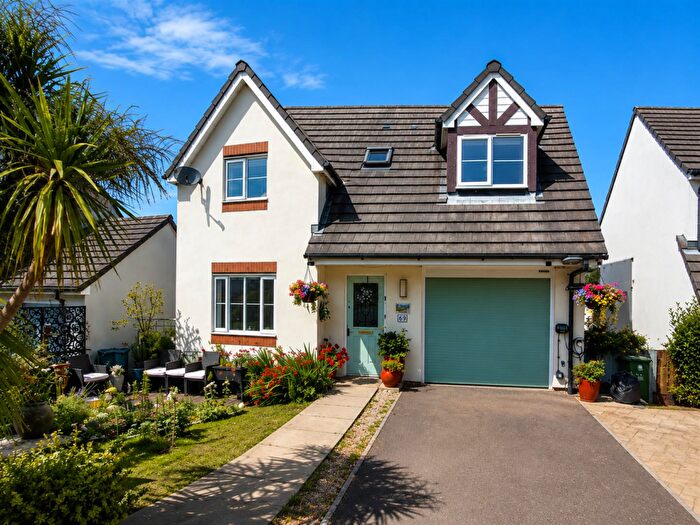
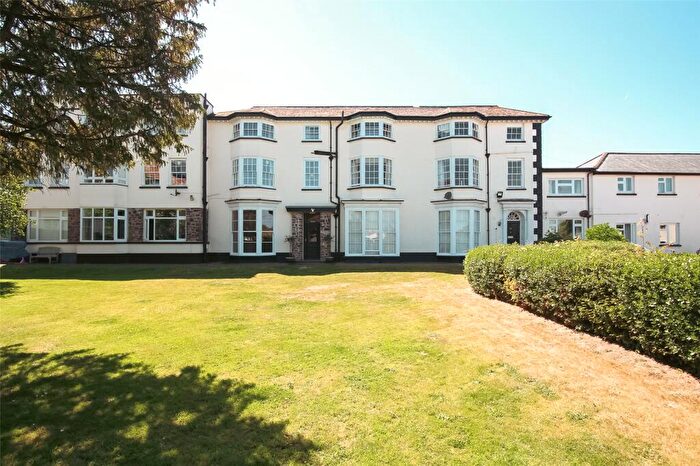
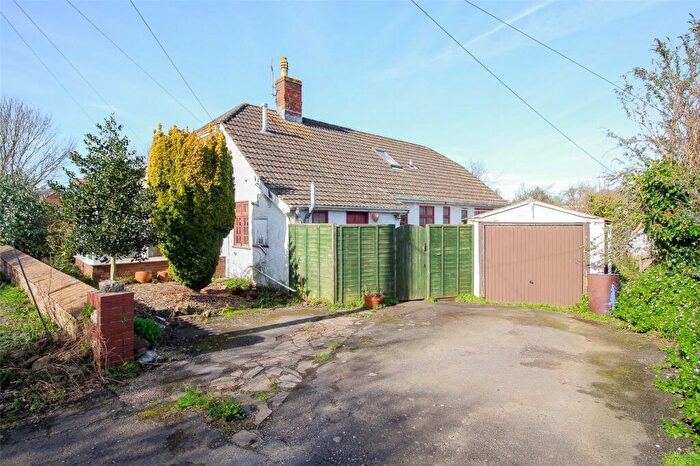
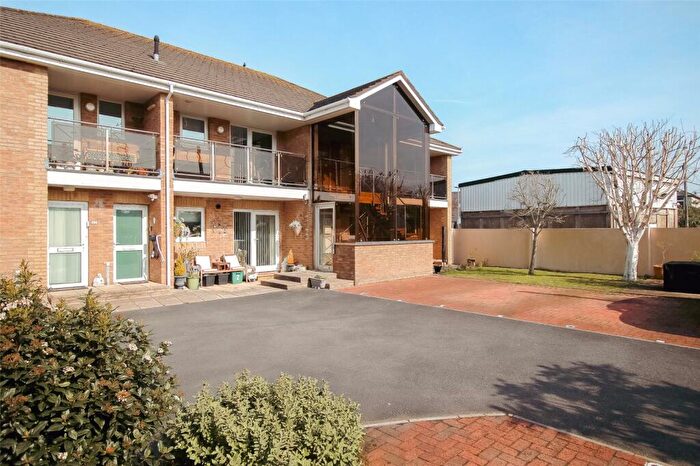
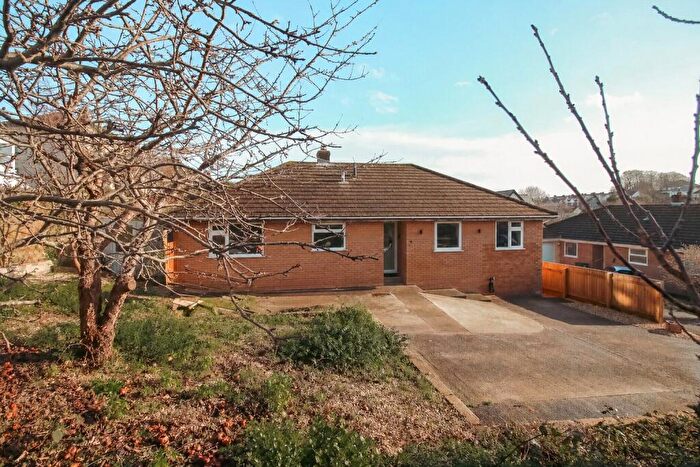
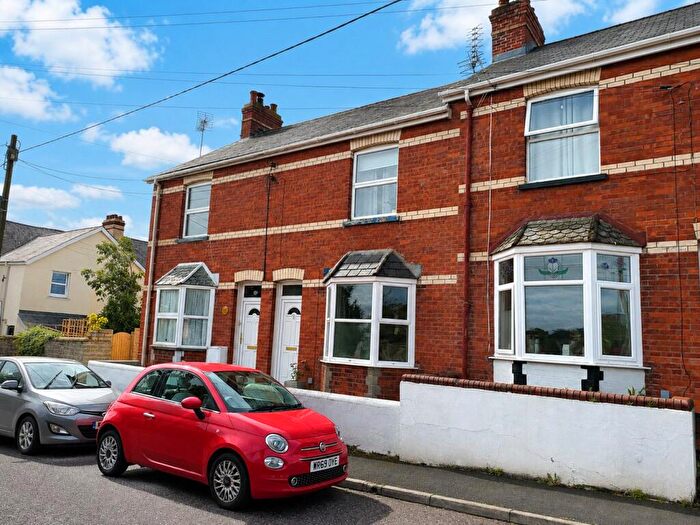
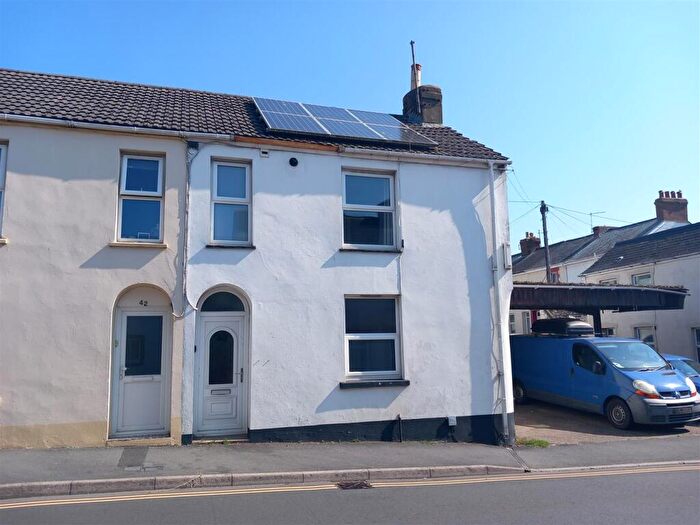
Properties for sale in Orchard Hill

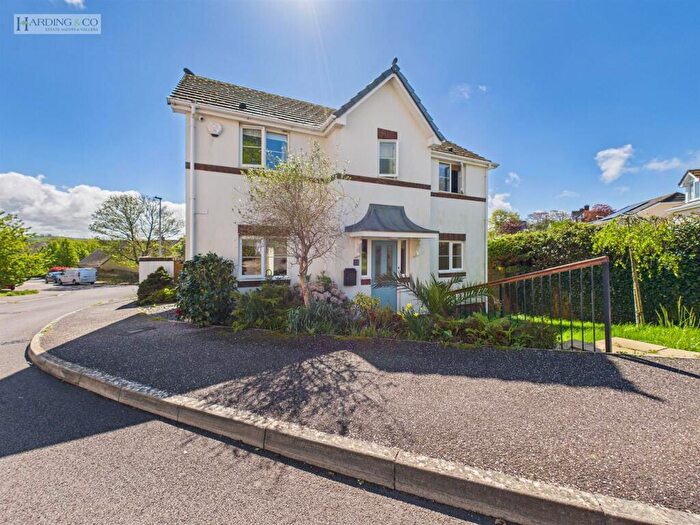
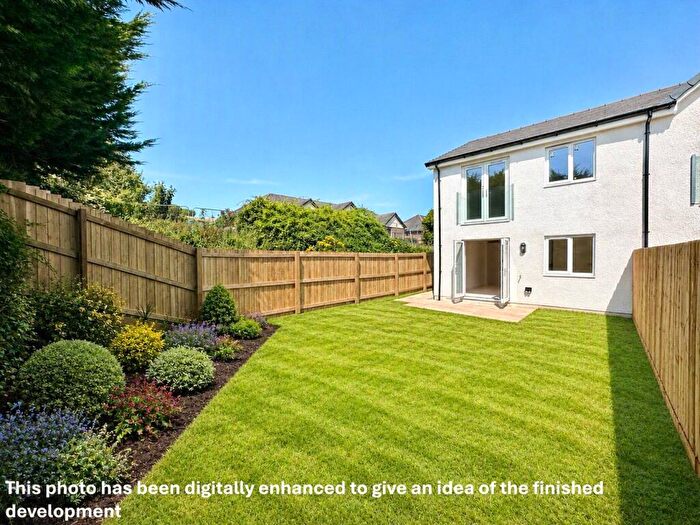
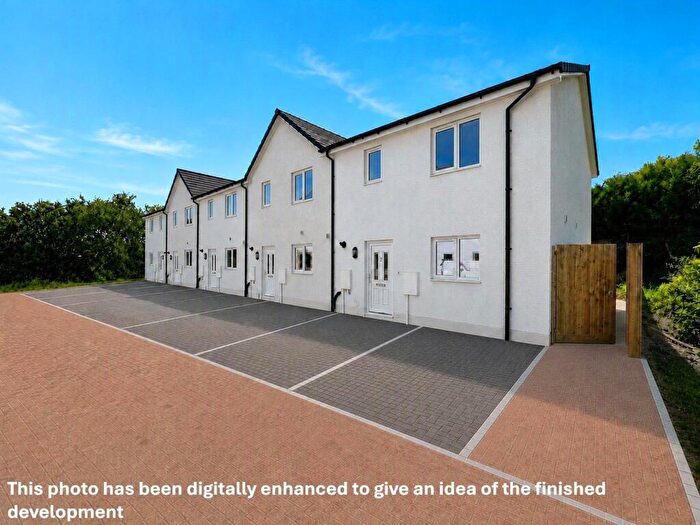
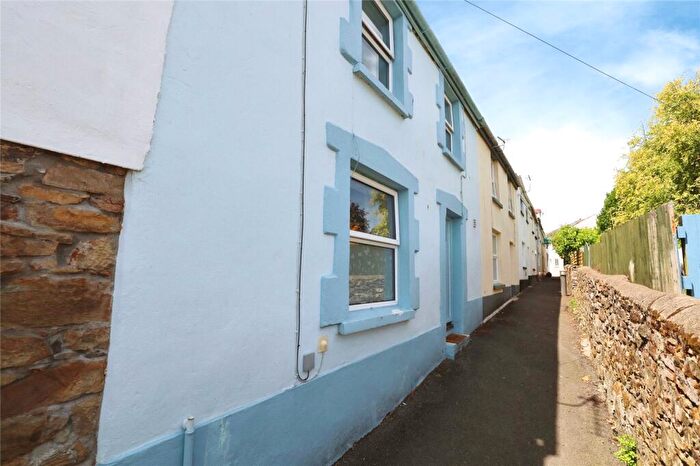
![]()
If you are looking to sell your house, let it out, or receive a property valuation, an expert can help you.
Click the button below to get started.
Roads and Postcodes in Orchard Hill
Navigate through our locations to find the location of your next house in Orchard Hill, Bideford for sale or to rent.
| Streets | Postcodes |
|---|---|
| Adrian Close | EX39 2LX |
| Appletree Gardens | EX39 3SL |
| Chanters Road | EX39 2LP EX39 2LR EX39 2QN EX39 2QP EX39 2QU |
| Chantry Avenue | EX39 2QW |
| Chircombe Lane | EX39 2RQ |
| Cintra Terrace | EX39 2LT |
| First Raleigh | EX39 3NJ |
| Fordlands Crescent | EX39 3NL EX39 3NN |
| Glen Gardens | EX39 3PH |
| Glenburnie Road | EX39 2LA EX39 2LW |
| Glenfield Road | EX39 2LU |
| Glentorr Road | EX39 2LS |
| Hampton Park | EX39 3BR |
| Hanson Park | EX39 3SA EX39 3SB EX39 3SD |
| Heywood Road | EX39 3PJ EX39 3PQ EX39 3QA EX39 3QB |
| Hilltop Road | EX39 3PA |
| Kenwith Road | EX39 3NW |
| Lenwood Park | EX39 3PD |
| Mount Raleigh Avenue | EX39 3NR |
| Mount Raleigh Drive | EX39 3NF |
| Nilgala Close | EX39 3NS EX39 3NT |
| Northam Road | EX39 3NQ |
| Northdene | EX39 3NZ |
| Orchard Gardens | EX39 2QZ |
| Orchard Hill | EX39 2QY EX39 2RA |
| Orchard Rise | EX39 2RB |
| Padshall Park | EX39 3NE |
| Raleigh Hill | EX39 3NX EX39 3NY EX39 3PB |
| Ridgeway Terrace | EX39 2QX |
| Riverside Close | EX39 2RX |
| Southcott Road | EX39 3NP |
| Southwood Drive | EX39 2LN |
| Woodland Park | EX39 2RP |
Property price trends in Orchard Hill
According to the latest Land Registry data, the average home in Orchard Hill sold for £326,375 in 2026. That figure comes from 1,076 sales logged over the past 31 years.
Prices have softened over the last three years. Compared with 2023, when the typical sale came in around £336,261, that's a fall of roughly 2.9%.
Looking back five years, average prices are down about 11.5% since 2021, a drop of around £42,525 in cash terms.
Zoom out to the past decade for the fuller picture. Back in 2016, homes here averaged £269,396, so the typical sold price has climbed about 21.2% since then, roughly 1.9% a year. Stretch the view to fifteen years and that annual pace edges up closer to 2.6%.
Frequently asked questions about Orchard Hill
What is the average price for a property for sale in Orchard Hill?
The average price for a property for sale in Orchard Hill is £371,821. This amount is 21% higher than the average price in Bideford. There are 1,241 property listings for sale in Orchard Hill.
What streets have the most expensive properties for sale in Orchard Hill?
The streets with the most expensive properties for sale in Orchard Hill are Hilltop Road at an average of £675,000, Heywood Road at an average of £607,000 and Orchard Hill at an average of £525,625.
What streets have the most affordable properties for sale in Orchard Hill?
The streets with the most affordable properties for sale in Orchard Hill are Chantry Avenue at an average of £200,000, Ridgeway Terrace at an average of £215,000 and Riverside Close at an average of £265,850.
Which train stations are available in or near Orchard Hill?
Some of the train stations available in or near Orchard Hill are Barnstaple, Chapelton and Umberleigh.
Property Price Paid in Orchard Hill by Year
The average sold property price by year was:
| Year | Average Sold Price | Price Change |
Sold Properties
|
|---|---|---|---|
| 2026 | £326,375 | -30% |
4 Properties |
| 2025 | £424,408 | 21% |
30 Properties |
| 2024 | £335,833 | -0,1% |
21 Properties |
| 2023 | £336,261 | -54% |
18 Properties |
| 2022 | £517,983 | 29% |
30 Properties |
| 2021 | £368,900 | 9% |
46 Properties |
| 2020 | £335,161 | 11% |
43 Properties |
| 2019 | £298,998 | -1% |
31 Properties |
| 2018 | £301,513 | -8% |
34 Properties |
| 2017 | £326,805 | 18% |
26 Properties |
Property Price per Property Type in Orchard Hill
Here you can find historic sold price data in order to help with your property search.
The average Property Paid Price for specific property types in the last three years are:
| Property Type | Average Sold Price | Sold Properties |
|---|---|---|
| Semi Detached House | £344,260.00 | 23 Semi Detached Houses |
| Detached House | £407,280.00 | 39 Detached Houses |
| Terraced House | £303,727.00 | 11 Terraced Houses |
