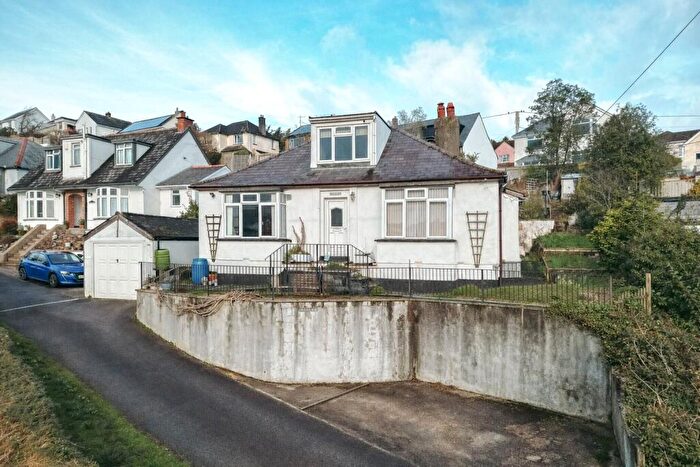
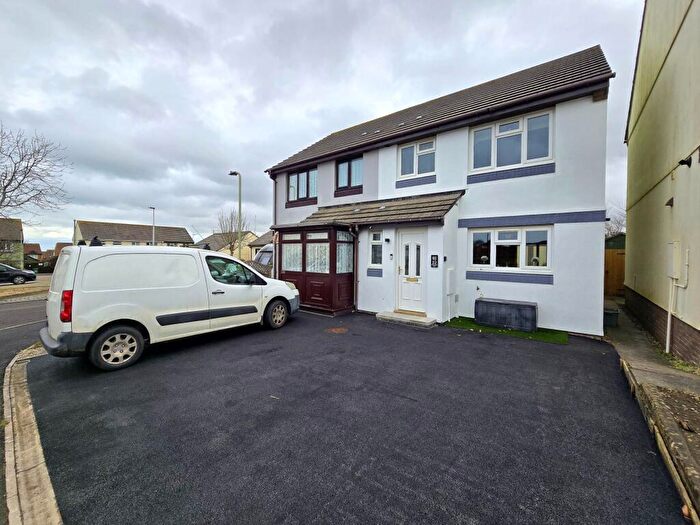
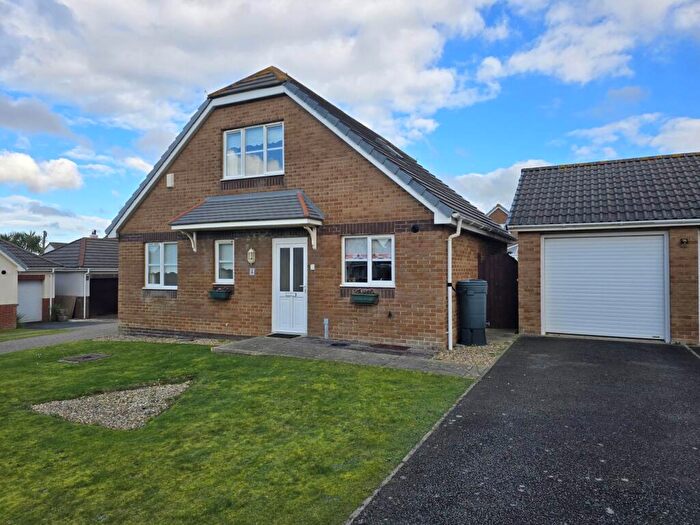
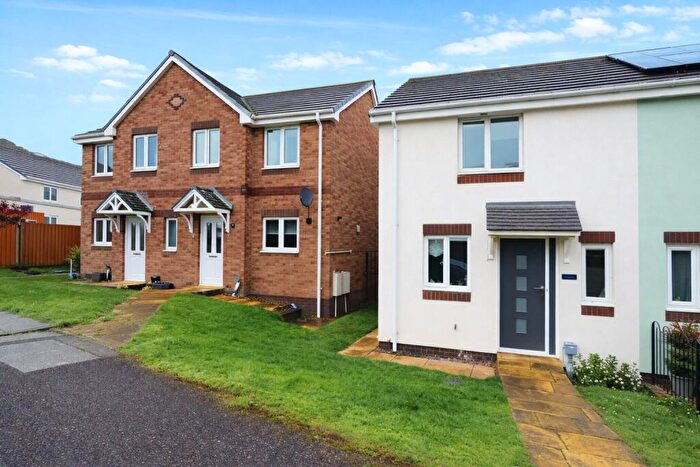
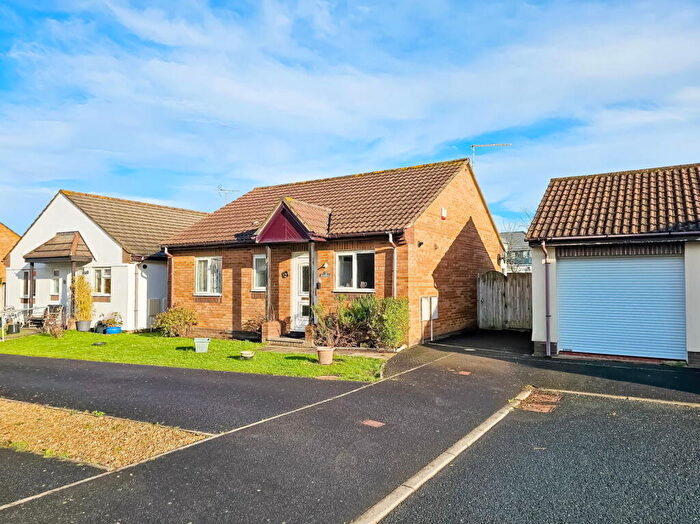
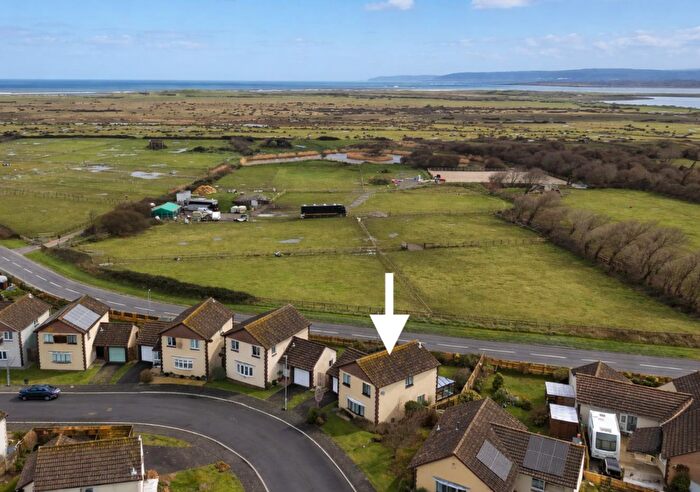
Houses for sale & to rent in Northam, Bideford
House Prices in Northam
Properties in Northam have an average house price of £340,290.00 and had 291 Property Transactions within the last 3 years¹.
Northam is an area in Bideford, Devon with 2,631 households², where the most expensive property was sold for £1,495,000.00.
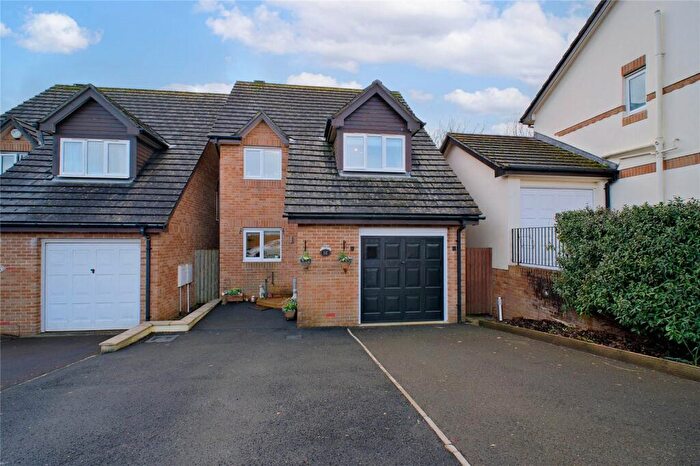
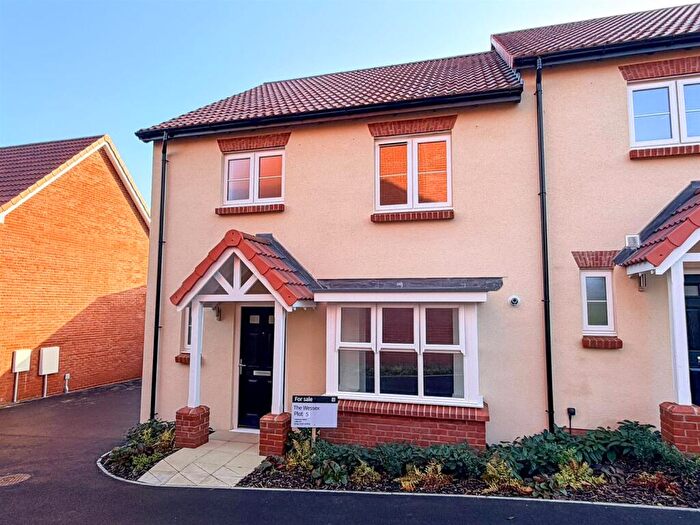
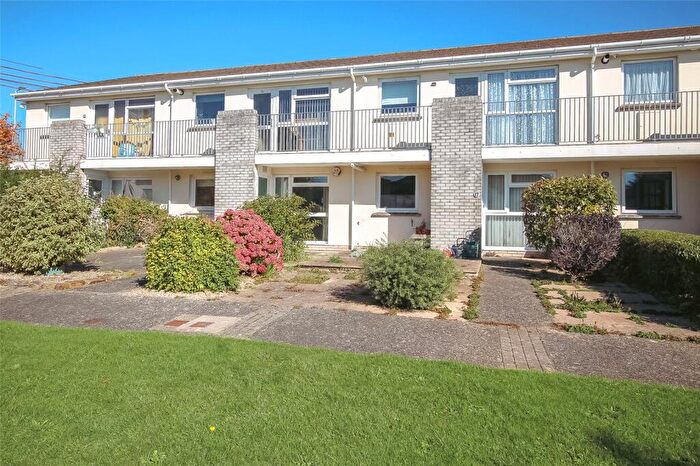
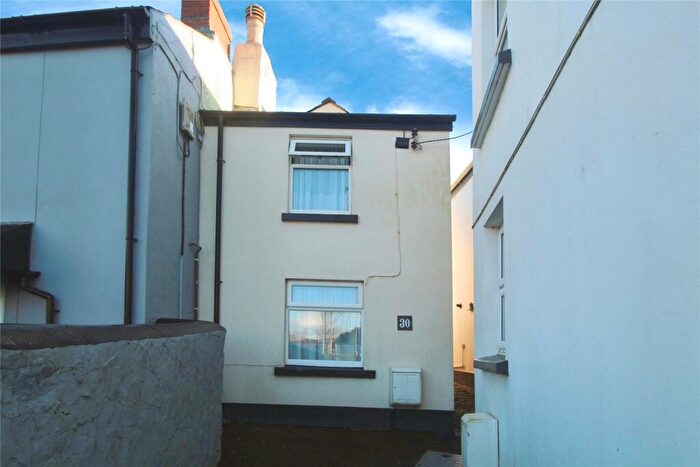
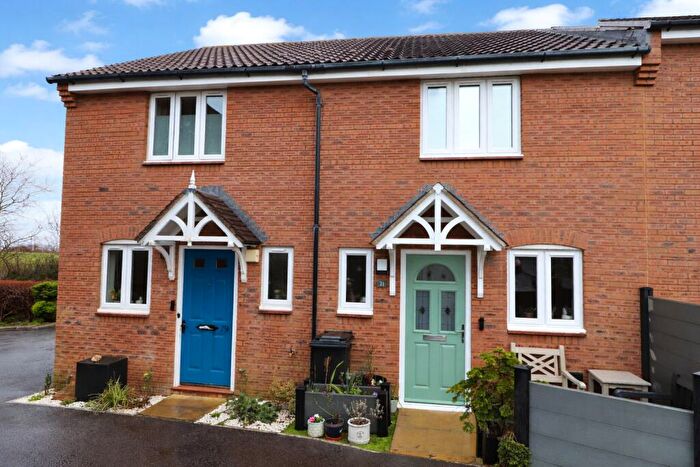
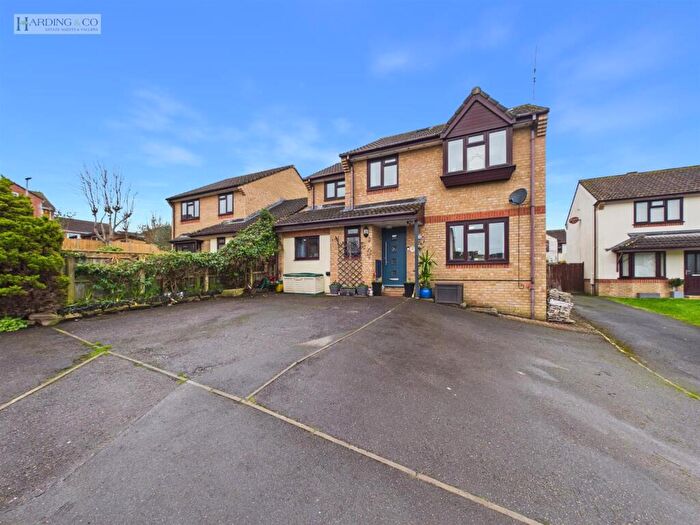
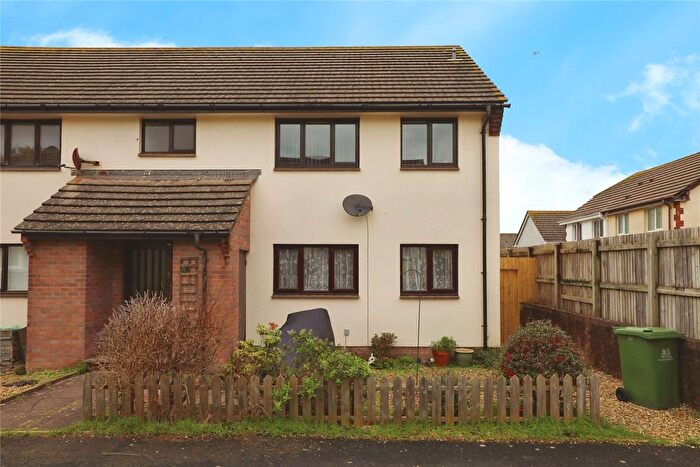
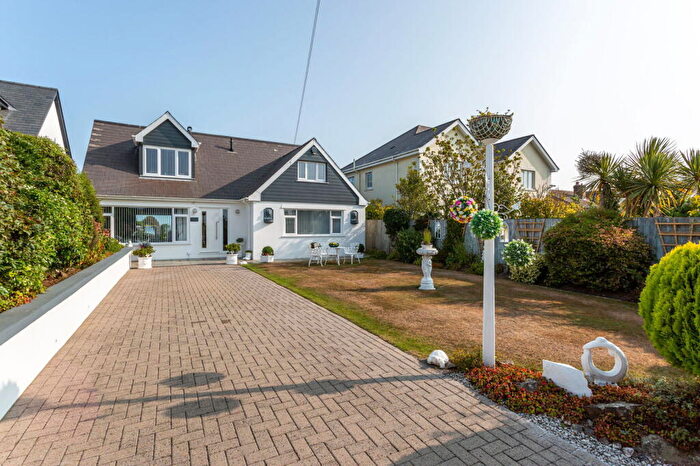
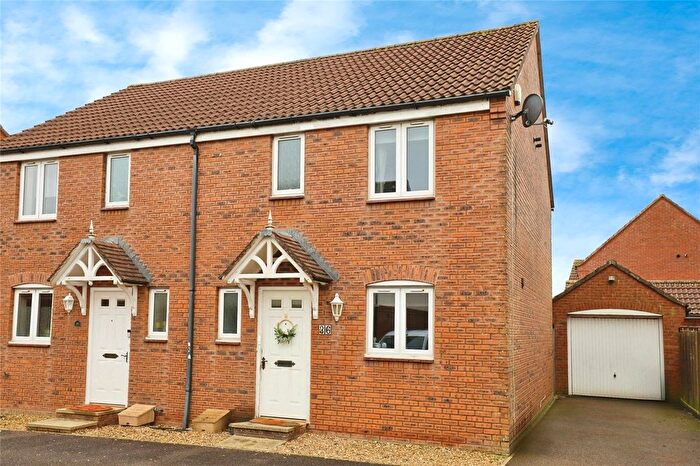
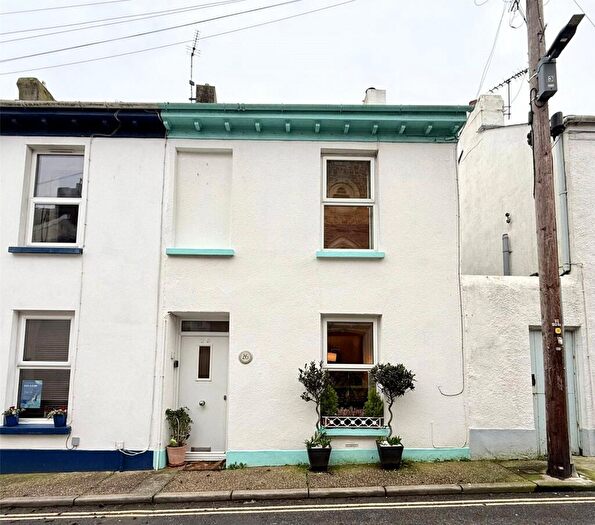
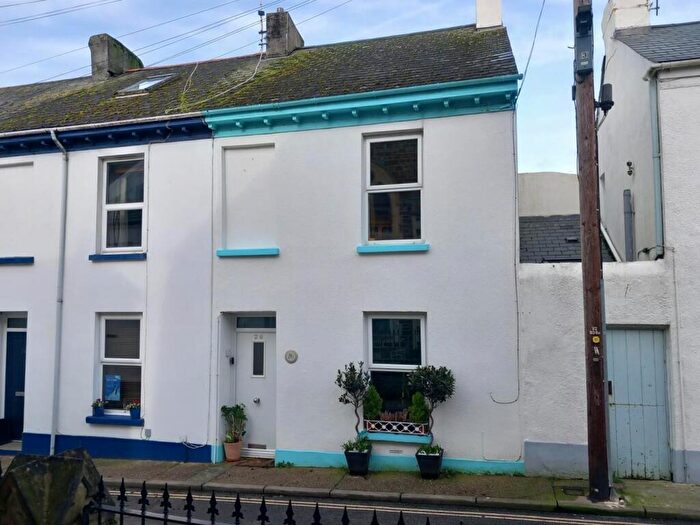
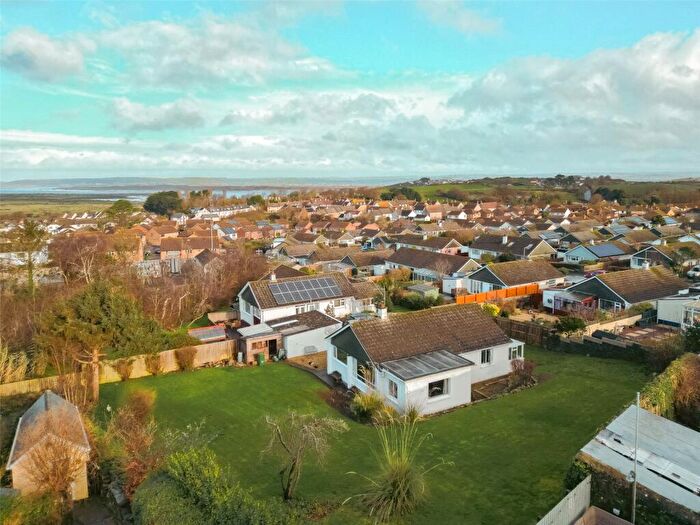
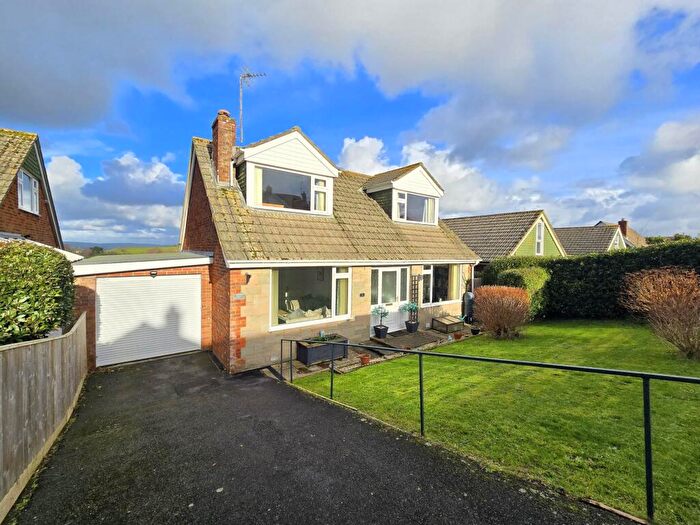
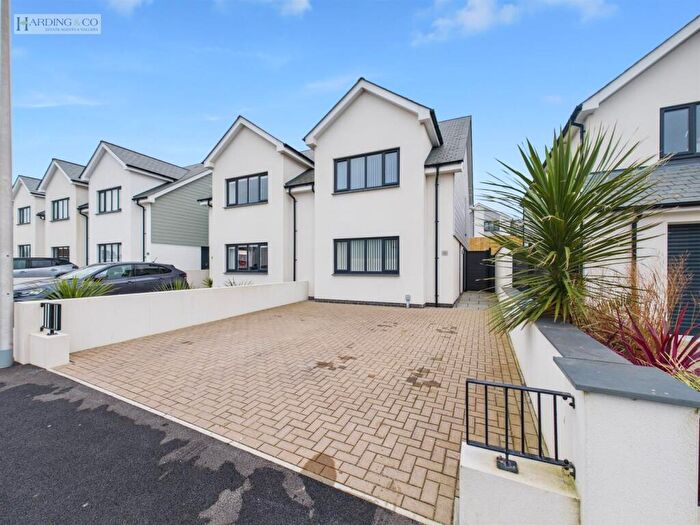
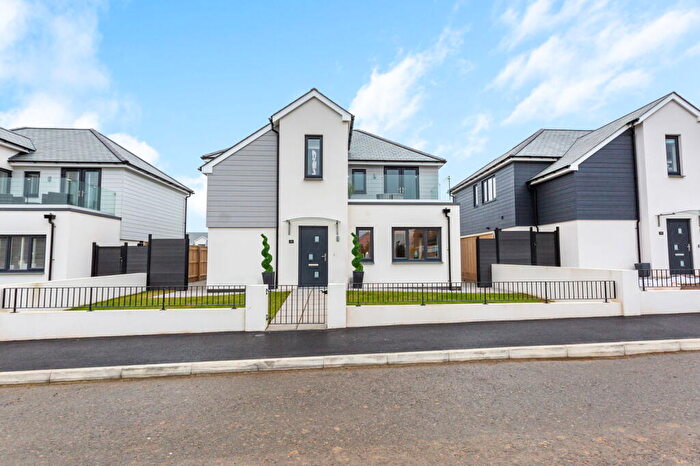
Properties for sale in Northam
Roads and Postcodes in Northam
Navigate through our locations to find the location of your next house in Northam, Bideford for sale or to rent.
| Streets | Postcodes |
|---|---|
| Admirals Court | EX39 1SX |
| Alexandra Terrace | EX39 1EE |
| Amyas Way | EX39 1UT |
| Atlanta View | EX39 1WG |
| Atlantic Way | EX39 1JG |
| Aysha Gardens | EX39 1HJ |
| Bay View Road | EX39 1AY EX39 1BH EX39 1AZ |
| Bayview Court | EX39 1TJ |
| Beach Road | EX39 1HQ |
| Benson Drive | EX39 1UX EX39 1UY |
| Boulevard Way | EX39 1WF |
| Bradford Court | EX39 1AP |
| Britannia Way | EX39 1UP |
| Burrough House Gardens | EX39 1FF |
| Burrough Lawn | EX39 1AU |
| Burrough Road | EX39 1BU |
| Castle Street | EX39 1AT |
| Causeway Close | EX39 1SN |
| Century Drive | EX39 1BG |
| Chope Road | EX39 3QE |
| Churchill Way | EX39 1DB EX39 1DF EX39 1NX EX39 1SU |
| Clevelands Park | EX39 3QH |
| Clifton Terrace | EX39 1EA |
| Cluden Road | EX39 3QF |
| Commodore Close | EX39 1UR |
| Conybeare Drive | EX39 1TH |
| Coral Avenue | EX39 1UW |
| Cowpark Terrace | EX39 1EG |
| Cross Street | EX39 1BS EX39 1BX |
| Daddon Hill | EX39 3PW |
| Dane Court | EX39 1UA |
| Daneshay | EX39 1DG |
| Deans Close | EX39 1EJ |
| Diddywell Road | EX39 1ED |
| Dolphin Court | EX39 1BQ |
| Durrant Close | EX39 2RW |
| Durrant Lane | EX39 2RL |
| Eastbourne Terrace | EX39 1HG |
| Edwards Drive | EX39 1XW |
| Elmfield Terrace | EX39 1DX |
| Ensign Court | EX39 1UN |
| Fairlea Crescent | EX39 1BD |
| Fairlea Gardens | EX39 3RZ |
| Fore Street | EX39 1AN EX39 1AW |
| Foxhill | EX39 1AX EX39 1BN EX39 1BP EX39 1BW |
| Foxhole Lane | EX39 3QR |
| Galleon Way | EX39 1UJ |
| Glebe Field | EX39 1FB |
| Glebefields | EX39 1AB |
| Glengarth Close | EX39 2RN |
| Goatshill | EX39 1AJ |
| Golf Links Road | EX39 1HD |
| Goodwood Park Road | EX39 2RR |
| Green Gardens | EX39 3QG |
| Greenacre Close | EX39 1DA |
| Grenville Terrace | EX39 1DE |
| Griggs Close | EX39 1BR |
| Heywood Road | EX39 1AL EX39 3QJ EX39 3QQ EX39 3SE EX39 3PG |
| Higher Clevelands | EX39 1AH |
| Highfield | EX39 1BB |
| Honey Street | EX39 1DL |
| Kala Fair | EX39 1TX |
| King Alfred Crescent | EX39 1UE EX39 1UF |
| Kingsley Park | EX39 1UG |
| Lakenham Hill | EX39 1JH EX39 1JW EX39 1JJ |
| Lansdowne Park | EX39 1TS |
| Lenards Road | EX39 1AS |
| Lenwood Road | EX39 3PL EX39 3PN |
| Lily Close | EX39 1EH |
| Lilybridge | EX39 1TL |
| Limers Lane | EX39 2RG |
| Lower Cleave | EX39 2RH EX39 2RJ |
| Lundy View | EX39 1BE |
| Meadow Rise | EX39 3FQ |
| Millennium Way | EX39 1XN |
| Mondeville Way | EX39 1DQ |
| Morwenna Park Road | EX39 1EQ EX39 1ET EX39 1EU |
| Morwenna Terrace | EX39 1DT |
| New Causeway | EX39 1DR |
| Norman Terrace | EX39 1DY |
| North East Street | EX39 1DJ |
| North Street | EX39 1DH |
| Northam Road | EX39 3NH |
| Northcott Gardens | EX39 1EF |
| Oxmans Lane | EX39 1DZ |
| Richmond Park | EX39 1EP EX39 1ER EX39 1ES |
| Ridgeway Avenue | EX39 1TR |
| Ridgeway Close | EX39 1TN |
| Ridgeway Court | EX39 1TP |
| Ridgeway Drive | EX39 1TW |
| Sandymere Gardens | EX39 1XY |
| Sandymere Road | EX39 1EY EX39 1EZ |
| Searle Terrace | EX39 1DD |
| Seaview Road | EX39 1EL |
| Shoreland Way | EX39 1UD |
| Silford Road | EX39 3PR EX39 3PS |
| South Lea | EX39 3PF |
| Spring Close | EX39 1TY |
| Springfield Crescent | EX39 1DP |
| Springfield Terrace | EX39 1DN EX39 1DW |
| St Teresas Close | EX39 1EB |
| St Teresas Court | EX39 1EX |
| Tadworthy Road | EX39 1JN EX39 1JP |
| The Fairways | EX39 1TQ |
| The Links | EX39 1LS |
| The Square | EX39 1AR |
| Tower Street | EX39 1JL |
| Tudor Close | EX39 3QD |
| Venton Drive | EX39 1HL EX39 1HN |
| Windmill Lane | EX39 1BZ EX39 1BY |
| Windsor Road | EX39 1EN EX39 1EW |
| Witten Gardens | EX39 3RE |
| Wren Close | EX39 1UU |
Transport near Northam
- FAQ
- Price Paid By Year
- Property Type Price
Frequently asked questions about Northam
What is the average price for a property for sale in Northam?
The average price for a property for sale in Northam is £340,290. This amount is 11% higher than the average price in Bideford. There are 695 property listings for sale in Northam.
What streets have the most expensive properties for sale in Northam?
The streets with the most expensive properties for sale in Northam are Goatshill at an average of £1,018,750, Tadworthy Road at an average of £911,666 and Burrough House Gardens at an average of £745,000.
What streets have the most affordable properties for sale in Northam?
The streets with the most affordable properties for sale in Northam are Lilybridge at an average of £126,583, Kala Fair at an average of £137,850 and The Square at an average of £144,375.
Which train stations are available in or near Northam?
Some of the train stations available in or near Northam are Barnstaple, Chapelton and Umberleigh.
Property Price Paid in Northam by Year
The average sold property price by year was:
| Year | Average Sold Price | Price Change |
Sold Properties
|
|---|---|---|---|
| 2025 | £328,552 | -6% |
83 Properties |
| 2024 | £346,937 | 1% |
119 Properties |
| 2023 | £342,349 | -1% |
89 Properties |
| 2022 | £344,935 | 17% |
114 Properties |
| 2021 | £287,515 | 0,1% |
152 Properties |
| 2020 | £287,271 | 9% |
99 Properties |
| 2019 | £261,844 | 1% |
122 Properties |
| 2018 | £259,254 | 4% |
131 Properties |
| 2017 | £249,489 | 6% |
135 Properties |
| 2016 | £235,202 | -0,5% |
128 Properties |
| 2015 | £236,323 | 8% |
147 Properties |
| 2014 | £218,361 | 5% |
159 Properties |
| 2013 | £208,015 | -1% |
147 Properties |
| 2012 | £210,382 | 3% |
113 Properties |
| 2011 | £204,264 | -13% |
87 Properties |
| 2010 | £231,581 | 8% |
116 Properties |
| 2009 | £213,932 | -6% |
123 Properties |
| 2008 | £227,787 | 3% |
70 Properties |
| 2007 | £220,787 | 11% |
169 Properties |
| 2006 | £196,305 | 8% |
199 Properties |
| 2005 | £180,998 | 1% |
144 Properties |
| 2004 | £180,005 | 20% |
186 Properties |
| 2003 | £144,438 | 19% |
156 Properties |
| 2002 | £116,704 | 18% |
241 Properties |
| 2001 | £95,641 | 17% |
228 Properties |
| 2000 | £79,199 | 14% |
213 Properties |
| 1999 | £67,767 | 6% |
199 Properties |
| 1998 | £63,847 | 8% |
153 Properties |
| 1997 | £58,488 | -2% |
163 Properties |
| 1996 | £59,520 | -5% |
144 Properties |
| 1995 | £62,236 | - |
115 Properties |
Property Price per Property Type in Northam
Here you can find historic sold price data in order to help with your property search.
The average Property Paid Price for specific property types in the last three years are:
| Property Type | Average Sold Price | Sold Properties |
|---|---|---|
| Semi Detached House | £254,648.00 | 39 Semi Detached Houses |
| Detached House | £447,238.00 | 144 Detached Houses |
| Terraced House | £254,632.00 | 79 Terraced Houses |
| Flat | £157,756.00 | 29 Flats |

