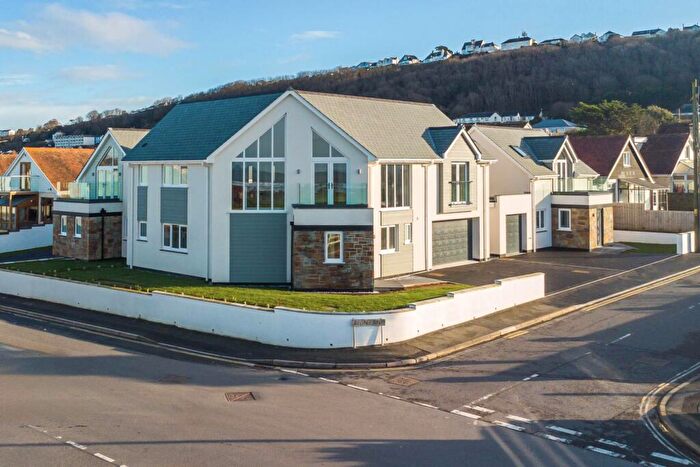
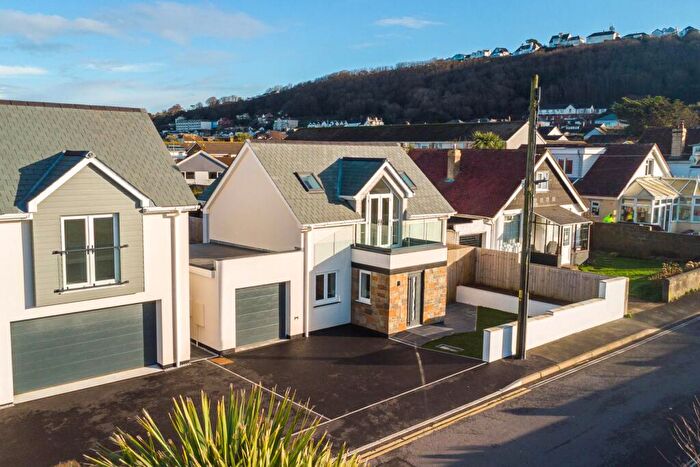
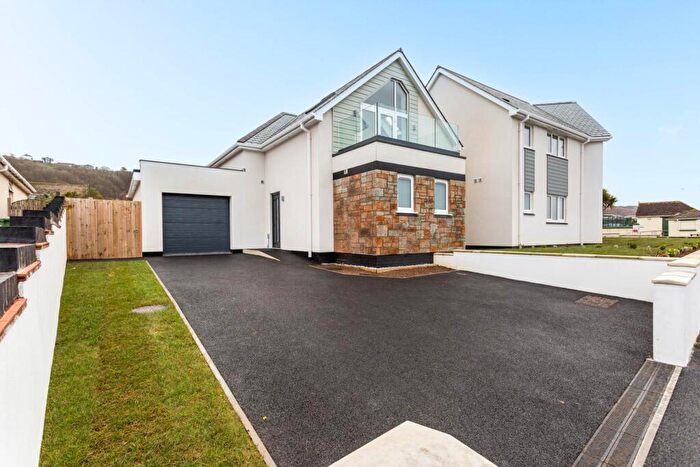
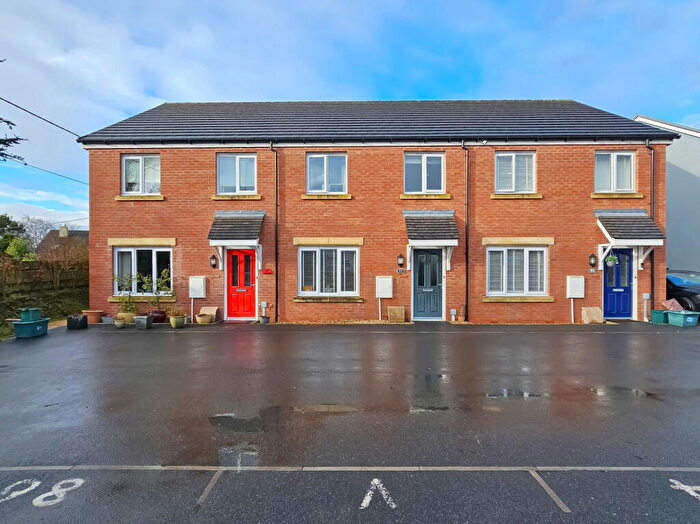
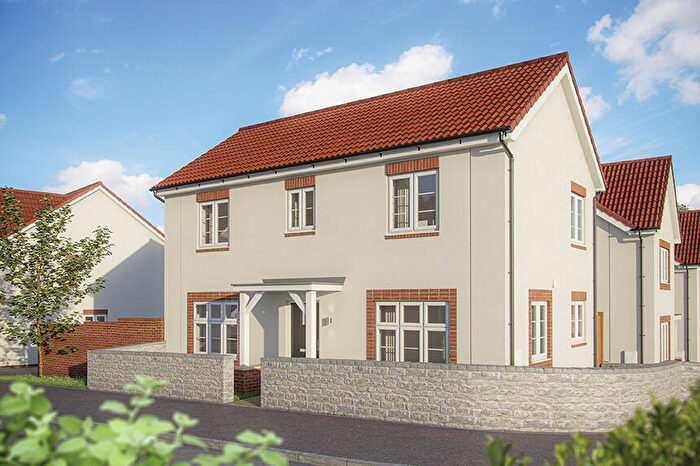
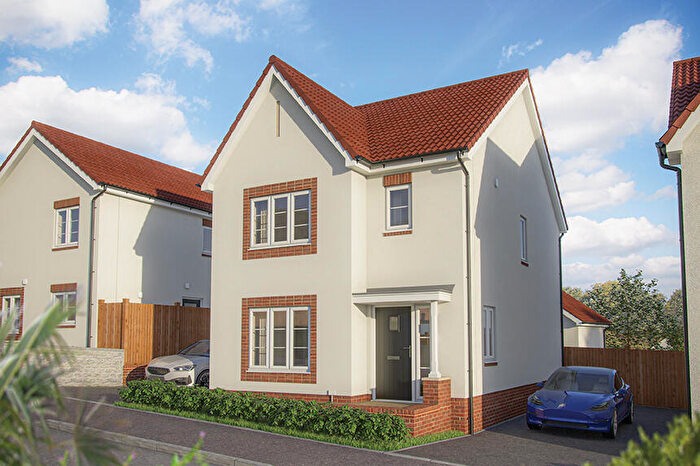
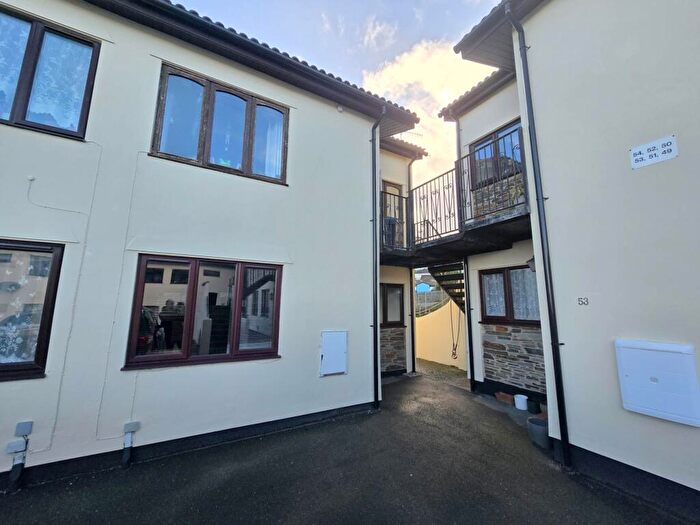
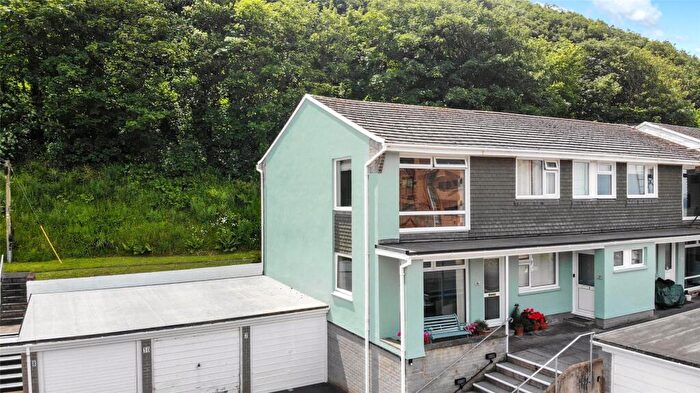
Houses for sale & to rent in Westward Ho!, Bideford
House Prices in Westward Ho!
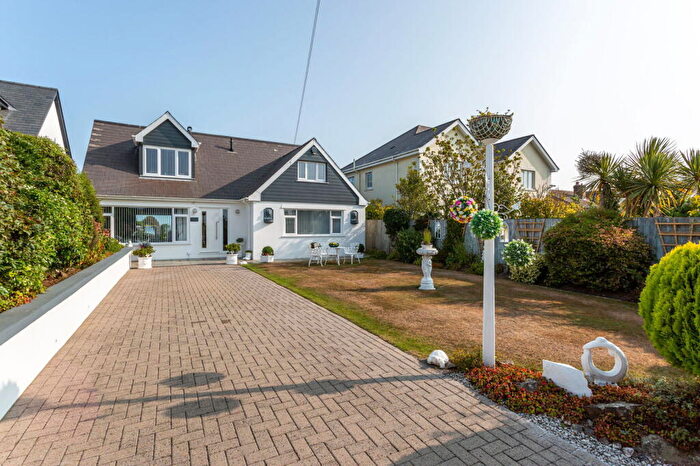
Properties in Westward Ho! have an average house price of £342,627.00 and had 148 Property Transactions within the last 3 years¹.
Westward Ho! is an area in Bideford, Devon with 1,090 households², where the most expensive property was sold for £840,000.00.
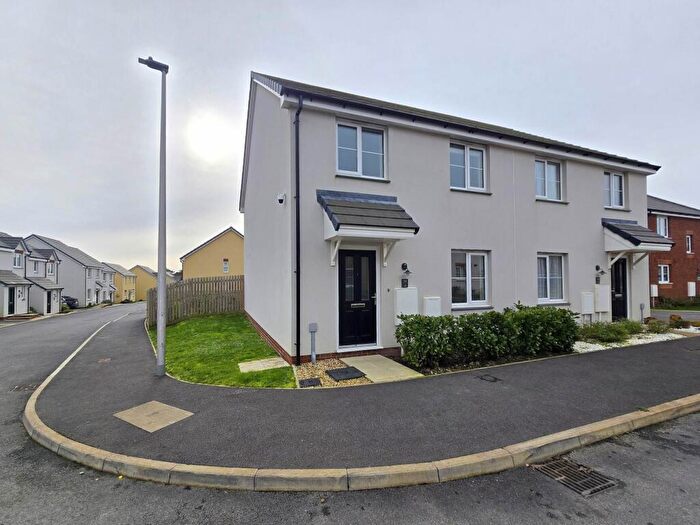
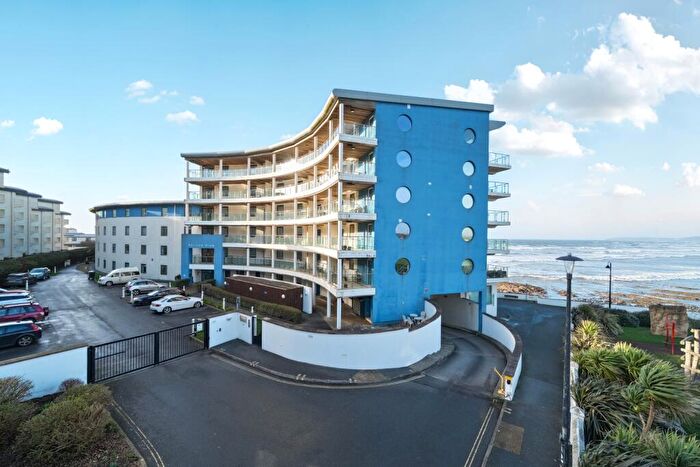
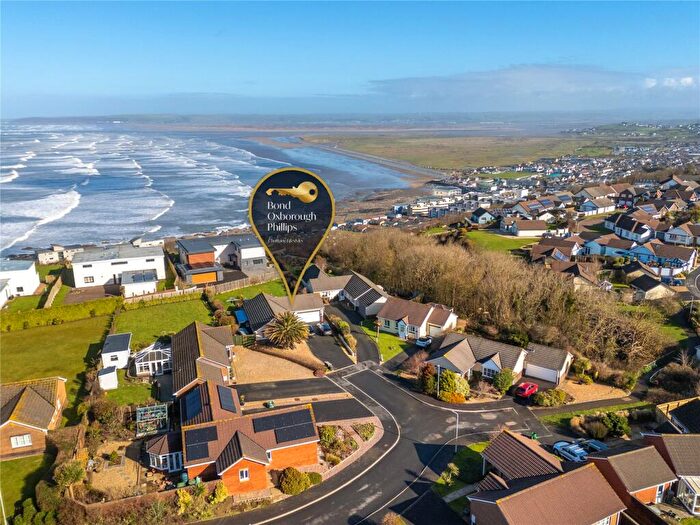
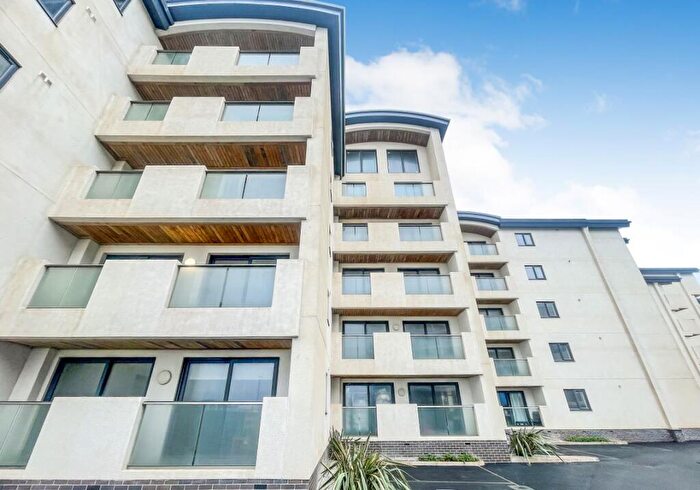
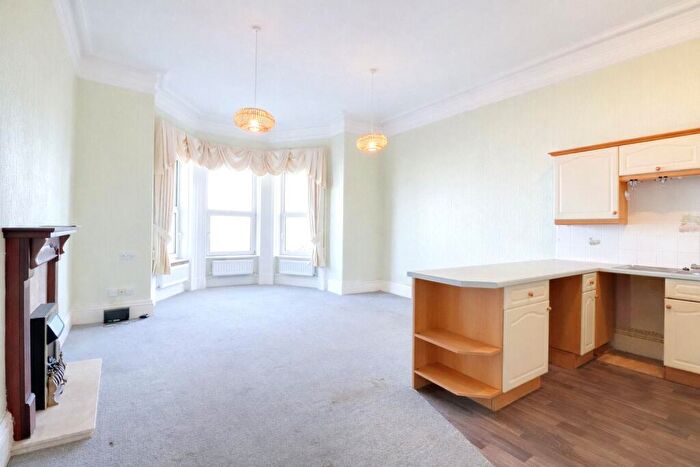
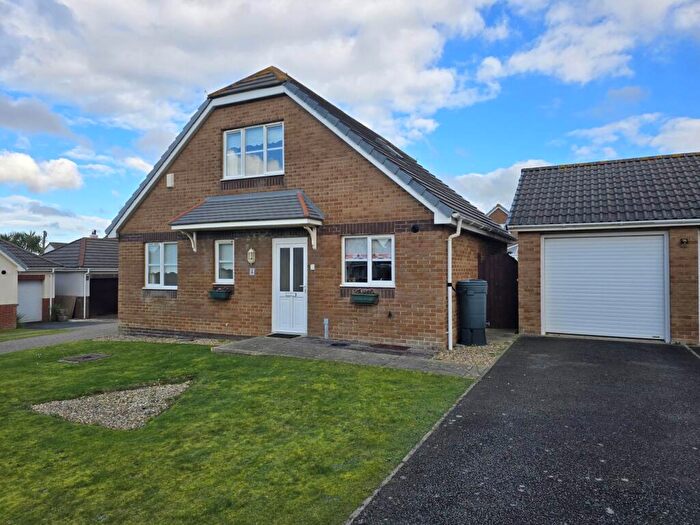
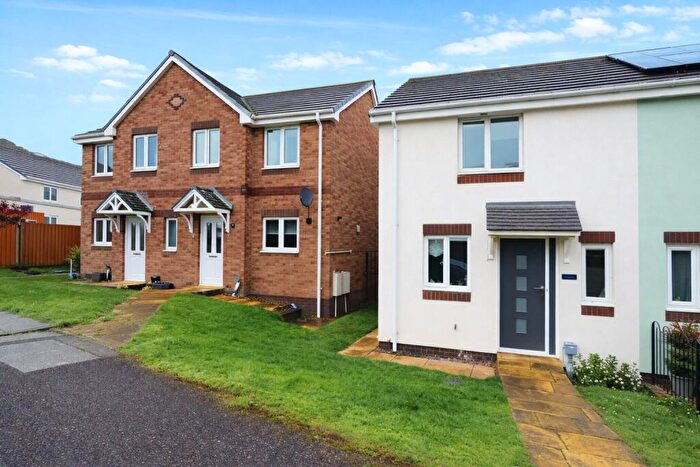
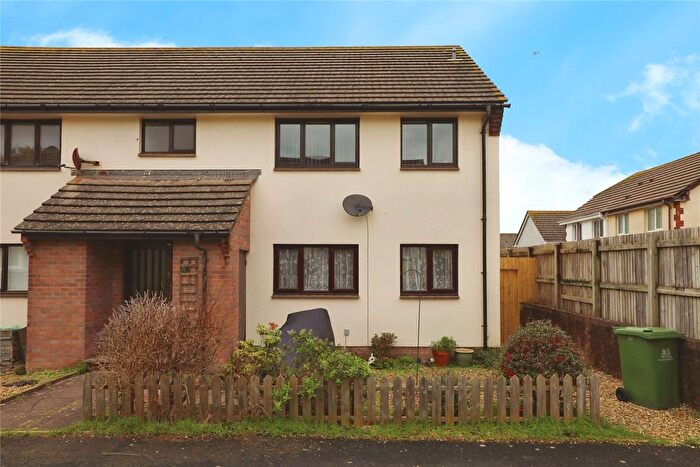
Properties for sale in Westward Ho!
Roads and Postcodes in Westward Ho!
Navigate through our locations to find the location of your next house in Westward Ho!, Bideford for sale or to rent.
| Streets | Postcodes |
|---|---|
| Armada Way | EX39 1XB |
| Atlantic Way | EX39 1HX EX39 1JD EX39 1NA |
| Avon Lane | EX39 1LR EX39 1LW |
| Bath Hotel Road | EX39 1GW EX39 1GX EX39 1LE |
| Bay View Road | EX39 1AF EX39 1BJ |
| Beresford Drive | EX39 1FW |
| Blyth Court | EX39 1XF |
| Buckleigh Grange | EX39 3FD |
| Buckleigh Road | EX39 3PU EX39 3PX |
| Channer Place | EX39 3FL |
| Chichester Way | EX39 1XG |
| Cleveland Terrace | EX39 1JR |
| Clifton Court | EX39 1AD |
| College Close | EX39 1BL |
| Cornborough Road | EX39 1AA |
| Crofts Way | EX39 1FU |
| Curlew Drive | EX39 1GR |
| Drake Close | EX39 1XA |
| Dudley Way | EX39 1XD |
| Dune View | EX39 1UH |
| Fosketh Hill | EX39 1UL |
| Fosketh Terrace | EX39 1AG |
| Francis Drive | EX39 1XE |
| Gainsborough Drive | EX39 1XQ |
| Golf Links Road | EX39 1HH EX39 1LH EX39 1SY |
| Graham Way | EX39 3FN |
| Greenway Drive | EX39 1FG |
| Highview Terrace | EX39 1AQ |
| Inglebrook Heights | EX39 1GU |
| Kingsley Gardens | EX39 1FZ |
| Kingsley Road | EX39 1JA EX39 1JB |
| Kipling Fields | EX39 1FT |
| Kipling Terrace | EX39 1HY |
| Marlow Court | EX39 1HW |
| Merley Road | EX39 1GZ EX39 1JS EX39 1JU EX39 1LB EX39 1FL EX39 1JX |
| Nelson Mews | EX39 1GY |
| Nelson Road | EX39 1HS EX39 1LD EX39 1LF EX39 1LQ |
| Nelson Terrace | EX39 1LG |
| Old Stone Close | EX39 1XH |
| Park Avenue | EX39 1LP |
| Parkview Terrace | EX39 1LN |
| Pavilion View | EX39 1FN |
| Pebble Close | EX39 1FD |
| Pelican Close | EX39 1XT |
| Pines Close | EX39 1FS |
| Queen Elizabeth Court | EX39 1XP |
| Queens Close | EX39 1FH |
| Roslyn Gardens | EX39 1FP |
| Rudyard Way | EX39 1XL |
| Sandymere Road | EX39 1XX |
| Springfield Terrace | EX39 1LJ |
| Stables Court | EX39 1LY |
| Stanwell Drive | EX39 1HE |
| Stanwell Hill | EX39 1AE EX39 1TZ |
| Swallow Rise | EX39 1GL |
| Swanswood Gardens | EX39 1HP EX39 1HR |
| Taylor Crescent | EX39 3FA |
| The Rocks | EX39 1UQ |
| Tors View | EX39 1XJ |
| Torville Park | EX39 1US |
| Trinity Court | EX39 1LT |
| Westbourne Terrace | EX39 1LL |
| Woodpecker Close | EX39 1GS |
| Youngaton Road | EX39 1HU |
Transport near Westward Ho!
- FAQ
- Price Paid By Year
- Property Type Price
Frequently asked questions about Westward Ho!
What is the average price for a property for sale in Westward Ho!?
The average price for a property for sale in Westward Ho! is £342,627. This amount is 11% higher than the average price in Bideford. There are 696 property listings for sale in Westward Ho!.
What streets have the most expensive properties for sale in Westward Ho!?
The streets with the most expensive properties for sale in Westward Ho! are Pines Close at an average of £628,500, Chichester Way at an average of £575,000 and Dudley Way at an average of £566,666.
What streets have the most affordable properties for sale in Westward Ho!?
The streets with the most affordable properties for sale in Westward Ho! are Nelson Terrace at an average of £126,750, Kipling Terrace at an average of £143,781 and Trinity Court at an average of £202,500.
Which train stations are available in or near Westward Ho!?
Some of the train stations available in or near Westward Ho! are Barnstaple, Chapelton and Umberleigh.
Property Price Paid in Westward Ho! by Year
The average sold property price by year was:
| Year | Average Sold Price | Price Change |
Sold Properties
|
|---|---|---|---|
| 2025 | £307,790 | -24% |
48 Properties |
| 2024 | £380,948 | 10% |
41 Properties |
| 2023 | £344,338 | -5% |
59 Properties |
| 2022 | £362,734 | 4% |
70 Properties |
| 2021 | £346,551 | 7% |
93 Properties |
| 2020 | £321,844 | 14% |
84 Properties |
| 2019 | £276,583 | -7% |
99 Properties |
| 2018 | £297,156 | 9% |
121 Properties |
| 2017 | £270,162 | 3% |
95 Properties |
| 2016 | £263,048 | 1% |
113 Properties |
| 2015 | £260,877 | 10% |
85 Properties |
| 2014 | £233,684 | -2% |
70 Properties |
| 2013 | £238,859 | 13% |
74 Properties |
| 2012 | £208,448 | -2% |
65 Properties |
| 2011 | £212,689 | -12% |
74 Properties |
| 2010 | £239,115 | 5% |
63 Properties |
| 2009 | £227,498 | 1% |
98 Properties |
| 2008 | £225,625 | -3% |
60 Properties |
| 2007 | £231,536 | 10% |
87 Properties |
| 2006 | £208,657 | -1% |
73 Properties |
| 2005 | £210,444 | 11% |
59 Properties |
| 2004 | £187,459 | 2% |
77 Properties |
| 2003 | £184,554 | 19% |
92 Properties |
| 2002 | £150,101 | 29% |
112 Properties |
| 2001 | £107,004 | 7% |
94 Properties |
| 2000 | £99,088 | 10% |
92 Properties |
| 1999 | £89,615 | 11% |
101 Properties |
| 1998 | £80,089 | 17% |
104 Properties |
| 1997 | £66,219 | 15% |
68 Properties |
| 1996 | £56,543 | 3% |
64 Properties |
| 1995 | £54,688 | - |
51 Properties |
Property Price per Property Type in Westward Ho!
Here you can find historic sold price data in order to help with your property search.
The average Property Paid Price for specific property types in the last three years are:
| Property Type | Average Sold Price | Sold Properties |
|---|---|---|
| Semi Detached House | £346,187.00 | 16 Semi Detached Houses |
| Detached House | £464,425.00 | 60 Detached Houses |
| Terraced House | £298,838.00 | 13 Terraced Houses |
| Flat | £227,447.00 | 59 Flats |

