
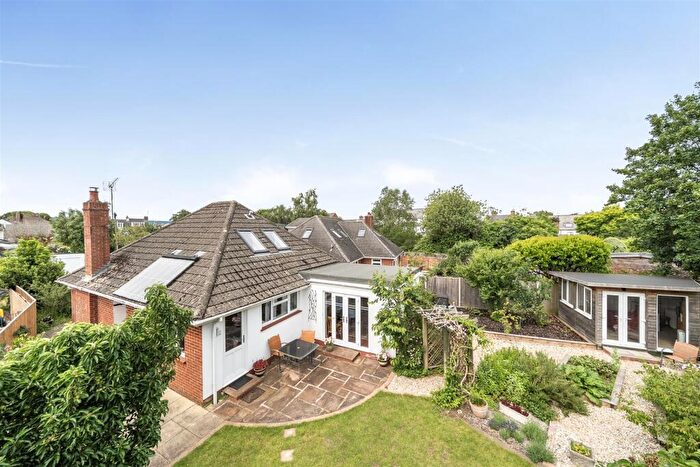
Houses for sale in EX5 1AP, Raleigh, Exeter
House Prices in EX5 1AP, Raleigh
Properties in EX5 1AP have no sales history available within the last 3 years. EX5 1AP is a postcode in Raleigh, an area in Exeter, Devon, with 6 households².
Properties for sale near EX5 1AP
![]()
If you are looking to sell your house, let it out, or receive a property valuation, an expert can help you.
Click the button below to get started.


Price Paid in EX5 1AP, Raleigh
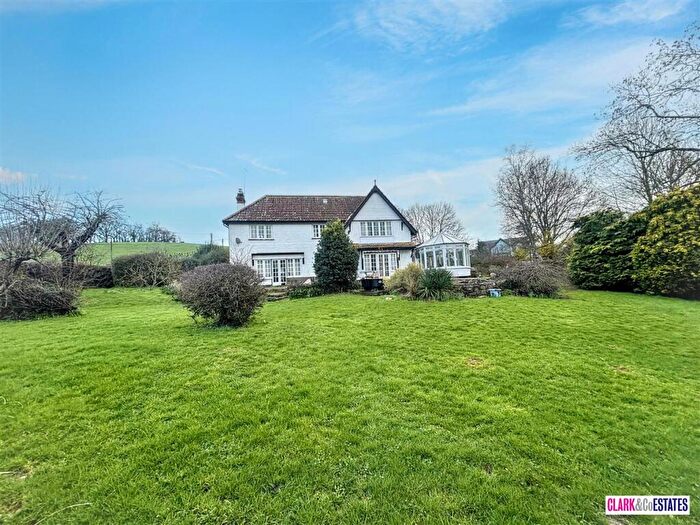
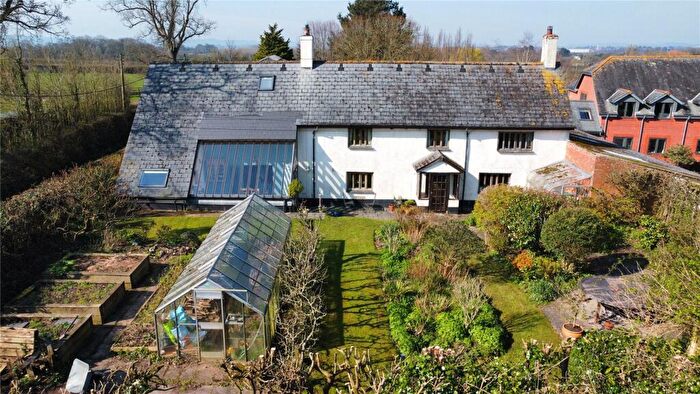
CLYST GRANGE EX5 1AP, Raleigh Exeter
Property CLYST GRANGE has been sold 2 times. The last time it was sold was in 31/10/2007 and the sold price was £695,000.00.
This is a Detached House which was sold as a freehold in 31/10/2007
| Date | Price | Property Type | Tenure | Classification |
|---|---|---|---|---|
| 31/10/2007 | £695,000.00 | Detached House | freehold | Established Building |
| 07/07/2004 | £620,000.00 | Detached House | freehold | Established Building |
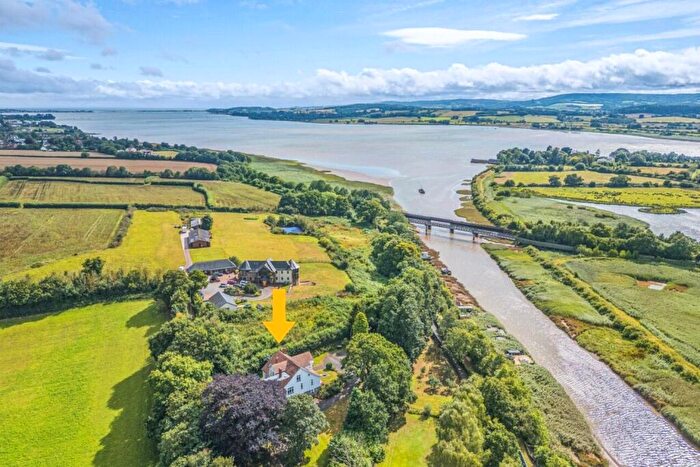
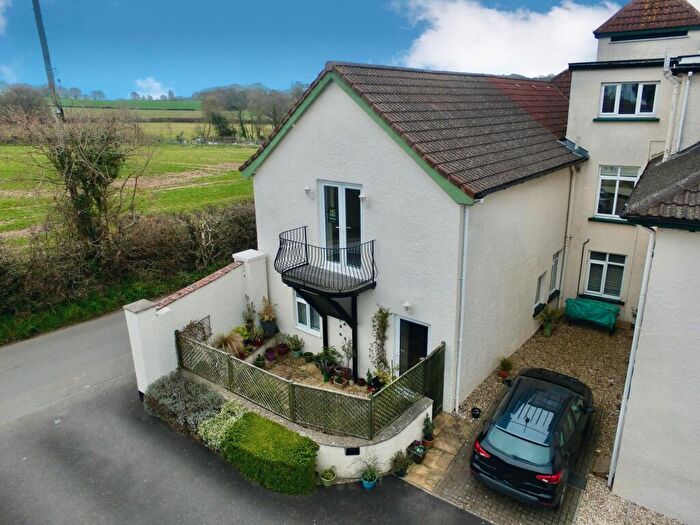
WEST BARN EX5 1AP, Raleigh Exeter
Property WEST BARN has been sold 2 times. The last time it was sold was in 05/08/2003 and the sold price was £377,000.00.
This semi detached house, sold as a freehold on 05/08/2003, is a 137 sqm detached house with an EPC rating of B.
| Date | Price | Property Type | Tenure | Classification |
|---|---|---|---|---|
| 05/08/2003 | £377,000.00 | Semi Detached House | freehold | Established Building |
| 26/07/1999 | £183,000.00 | Semi Detached House | freehold | Established Building |
Property price trends in EX5 1AP
According to the latest Land Registry data, the average home in EX5 1AP sold for £695,000 in 2007. That figure comes from 4 sales logged over the past 8 years.
Prices have continued to climb over the last three years. Compared with 2004, when the typical sale came in around £620,000, that's a rise of roughly 12.1%.
Looking back five years, average prices are up about 84.4% since 2003, a gain of around £318,000 in cash terms.
Zoom out to the past decade for the fuller picture. Back in 1999, homes here averaged £183,000, so the typical sold price has climbed about 279.8% since then, roughly 18.2% a year.
Property Price Paid in EX5 1AP by Year
The average sold property price by year was:
| Year | Average Sold Price | Price Change |
Sold Properties
|
|---|---|---|---|
| 2007 | £695,000 | 11% |
1 Property |
| 2004 | £620,000 | 39% |
1 Property |
| 2003 | £377,000 | 51% |
1 Property |
| 1999 | £183,000 | - |
1 Property |
