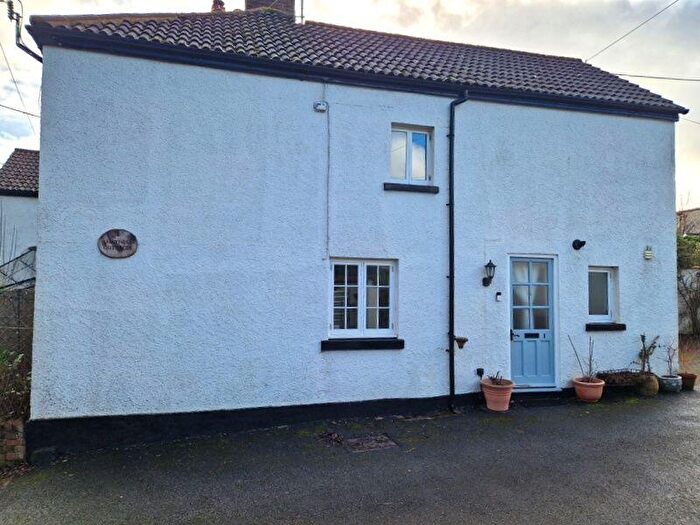
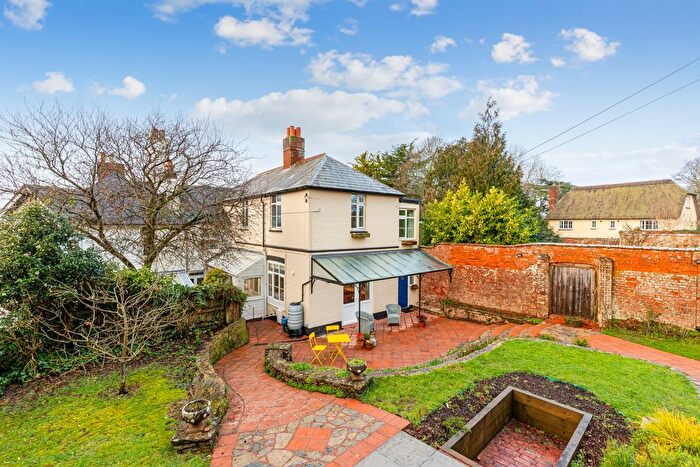
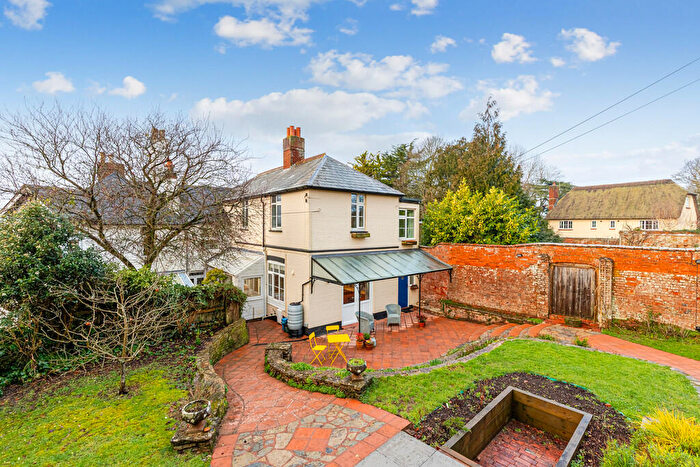
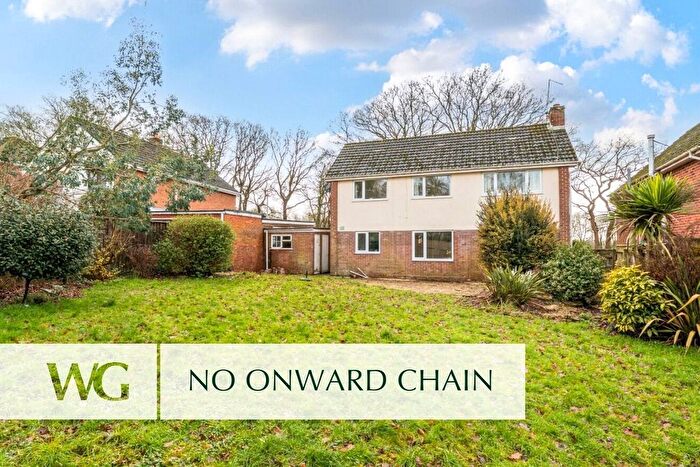
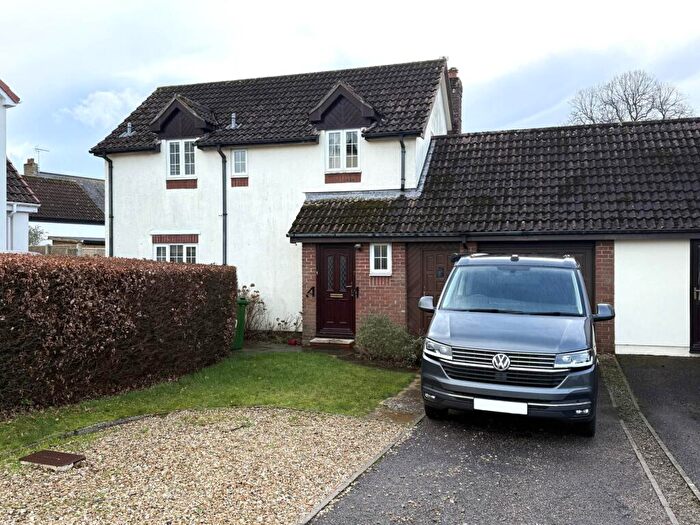
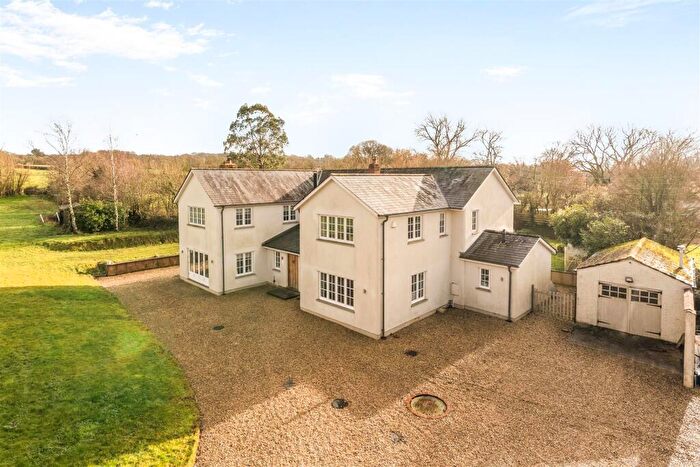
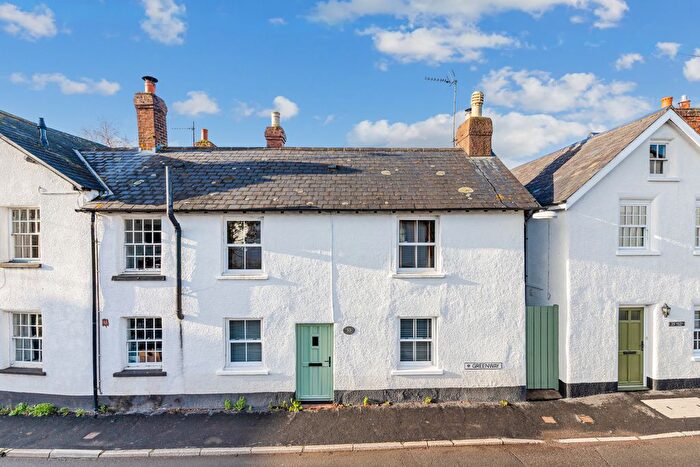
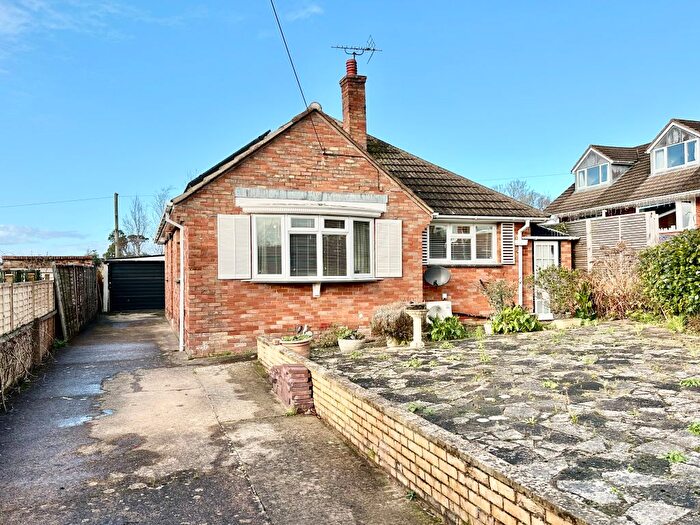
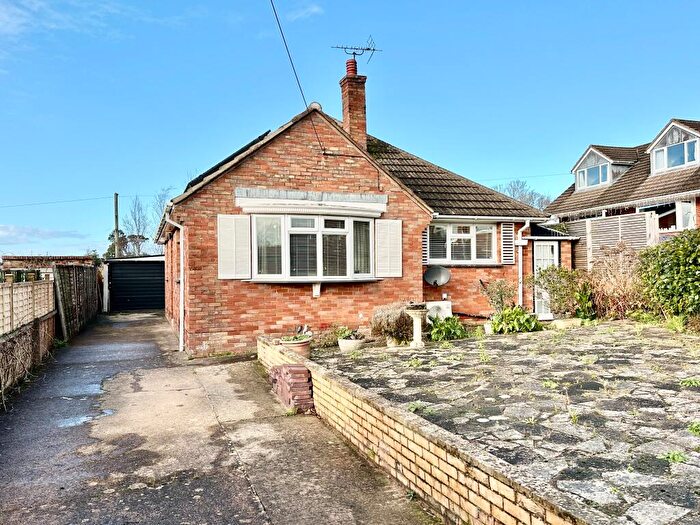
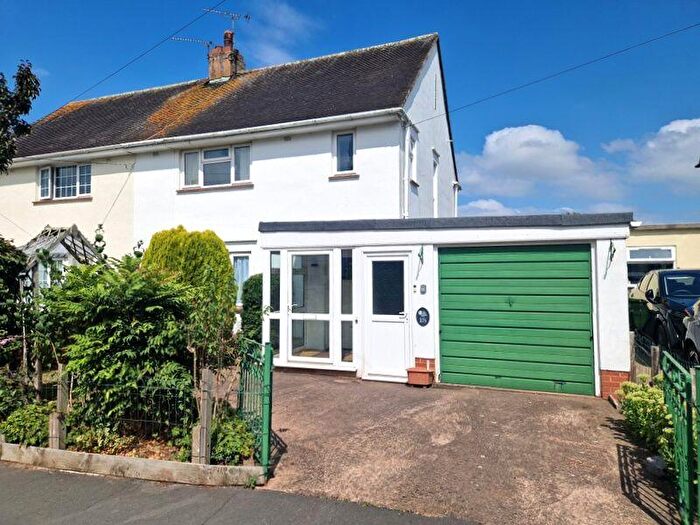
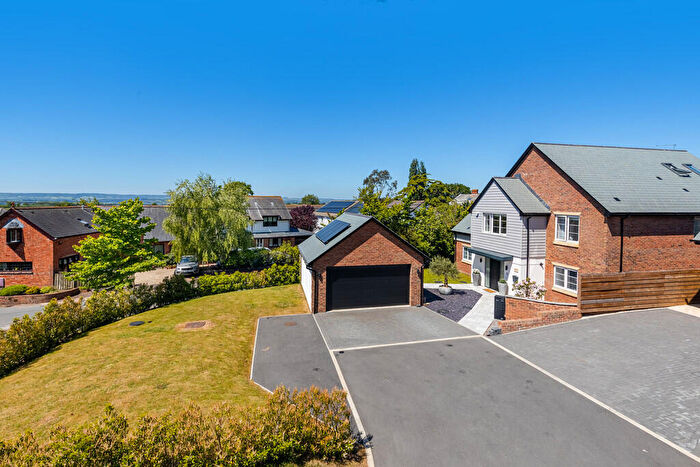
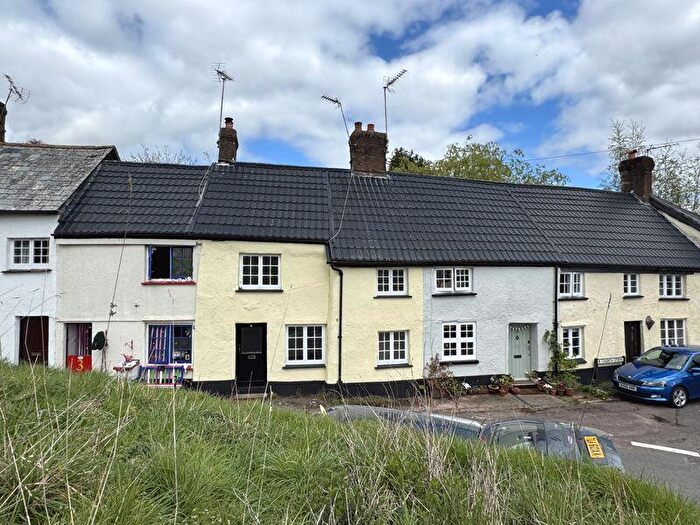
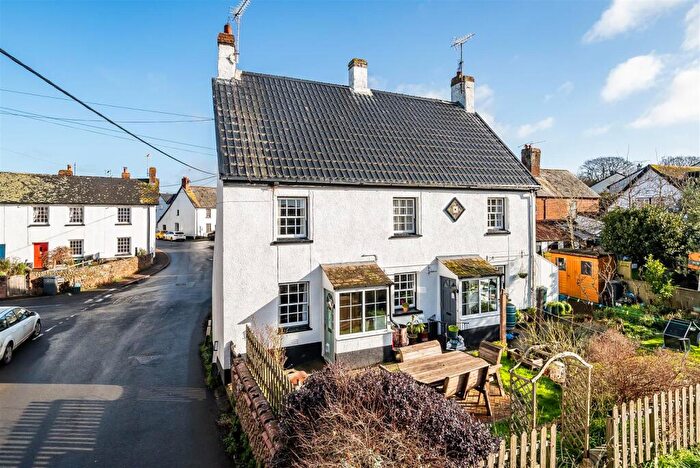
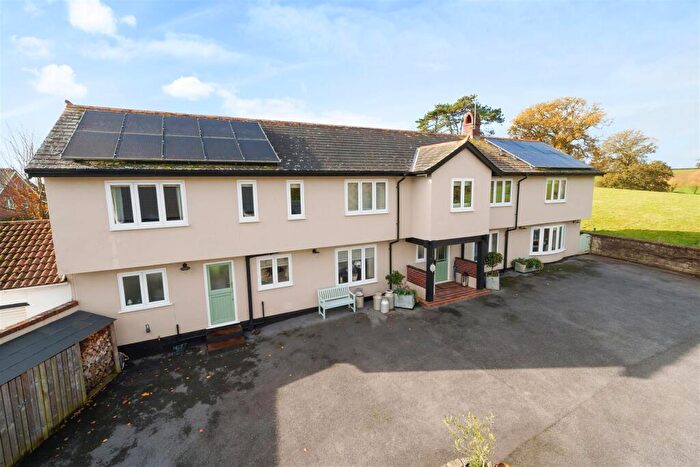
Houses for sale & to rent in Woodbury And Lympstone, Exeter
House Prices in Woodbury And Lympstone
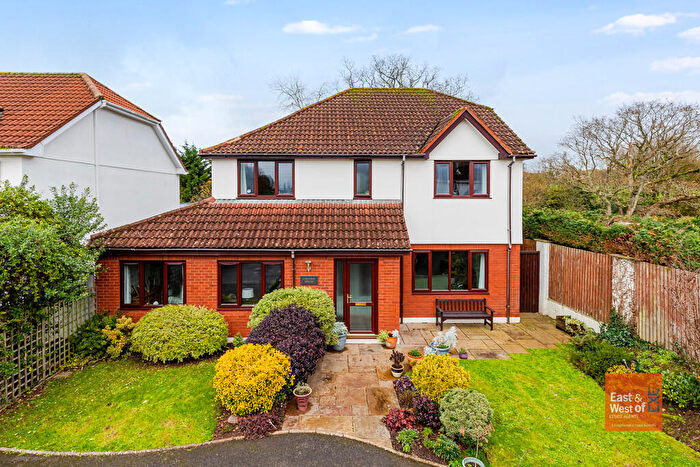
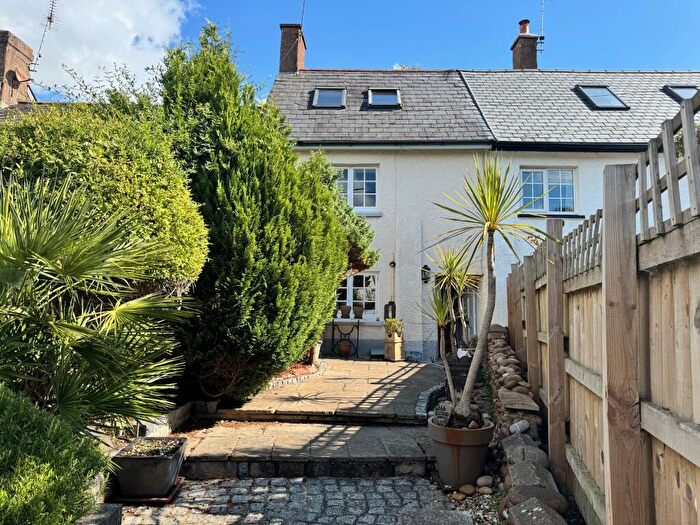
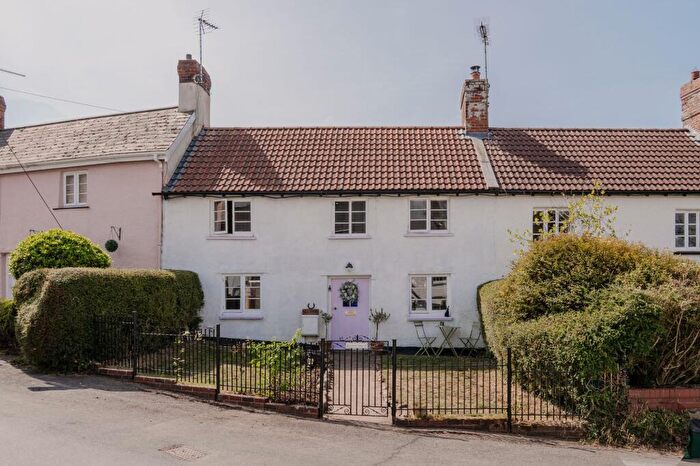
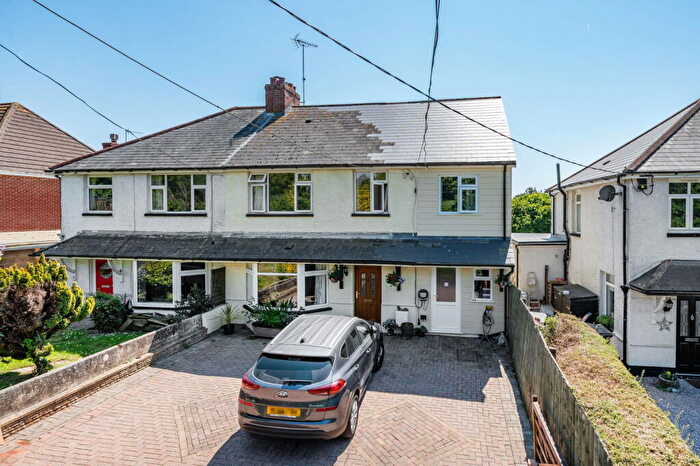
Properties in Woodbury And Lympstone have an average house price of £577,764.00 and had 68 Property Transactions within the last 3 years¹.
Woodbury And Lympstone is an area in Exeter, Devon with 950 households², where the most expensive property was sold for £2,300,000.00.
Properties for sale in Woodbury And Lympstone
Roads and Postcodes in Woodbury And Lympstone
Navigate through our locations to find the location of your next house in Woodbury And Lympstone, Exeter for sale or to rent.
| Streets | Postcodes |
|---|---|
| Barton Close | EX3 0PE |
| Barton Mews | EX3 0PP |
| Beeches Close | EX5 1JN |
| Bonfire Lane | EX5 1HT |
| Brent Close | EX5 1JH |
| Bretteville Close | EX5 1JQ |
| Broadmead | EX5 1HR |
| Broadway | EX5 1NL EX5 1NN EX5 1NR EX5 1NT EX5 1NX EX5 1NY |
| Castle Cottages | EX5 1HZ |
| Castle Lane | EX5 1EA EX5 1EB |
| Church Steps | EX5 1HW |
| Church Stile Cottages | EX5 1HP |
| Church Street | EX5 1HN |
| Copplestone Cottages | EX5 1NS |
| Cottles Lane | EX5 1EE |
| Couches Lane | EX5 1HL |
| Critchards | EX5 1PE EX5 1RB |
| Drakes Cottages | EX5 1NA |
| Exmouth Road | EX3 0PQ EX3 0PZ |
| Exton Lane | EX3 0PN |
| Flower Street | EX5 1LX EX5 1LY |
| Fulford Way | EX5 1NZ EX5 1PA EX5 1PB EX5 1PD |
| Furze Road | EX5 1PF |
| Gilbrook Close | EX5 1AX |
| Globe Hill | EX5 1JP EX5 1JR EX5 1JS |
| Globe Hill Cottages | EX5 1JW |
| Green Lane | EX3 0PW |
| Greenway | EX5 1LN EX5 1LP EX5 1LR EX5 1LW EX5 1RD |
| Haymans Orchard | EX5 1QU |
| Hillsborough | EX5 1HX |
| Iddesleigh Terrace | EX3 0PY |
| Long Meadow | EX5 1JA |
| Long Park | EX5 1JB |
| Mill Lane | EX3 0PH EX3 0PJ |
| Mirey Lane | EX5 1DX |
| New Buildings | EX5 1NW |
| Nurseries Close | EX3 0PG |
| Oakhayes Road | EX5 1HS EX5 1JT |
| Orchard Close | EX5 1ND |
| Park Close | EX5 1NQ |
| Parkway | EX5 1NG |
| Parsonage Way | EX5 1EF EX5 1HU EX5 1HY |
| Pound Lane | EX5 1JE |
| River Front | EX3 0PR |
| Rose Cottages | EX5 1LU |
| Rydon Lane | EX5 1JZ EX5 1LB |
| Station Road | EX3 0PS EX3 0TR |
| Stokes Mead | EX5 1DZ |
| Summerfield | EX5 1JF |
| The Arch | EX5 1FB EX5 1LL |
| The Avenue | EX3 0PX |
| The Bungalows | EX5 1NU |
| The Green | EX5 1LT |
| Toby Lane | EX5 1QB |
| Town Lane | EX5 1NB EX5 1NE EX5 1NF EX5 1NH |
| Woodmanton | EX5 1HG EX5 1HQ |
| EX3 0PL EX5 1ED EX5 1EH EX5 1JD EX5 1JG EX5 1JX EX5 1JY EX5 1LA EX5 1LD EX5 1LG EX5 1LH EX5 1LQ EX5 1LZ EX5 1NJ |
Transport near Woodbury And Lympstone
- FAQ
- Price Paid By Year
- Property Type Price
Frequently asked questions about Woodbury And Lympstone
What is the average price for a property for sale in Woodbury And Lympstone?
The average price for a property for sale in Woodbury And Lympstone is £577,764. This amount is 63% higher than the average price in Exeter. There are 386 property listings for sale in Woodbury And Lympstone.
What streets have the most expensive properties for sale in Woodbury And Lympstone?
The streets with the most expensive properties for sale in Woodbury And Lympstone are Green Lane at an average of £1,321,250, Barton Close at an average of £1,038,333 and Cottles Lane at an average of £1,002,500.
What streets have the most affordable properties for sale in Woodbury And Lympstone?
The streets with the most affordable properties for sale in Woodbury And Lympstone are Drakes Cottages at an average of £170,000, Stokes Mead at an average of £185,000 and Parkway at an average of £295,000.
Which train stations are available in or near Woodbury And Lympstone?
Some of the train stations available in or near Woodbury And Lympstone are Exton, Lympstone Commando and Lympstone Village.
Property Price Paid in Woodbury And Lympstone by Year
The average sold property price by year was:
| Year | Average Sold Price | Price Change |
Sold Properties
|
|---|---|---|---|
| 2025 | £529,548 | -22% |
24 Properties |
| 2024 | £648,694 | 12% |
18 Properties |
| 2023 | £573,165 | -15% |
26 Properties |
| 2022 | £657,298 | 24% |
46 Properties |
| 2021 | £496,819 | 10% |
50 Properties |
| 2020 | £447,655 | 19% |
36 Properties |
| 2019 | £361,915 | -12% |
33 Properties |
| 2018 | £405,680 | -7% |
36 Properties |
| 2017 | £434,387 | 6% |
40 Properties |
| 2016 | £406,432 | -4% |
31 Properties |
| 2015 | £421,784 | 6% |
40 Properties |
| 2014 | £394,541 | 5% |
50 Properties |
| 2013 | £374,651 | -4% |
44 Properties |
| 2012 | £390,537 | 5% |
37 Properties |
| 2011 | £372,375 | 0,4% |
52 Properties |
| 2010 | £370,779 | 2% |
33 Properties |
| 2009 | £363,439 | 14% |
38 Properties |
| 2008 | £313,714 | -12% |
24 Properties |
| 2007 | £352,828 | 14% |
46 Properties |
| 2006 | £303,998 | -4% |
60 Properties |
| 2005 | £317,014 | 7% |
52 Properties |
| 2004 | £295,735 | 22% |
58 Properties |
| 2003 | £230,181 | 17% |
60 Properties |
| 2002 | £191,833 | 21% |
55 Properties |
| 2001 | £151,133 | -2% |
59 Properties |
| 2000 | £153,888 | 31% |
55 Properties |
| 1999 | £106,914 | -11% |
52 Properties |
| 1998 | £119,192 | 3% |
41 Properties |
| 1997 | £115,717 | 16% |
59 Properties |
| 1996 | £97,166 | -4% |
39 Properties |
| 1995 | £101,306 | - |
38 Properties |
Property Price per Property Type in Woodbury And Lympstone
Here you can find historic sold price data in order to help with your property search.
The average Property Paid Price for specific property types in the last three years are:
| Property Type | Average Sold Price | Sold Properties |
|---|---|---|
| Semi Detached House | £397,764.00 | 17 Semi Detached Houses |
| Detached House | £810,196.00 | 34 Detached Houses |
| Terraced House | £292,900.00 | 17 Terraced Houses |

