
Houses for sale in Raleigh, Exeter
House Prices in Raleigh
Properties in Raleigh have an average house price of £546k and had 22 Property Transactions within the last 3 years¹.
Raleigh is an area in Exeter, Devon with 311 households², where the most expensive property was sold for £1.75M.
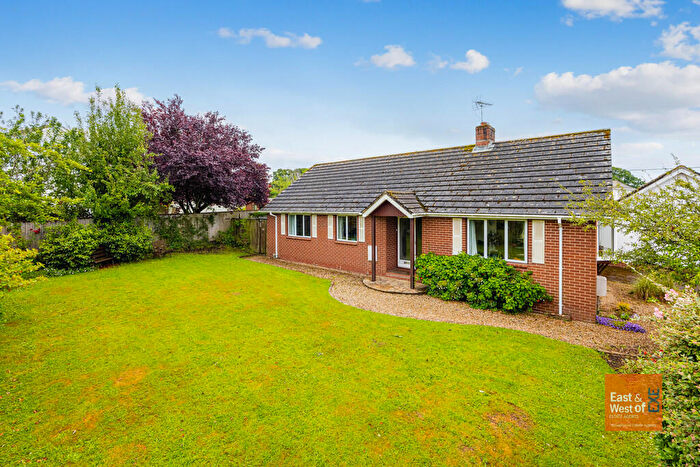
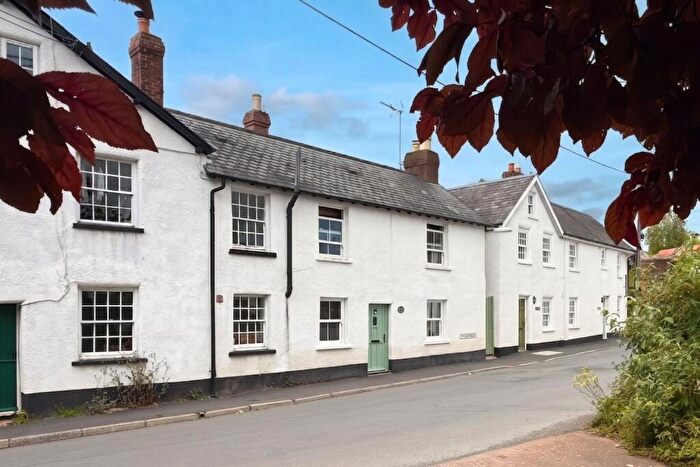
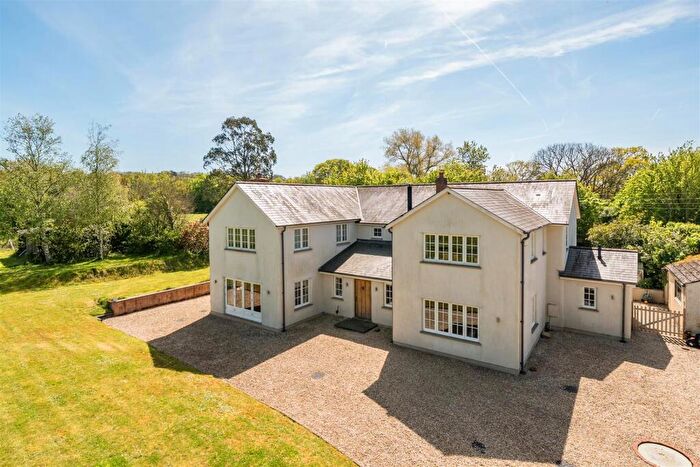
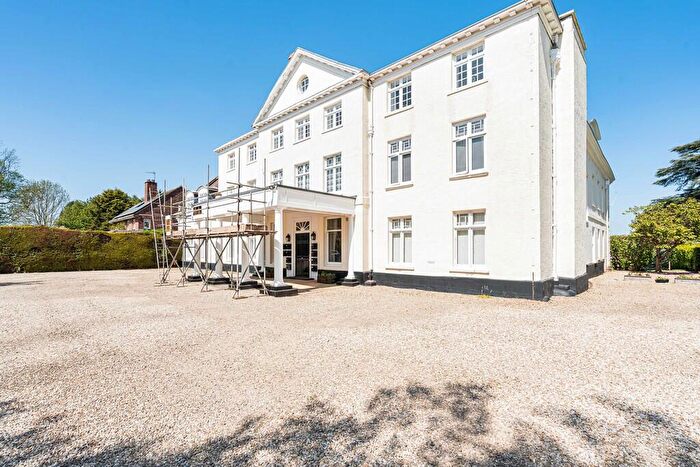
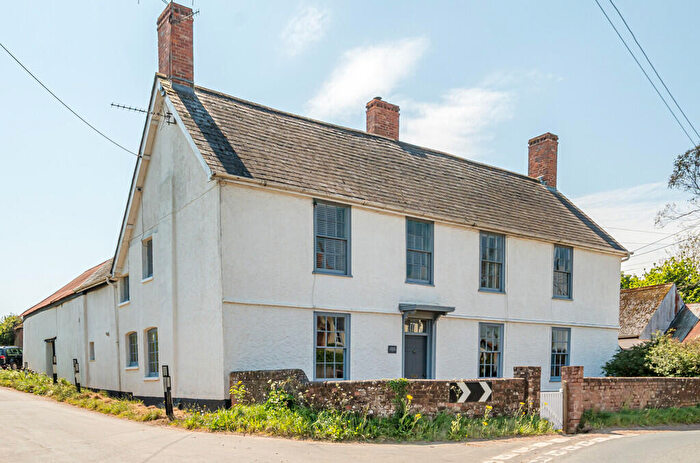
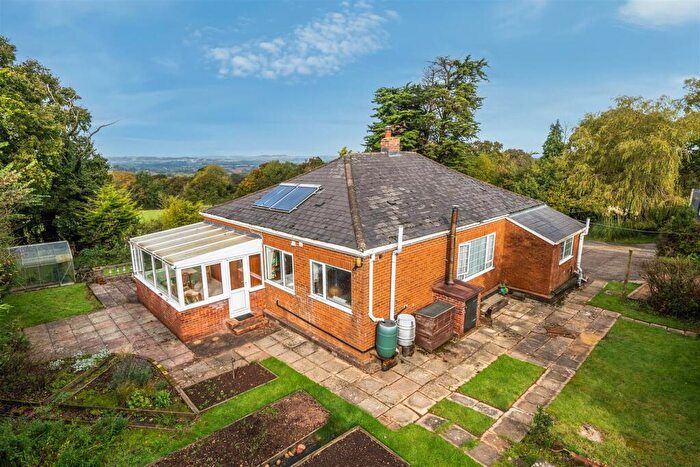
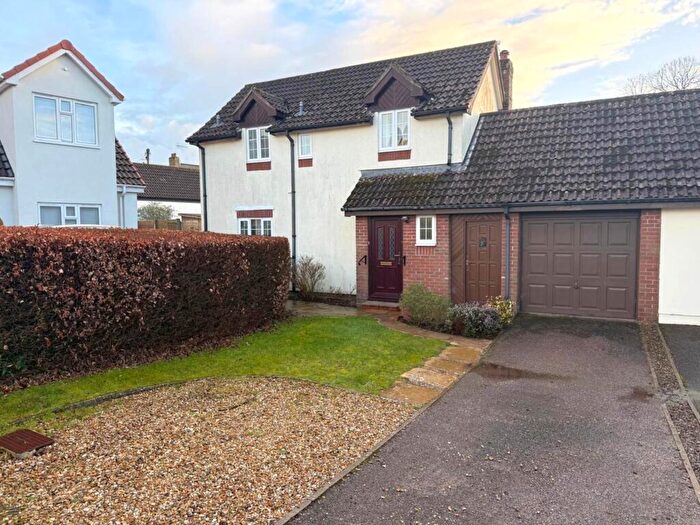
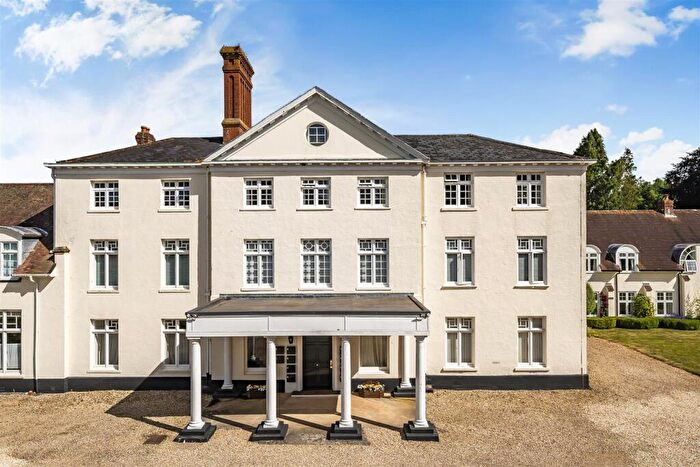
Properties for sale in Raleigh
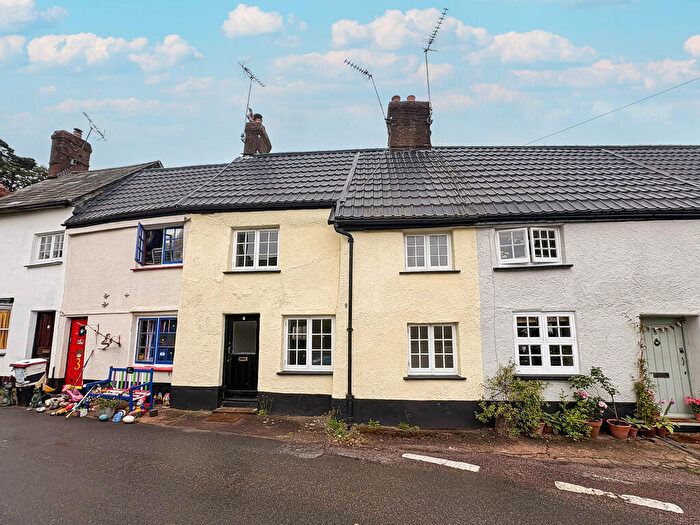

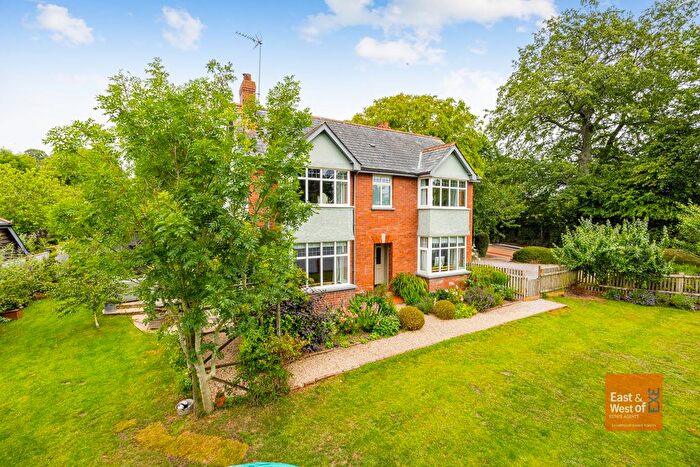
![]()
If you are looking to sell your house, let it out, or receive a property valuation, an expert can help you.
Click the button below to get started.
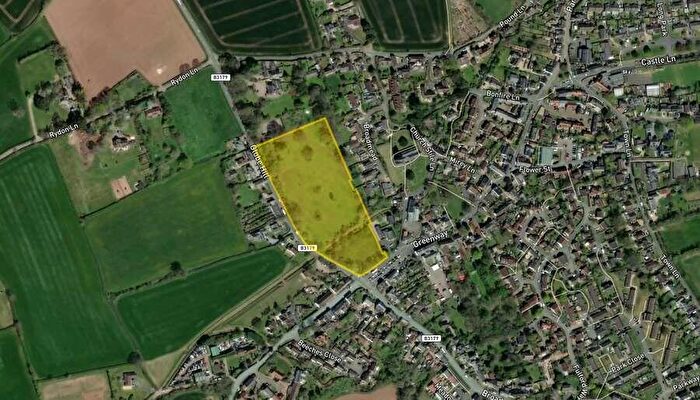
Roads and Postcodes in Raleigh
Navigate through our locations to find the location of your next house in Raleigh, Exeter for sale or to rent.
| Streets | Postcodes |
|---|---|
| Bonds Lane | EX5 1QD EX5 1QF |
| Greendale Barton | EX5 1EL |
| Honey Lane | EX5 1EJ |
| New Way | EX5 1PW |
| Parkhayes | EX5 1QS |
| Sages Lea | EX5 1RA |
| Sanctuary Lane | EX5 1ET EX5 1EU EX5 1EX |
| Sidmouth Road | EX5 2JJ EX5 2JR EX5 2JT EX5 2JW |
| Stony Lane | EX5 1PP |
| Toby Lane | EX5 1PU |
| Village Road | EX5 1PG EX5 1PR EX5 1PS |
| White Cross Road | EX5 1EN |
| EX5 1AJ EX5 1AL EX5 1AP EX5 1EW EX5 1EZ EX5 1PH EX5 1PQ EX5 1PT EX5 1PX EX5 1PY |
Property price trends in Raleigh
According to the latest Land Registry data, the average home in Raleigh sold for £554,666 in 2025. That figure comes from 264 sales logged over the past 30 years.
Prices have continued to climb over the last three years. Compared with 2022, when the typical sale came in around £473,333, that's a rise of roughly 17.2%.
Looking back five years, average prices are down about 0.5% since 2020, a drop of around £2,834 in cash terms.
Zoom out to the past decade for the fuller picture. Back in 2015, homes here averaged £344,571, so the typical sold price has climbed about 61% since then, roughly 4.9% a year. Stretch the view to fifteen years and that annual pace eases back to about 1.6%.
Frequently asked questions about Raleigh
What is the average price for a property for sale in Raleigh?
The average price for a property for sale in Raleigh is £545,712. This amount is 54% higher than the average price in Exeter. There are 410 property listings for sale in Raleigh.
What streets have the most expensive properties for sale in Raleigh?
The streets with the most expensive properties for sale in Raleigh are Sanctuary Lane at an average of £1,183,666, Honey Lane at an average of £840,000 and Village Road at an average of £465,000.
What streets have the most affordable properties for sale in Raleigh?
The streets with the most affordable properties for sale in Raleigh are New Way at an average of £190,000, Sages Lea at an average of £298,666 and Sidmouth Road at an average of £365,088.
Which train stations are available in or near Raleigh?
Some of the train stations available in or near Raleigh are Exton, Lympstone Commando and Topsham.
Property Price Paid in Raleigh by Year
The average sold property price by year was:
| Year | Average Sold Price | Price Change |
Sold Properties
|
|---|---|---|---|
| 2025 | £554,666 | 5% |
6 Properties |
| 2024 | £524,397 | -7% |
8 Properties |
| 2023 | £560,312 | 16% |
8 Properties |
| 2022 | £473,333 | 22% |
3 Properties |
| 2021 | £371,428 | -50% |
7 Properties |
| 2020 | £557,500 | 37% |
8 Properties |
| 2019 | £351,250 | -5% |
6 Properties |
| 2018 | £367,937 | -18% |
8 Properties |
| 2017 | £434,937 | 13% |
8 Properties |
| 2016 | £378,845 | 9% |
10 Properties |
Property Price per Property Type in Raleigh
Here you can find historic sold price data in order to help with your property search.
The average Property Paid Price for specific property types in the last three years are:
| Property Type | Average Sold Price | Sold Properties |
|---|---|---|
| Semi Detached House | £488,125.00 | 4 Semi Detached Houses |
| Terraced House | £210,333.00 | 6 Terraced Houses |
| Detached House | £732,598.00 | 12 Detached Houses |
