
Houses for sale & to rent in TQ7 1BH, Montagu Mews, Kingsbridge North, Kingsbridge
House Prices in TQ7 1BH, Montagu Mews, Kingsbridge North
Properties in TQ7 1BH have no sales history available within the last 3 years. TQ7 1BH is a postcode in Montagu Mews located in Kingsbridge North, an area in Kingsbridge, Devon, with 6 households².
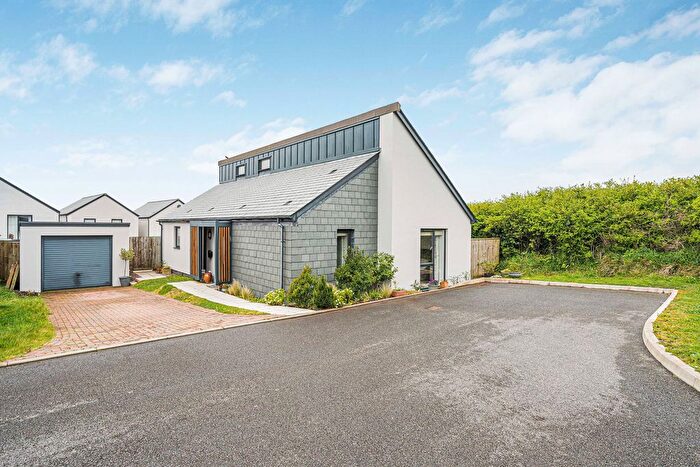
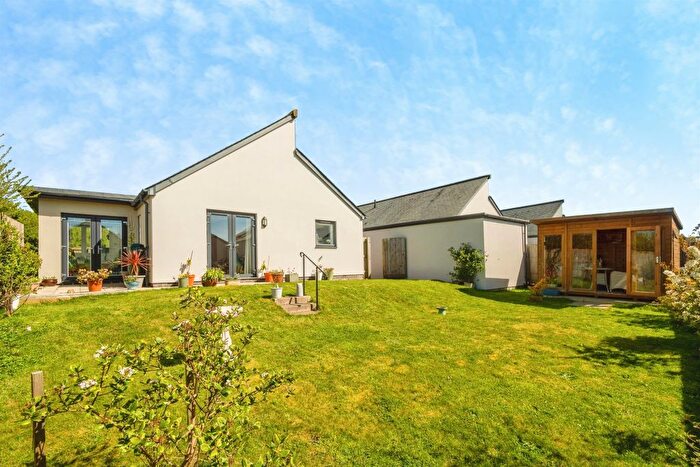
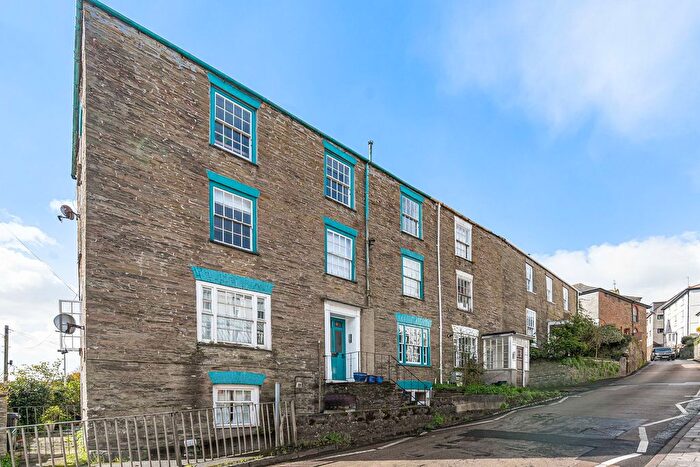
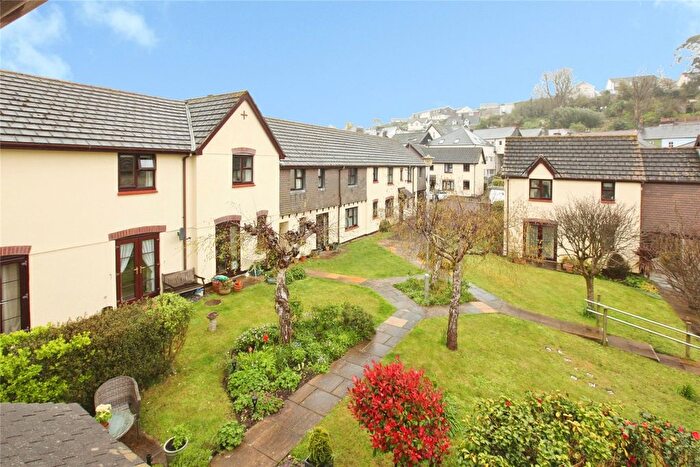
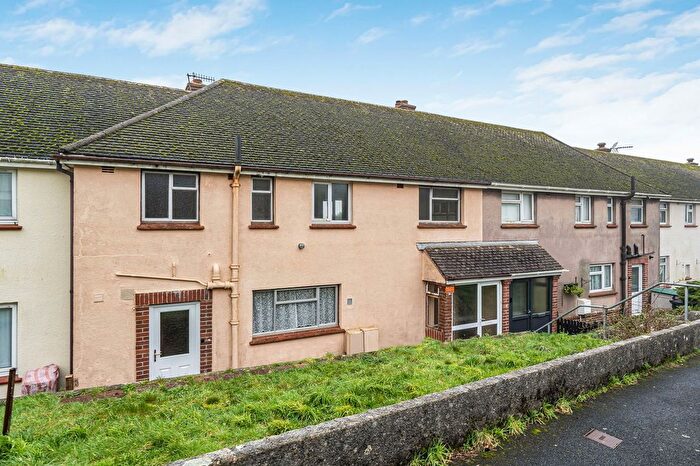
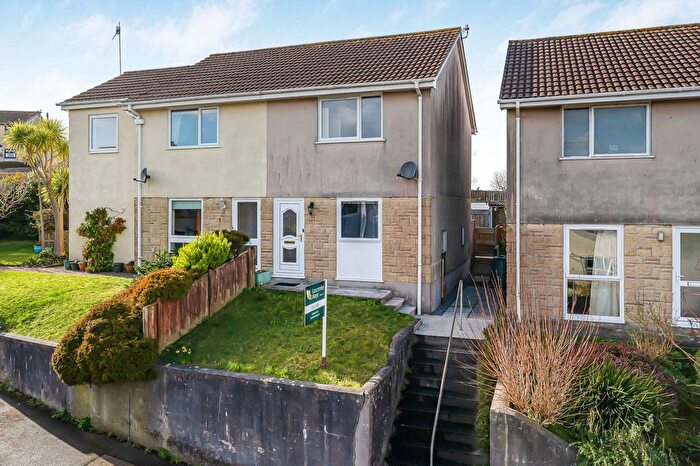
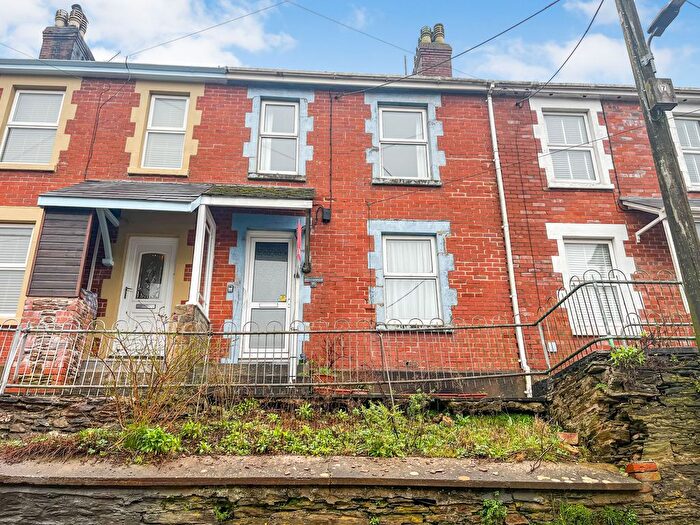
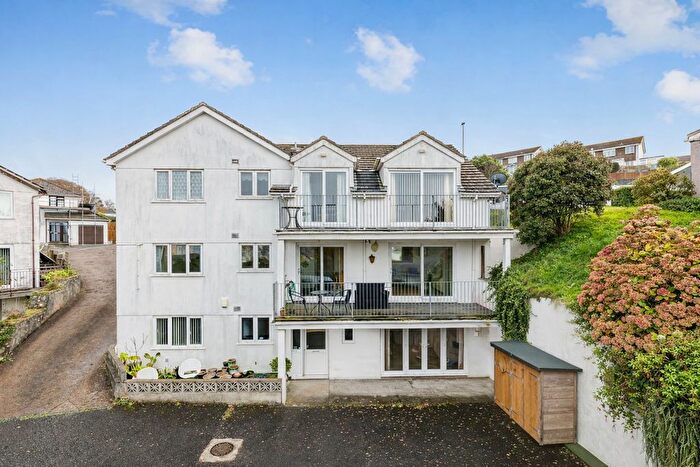
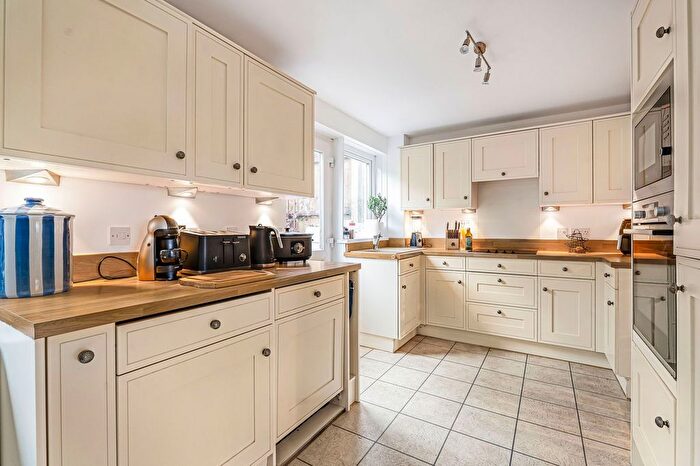
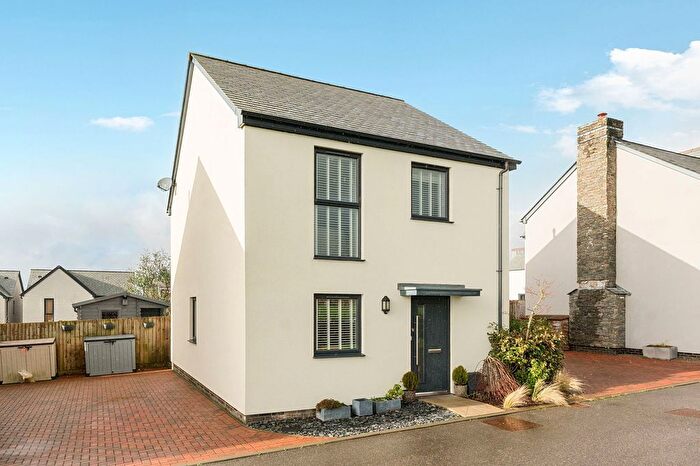
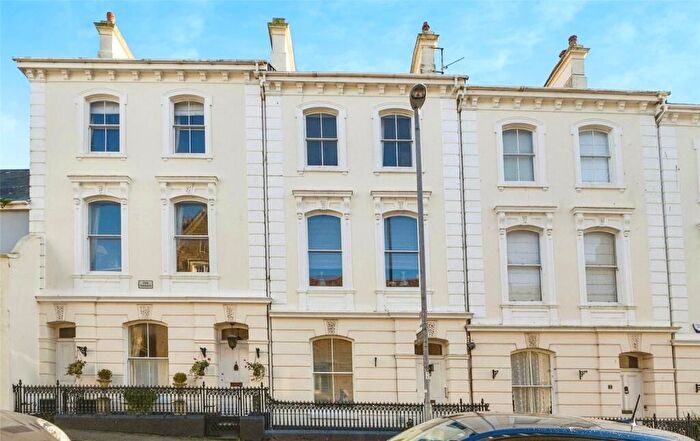
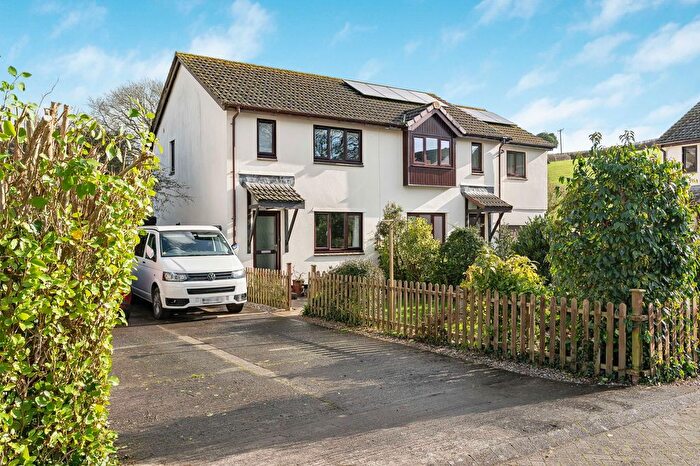
Properties for sale near TQ7 1BH, Montagu Mews
![]()
If you are looking to sell your house, let it out, or receive a property valuation, an expert can help you.
Click the button below to get started.
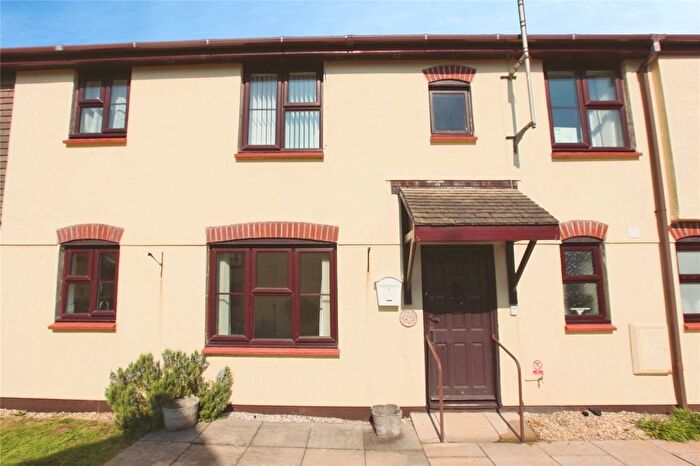
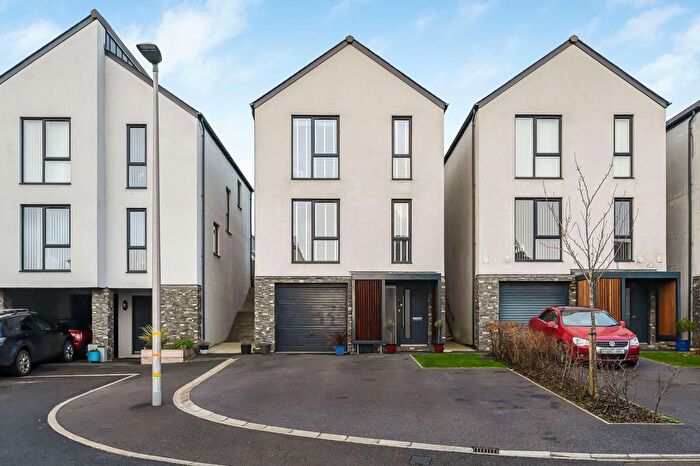
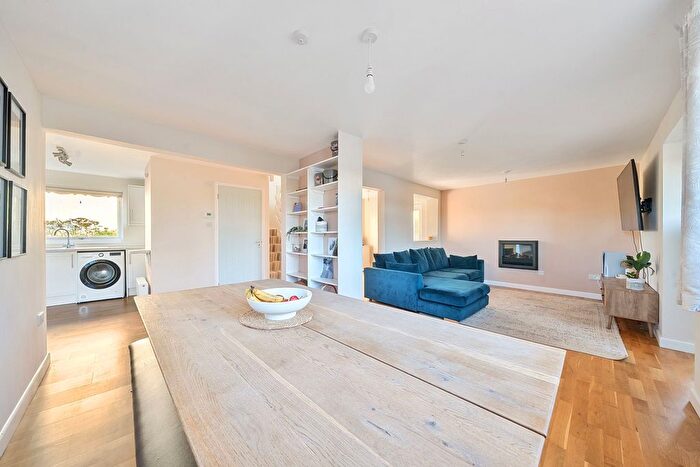
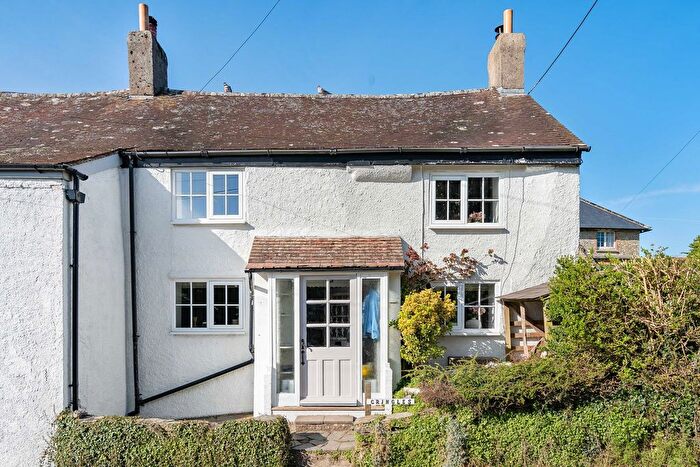
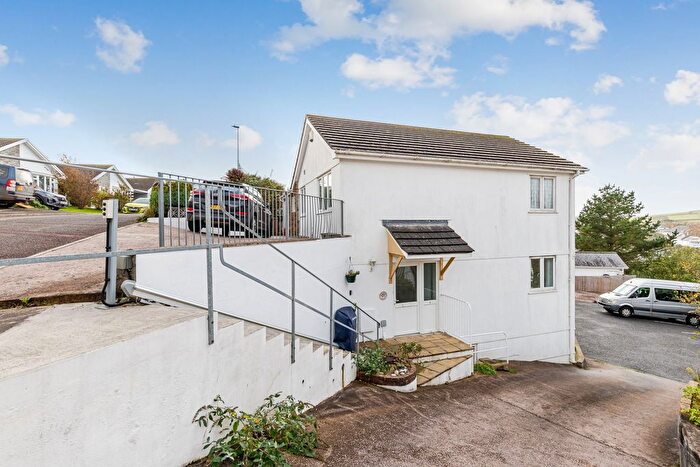
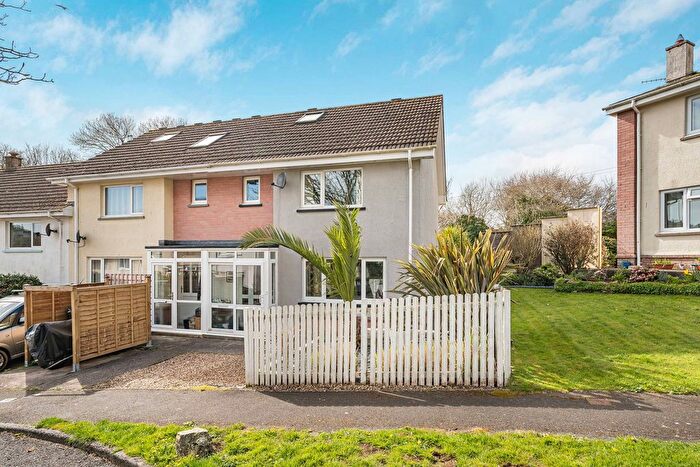
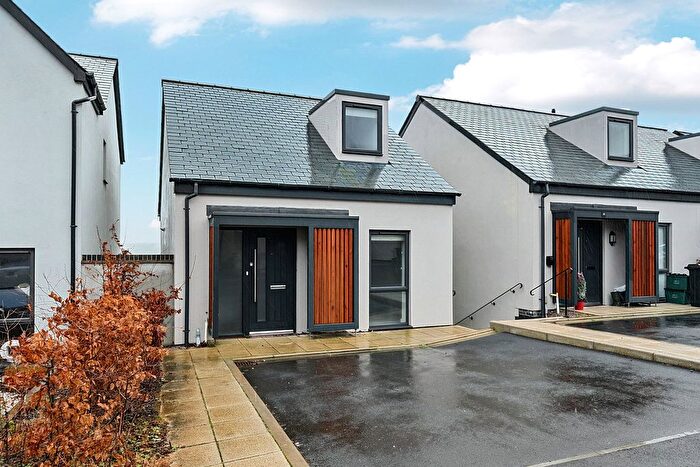
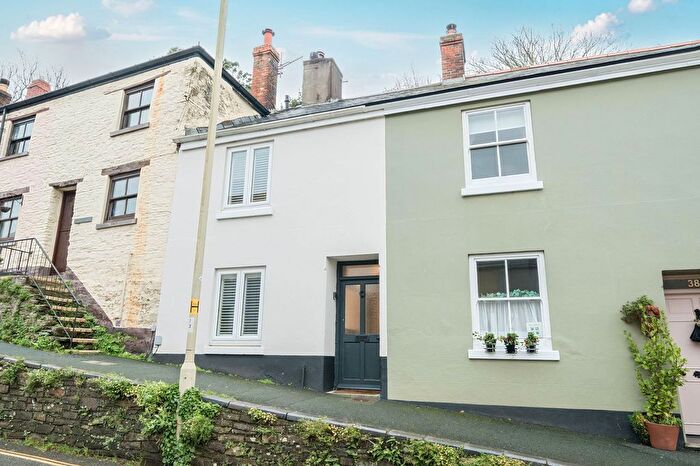
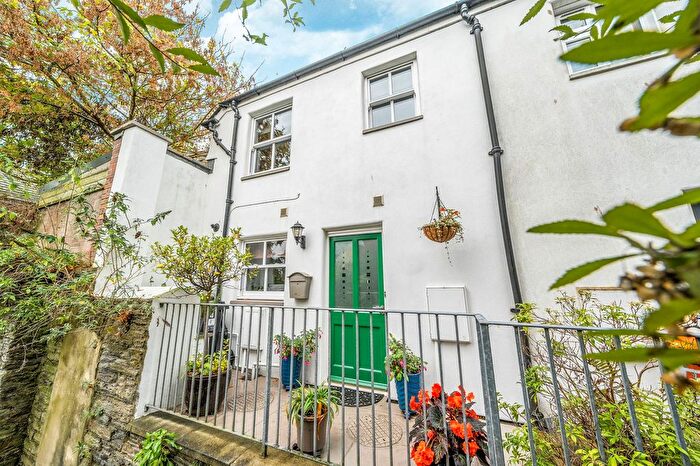
Previously listed properties near TQ7 1BH, Montagu Mews
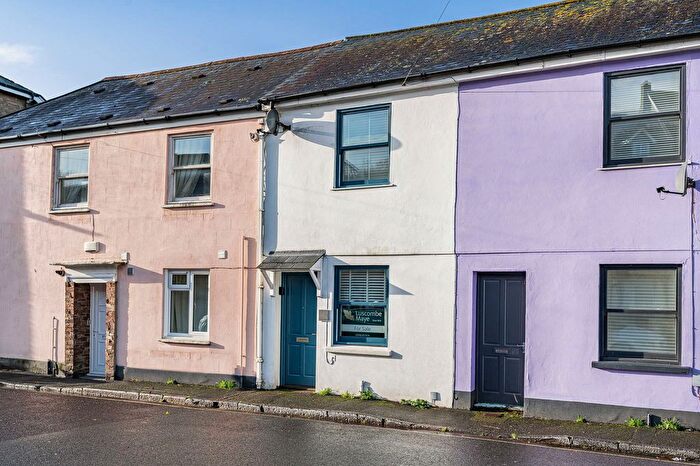
![]()
If you are looking to sell your house, let it out, or receive a property valuation, an expert can help you.
Click the button below to get started.

Price Paid in Montagu Mews, TQ7 1BH, Kingsbridge North
4 Montagu Mews, TQ7 1BH, Kingsbridge North Kingsbridge
Property 4 has been sold 1 time. The last time it was sold was in 27/08/2021 and the sold price was £56,000.00.
This flat, sold as a leasehold on 27/08/2021, is a 56 sqm mid-terrace house with an EPC rating of C.
| Date | Price | Property Type | Tenure | Classification |
|---|---|---|---|---|
| 27/08/2021 | £56,000.00 | Flat | leasehold | Established Building |
6 Montagu Mews, TQ7 1BH, Kingsbridge North Kingsbridge
Property 6 has been sold 2 times. The last time it was sold was in 14/09/2018 and the sold price was £137,950.00.
This semi detached house, sold as a freehold on 14/09/2018, is a 41 sqm semi-detached bungalow with an EPC rating of C.
| Date | Price | Property Type | Tenure | Classification |
|---|---|---|---|---|
| 14/09/2018 | £137,950.00 | Semi Detached House | freehold | Established Building |
| 28/05/2010 | £42,000.00 | Terraced House | leasehold | Established Building |
3 Montagu Mews, TQ7 1BH, Kingsbridge North Kingsbridge
Property 3 has been sold 1 time. The last time it was sold was in 27/02/2009 and the sold price was £75,500.00.
This is a Flat which was sold as a leasehold in 27/02/2009
| Date | Price | Property Type | Tenure | Classification |
|---|---|---|---|---|
| 27/02/2009 | £75,500.00 | Flat | leasehold | Established Building |
Transport near TQ7 1BH, Montagu Mews

House price paid reports for TQ7 1BH, Montagu Mews
Click on the buttons below to see price paid reports by year or property price:
- Price Paid By Year
Property Price Paid in TQ7 1BH, Montagu Mews by Year
The average sold property price by year was:
| Year | Average Sold Price | Price Change |
Sold Properties
|
|---|---|---|---|
| 2021 | £56,000 | -146% |
1 Property |
| 2018 | £137,950 | 70% |
1 Property |
| 2010 | £42,000 | -80% |
1 Property |
| 2009 | £75,500 | - |
1 Property |