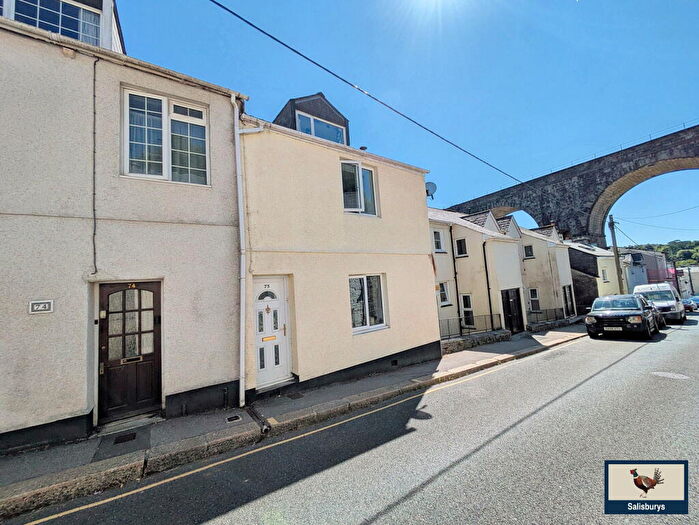
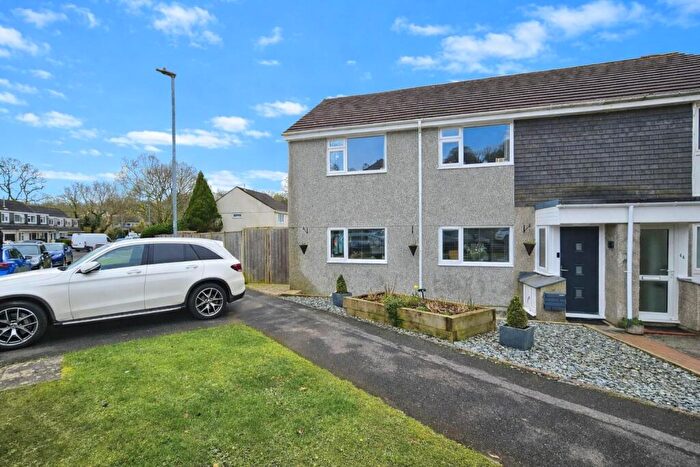
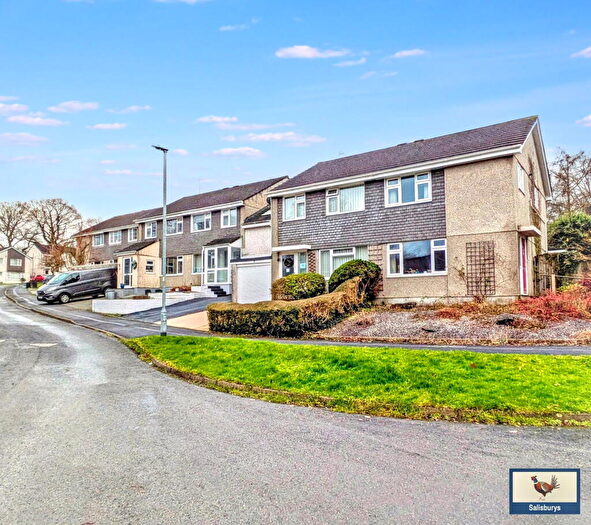
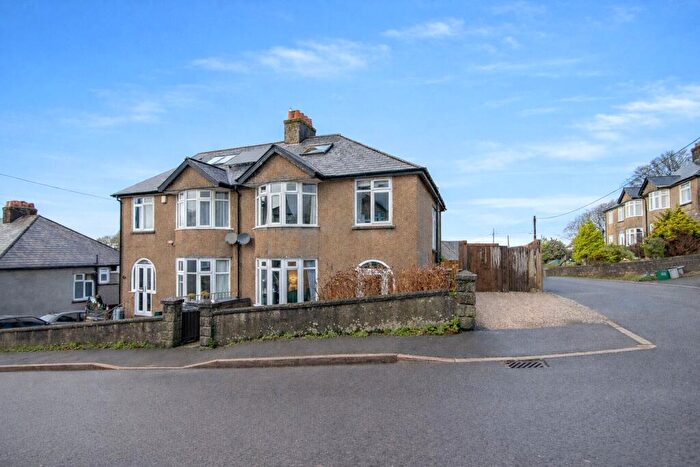
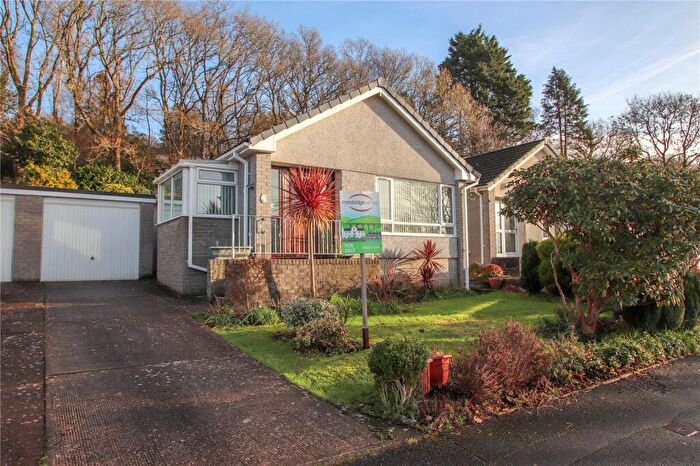
Houses for sale & to rent in Tavistock South West, Tavistock
House Prices in Tavistock South West
Properties in Tavistock South West have an average house price of £267,197.00 and had 101 Property Transactions within the last 3 years¹.
Tavistock South West is an area in Tavistock, Devon with 1,088 households², where the most expensive property was sold for £595,000.00.
Properties for sale in Tavistock South West
Roads and Postcodes in Tavistock South West
Navigate through our locations to find the location of your next house in Tavistock South West, Tavistock for sale or to rent.
| Streets | Postcodes |
|---|---|
| Abbey Rise | PL19 9FE |
| Alder Road | PL19 9LW |
| Anderton Close | PL19 9RA |
| Anderton Court | PL19 9EX |
| Anderton Lane | PL19 9DX |
| Aspen Close | PL19 9LN |
| Beadle Court | PL19 8HJ |
| Beech Close | PL19 9DW |
| Birchwood Close | PL19 8DR |
| Brook Lane | PL19 9DP PL19 9ET PL19 9BA |
| Buzzard Road | PL19 9FY PL19 9FZ |
| Canons Gate | PL19 8FD |
| Chestnut Close | PL19 9JJ |
| Cramber Close | PL19 8SG |
| Crelake Close | PL19 9AX |
| Crelake Industrial Estate | PL19 9RL |
| Crowndale Road | PL19 8DD |
| Daucus Close | PL19 8DN |
| Dipper Drive | PL19 9FS |
| Elm Close | PL19 9AP |
| Foggintor Grove | PL19 8GE |
| Goldfinch Gardens | PL19 9FR |
| Grenville Drive | PL19 8DP |
| Grenville Meadow | PL19 8FE |
| Hawthorn Road | PL19 9DL |
| Hazel Road | PL19 9DN |
| James Road | PL19 9NJ |
| Kestrel Park | PL19 9FX |
| Kilworthy Park | PL19 1ZZ |
| Kingfisher Close | PL19 9FW |
| Kings Tor Drive | PL19 8GD |
| Leeden Tor Close | PL19 8GA |
| Maple Close | PL19 9LL |
| Mulberry Grove | PL19 9LG |
| Oak Road | PL19 9EZ PL19 9LJ |
| Parade Business Park | PL19 9RQ |
| Philpott Lane | PL19 9FB |
| Pixon Lane | PL19 9AZ |
| Plymouth Road | PL19 8BY PL19 8BZ PL19 9DS PL19 9DT PL19 8BX |
| Plymouth Road Industrial Estate | PL19 9QN |
| Ransum Way | PL19 8DT PL19 8PT |
| Rowan Close | PL19 9NH |
| School Road | PL19 9SR |
| Sharpitor Lane | PL19 8GG |
| Skylark Rise | PL19 9FT |
| Staple Tor Road | PL19 8FY PL19 8FZ |
| Swelltor Drive | PL19 8GF |
| Sycamore Avenue | PL19 9NL |
| Tiddy Close | PL19 9BS |
| Trinity Way | PL19 8PS |
| Walreddon Close | PL19 8DW |
| West View | PL19 9EE |
| Westbridge Cottages | PL19 8DQ |
| Westbridge Industrial Estate | PL19 8DG |
| Whitchurch Road | PL19 9AS |
| Willow Road | PL19 9JH |
| Woodpecker Way | PL19 9FQ |
| Yellowmead Tor Close | PL19 8GB |
| PL19 0XJ PL19 1DU PL19 1EE PL19 1EH PL19 1EL PL19 1ET PL19 1EU PL19 1EX PL19 1EY PL19 1EZ PL19 1FA PL19 1FB PL19 8JR PL19 8WZ PL19 8YG PL19 9DU PL19 1FF PL19 1FH PL19 1FJ PL19 1FN PL19 1FP |
Transport near Tavistock South West
- FAQ
- Price Paid By Year
- Property Type Price
Frequently asked questions about Tavistock South West
What is the average price for a property for sale in Tavistock South West?
The average price for a property for sale in Tavistock South West is £267,197. This amount is 21% lower than the average price in Tavistock. There are 899 property listings for sale in Tavistock South West.
What streets have the most expensive properties for sale in Tavistock South West?
The streets with the most expensive properties for sale in Tavistock South West are Brook Lane at an average of £595,000, Anderton Close at an average of £490,000 and James Road at an average of £460,000.
What streets have the most affordable properties for sale in Tavistock South West?
The streets with the most affordable properties for sale in Tavistock South West are Skylark Rise at an average of £171,666, Westbridge Cottages at an average of £185,045 and Grenville Meadow at an average of £188,750.
Which train stations are available in or near Tavistock South West?
Some of the train stations available in or near Tavistock South West are Gunnislake, Calstock and Bere Alston.
Property Price Paid in Tavistock South West by Year
The average sold property price by year was:
| Year | Average Sold Price | Price Change |
Sold Properties
|
|---|---|---|---|
| 2025 | £273,086 | 5% |
29 Properties |
| 2024 | £259,363 | -4% |
33 Properties |
| 2023 | £269,446 | -8% |
39 Properties |
| 2022 | £291,035 | 26% |
42 Properties |
| 2021 | £215,345 | 0,3% |
62 Properties |
| 2020 | £214,616 | 0,1% |
30 Properties |
| 2019 | £214,473 | 0,2% |
41 Properties |
| 2018 | £214,123 | 8% |
46 Properties |
| 2017 | £197,368 | -12% |
40 Properties |
| 2016 | £220,379 | 10% |
57 Properties |
| 2015 | £197,307 | 8% |
45 Properties |
| 2014 | £181,670 | -2% |
56 Properties |
| 2013 | £185,556 | -4% |
53 Properties |
| 2012 | £192,540 | 9% |
41 Properties |
| 2011 | £174,845 | -5% |
33 Properties |
| 2010 | £183,851 | 14% |
84 Properties |
| 2009 | £158,309 | -5% |
81 Properties |
| 2008 | £166,683 | -14% |
51 Properties |
| 2007 | £189,489 | 4% |
79 Properties |
| 2006 | £181,444 | 14% |
50 Properties |
| 2005 | £156,171 | 3% |
23 Properties |
| 2004 | £151,283 | 6% |
33 Properties |
| 2003 | £141,575 | 18% |
64 Properties |
| 2002 | £116,148 | 22% |
45 Properties |
| 2001 | £90,332 | 19% |
43 Properties |
| 2000 | £73,029 | 5% |
45 Properties |
| 1999 | £69,626 | 6% |
50 Properties |
| 1998 | £65,150 | 16% |
34 Properties |
| 1997 | £55,026 | 13% |
48 Properties |
| 1996 | £48,022 | -3% |
46 Properties |
| 1995 | £49,548 | - |
23 Properties |
Property Price per Property Type in Tavistock South West
Here you can find historic sold price data in order to help with your property search.
The average Property Paid Price for specific property types in the last three years are:
| Property Type | Average Sold Price | Sold Properties |
|---|---|---|
| Semi Detached House | £268,442.00 | 35 Semi Detached Houses |
| Detached House | £394,705.00 | 17 Detached Houses |
| Terraced House | £236,065.00 | 30 Terraced Houses |
| Flat | £199,971.00 | 19 Flats |

